Abstract
Activating mutations in the RAC1 gene have recently been discovered as driver events in malignant melanoma. Expression of this gene is associated with melanocyte proliferation, and melanoma cells bearing this mutation are insensitive to BRAF inhibitors such as vemurafenib and dabrafenib, and also may evade immune surveillance due to enhanced expression of PD-L1. Activating mutations in RAC1 are of special interest, as small molecule inhibitors for the RAC effector p21-activated kinase (PAK) are in late-stage clinical development and might impede oncogenic signaling from mutant RAC1.
In this work, we explore the effects of PAK inhibition on RAC1P29S signaling in zebrafish embryonic development, in the proliferation, survival, and motility of RAC1P29S-mutant human melanoma cells, and on tumor formation and progression from such cells in mice. We report that RAC1P29S evokes a Rasopathy-like phenotype on zebrafish development that can be blocked by inhibitors of PAK or MEK. We also found and that RAC1 mutant human melanoma cells are resistant to clinical inhibitors of BRAF but are uniquely sensitive to PAK inhibitors. These data suggest that suppressing the PAK pathway might be of therapeutic benefit in this type of melanoma.
Keywords: malignant melanoma, Rho-family GTPases, signal transduction, protein kinases, p21-activated kinase, small molecule inhibitors
Introduction
Beginning with the discovery of the causative role of BRAF mutations in a large percentage of human melanomas, a variety of additional driver mutations have been identified, including recent discoveries of activating mutations in the guanine-nucleotide exchange factor PREX2 (~14% of melanomas) and its small GTPase substrate, RAC1 (4–9%). Following activating mutations in genes that encode BRAF and NRAS, the RAC1 P29S amino acid change represents the next most frequently observed protein-coding hot-spot mutation in melanoma.4, 11, 15 Expression of this gene is associated with melanocyte proliferation, and melanoma cells bearing this mutation are insensitive to BRAF inhibitors such as vemurafenib and dabrafenib,15, 30 and also may evade immune surveillance due to enhanced expression of PD-L129. While the P29S RAC1 mutation is most commonly encountered in malignant melanoma, P29L is also observed, as well as less frequent mutations at additional residues within the switch I and II regions of the RAC1 protein.29. In addition, a P29S mutation has also been identified in the RAC2 gene in a patient with malignant melanoma.13 Activating mutations in RAC1 are of special interest, as small molecule inhibitors for the RAC1 effector p21-activated kinase (PAK) are in late-stage clinical development and might be of therapeutic benefit in this setting.
RAC1 is a small GTPase that has key roles in regulating cell shape, motility, survival, and division, and is essential for the oncogenic activity of RAS.24 Like its relative RAS, when in the GTP-bound state, RAC1 binds to and signals through a variety of effector proteins. The best-understood effectors for RAC are the group A PAKs: PAK1, -2, and -3.25 Of these, PAK1 is overexpressed in a subset of BRAF WT melanomas due to amplification of the PAK1 gene, and such cells are sensitive to PAK inhibitors or siRNA.22 PAKs regulate a multitude of cellular processes including transcription, translation, cell motility, survival, proliferation, and organization of the cytoskeleton25. Interestingly, among the most firmly established substrates of PAK1 are c-RAF and MEK1, and we and others have shown that loss of PAK1 activity leads to loss of c-RAF, MEK1, and subsequent ERK activation in many cell types25. While PAK1 also has many other substrates besides c-RAF and MEK1 that mediate its cellular effects, recent genetic and pharmacologic data show that the PAK/MEK/ERK signaling axis is essential for RAS-driven transformation in a mouse model of skin cancer3.
Because Group A PAKs play such important roles in RAC1 signaling pathways, it is reasonable to assume that these kinases might be required for the growth, survival, and/or movement of RAC1P29S-mutant melanoma cells. In this work, we explore the effects of PAK inhibition on RAC1P29S signaling in zebrafish embryonic development, in the proliferation, survival, and motility of RAC1P29S-mutant human melanoma cells, and on tumor formation and progression from such cells in mice. We found that, like activated BRAF and KRAS, RAC1P29S induces a Rasopathy-like phenotype on zebrafish development that can be blocked by inhibitors of PAK or MEK. We also found that human melanoma cells bearing activating mutations in RAC1 show elevated ERK activity but are not responsive to clinical inhibitors of BRAF; however, such cells are sensitive to inhibitors of PAK and MEK, respectively. These data suggest that suppressing the PAK pathway might be of therapeutic benefit in RAC1-mutant melanoma.
Results
Expression of RAC1P29S modifies zebrafish embryonic development and activates ERK through Group A PAKs
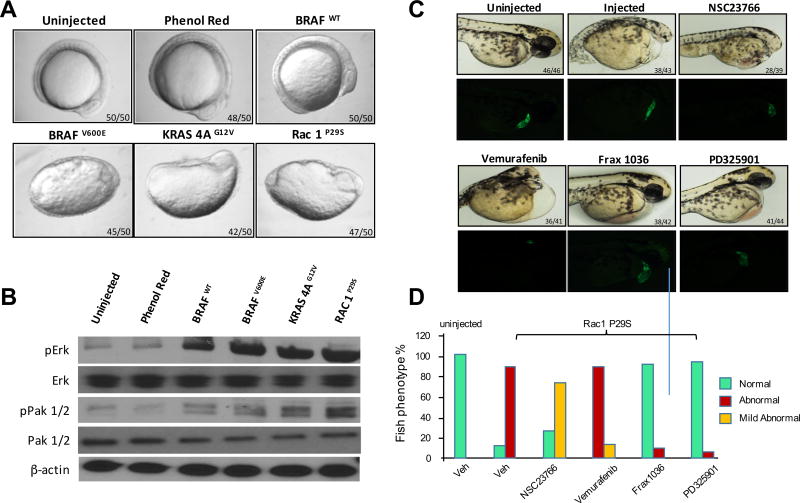
Expression of Rasopathy genes such as activated BRAF, NRAS, and MEK1 induces abnormal development in zebrafish characterized by elongation of the body and aberrant development of anterior embryonic structures including the heart and eye.1, 10, 12 These changes are accompanied by notable activation of ERK, and can be blocked by inhibiting this pathway with small molecule MEK inhibitors.2 As RAC1 activates PAK, which assists in the MEK/ERK pathway via phosphorylation of c-RAF and MEK125, we asked if activated RAC1 affected embryonic development and if these effects were accompanied by PAK and ERK activation. To determine if activated RAC1 affects development, we injected 1-cell zebrafish embryos with mRNAs encoding either WT or activated (V600E) BRAF, activated (G12V) KRAS-4A, or activated (P29S) RAC1, and followed development over a 12h period. As shown in Fig. 1A, expression of WT BRAF was without effect, but expression of activated BRAF, KRAS, or RAC1 all resulted in marked disturbance in body axis. These embryos were then analyzed for signal pathway activation. We found that embryos injected with BRAF, KRAS, or RAC1 mRNA all showed elevated ERK activity (Fig. 1B). PAK activity was also elevated in these embryos, most notably in RAC1 injected fish.
Figure 1. RAC1P29S yields a Rasopathy-like phenotype in zebrafish that requires PAK1 activation.
One-cell embryos were injected with mRNA encoding the indicated genes. A) RNA expression of BRAFV600E, KRAS 4AG12V and Rac1P29S produce phenotypes similar to Rasopathies at 12hpf in zebrafish embryos. B) Overexpression of proteins increases the activity of p-Erk and p-Pak 1/2; β-actin was used as a loading control. Transgenic fish were injected with Rac1 mRNA, C) and D) Tg (CMLC:GFP) embryos injected with Rac1P29S were treated with 1µM inhibitors of RAC1 (NSC23766), BRAF (Vemurafenib), PAK1 (Frax-1036) or MEK (PD325901) at 72 hpf. Phase contrast and GFP images are shown in panel C, and quantitated in panel D. Embryo phenotypes were scored as mild abnormal if elongated (body axis ratio >1.1 but <1.3) and/or small or absent eye development was noted, and abnormal if boxy axis ration was >1.3 and/or pericardial edema was also noted.
As Group I PAKs are key effectors for RAC1, we asked if pharmacologic inhibition of these kinases would alter the effects of RAC1P29S in embryo development. Injection of mRNA encoding activated RAC1 resulted in abnormal development, characterized by pericardial edema, small/absent eyes, and reduced head size, in ~85% of embryos (Fig. 1C and 1D). These abnormalities were partly prevented by incubation of RAC1P29S-injected embryos with the RAC inhibitor NSC23766, and almost completely prevented by the group A PAK inhibitor Frax-1036 (one of the most specific PAK inhibitors known)23, 27 or the MEK inhibitor PD325901. In contrast, the BRAF inhibitor vemurafenib did not prevent developmental abnormalities induced by RAC1P29S. It should be noted that for these and subsequent experiments, the signaling inhibitors were added for during a 1h window between 4.5–5.5hpf and then removed, as prolonged exposure to inhibitors of ERK activation causes severe axis, heart and craniofacial developmental abnormalities.1, 8
PAK inhibitors block effects of RAC1 on zebrafish embryonic development
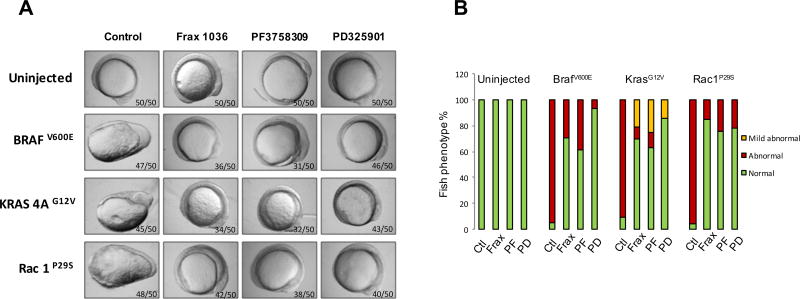
To further examine the effects of PAK inhibition on RAC1 signaling, we tested the effects of additional Pak inhibitors, as well as the MEK inhibitor PD325901, on development in embryos expressing activated BRAF, KRAS, or RAC1. As shown in Fig. 2, expression of BRAFV600E resulted in abnormal development in almost all (57/60) injected embryos. These abnormalities were partly suppressed by the Group I PAK inhibitor Frax-1036 (32/45 normal, 13/45 abnormal) and the pan-PAK inhibitor PF3758309 (24/39 normal, 15/39 abnormal), and almost completely suppressed by the MEK inhibitor PD325901. In the case of activated KRASG12V, the PAK inhibitors were relatively ineffective, whereas the MEK inhibitor was highly effective in blocking abnormal development. When RAC1P29S mRNA was injected into zebrafish embryos, all three inhibitors were highly effective in blocking abnormal development. These results suggest that small molecule PAK inhibitors might be useful impeding the signaling and functional effects of RAC1P29S.
Figure 2. PAK and MEK inhibitors block effects of RAC1 on zebrafish embryonic development.
One-cell embryos were injected with mRNA encoding the indicated genes. 1 µM inhibitors were added to water between 4.5–5.5hpf, then removed and replaced with fresh water. Embryo morphology was scored at 12hpf by a blinded observer. A) Morphology at 12hpf. B) Quantitation of developmental abnormalities.
Response of RAC1-mutant cells to signaling inhibitors
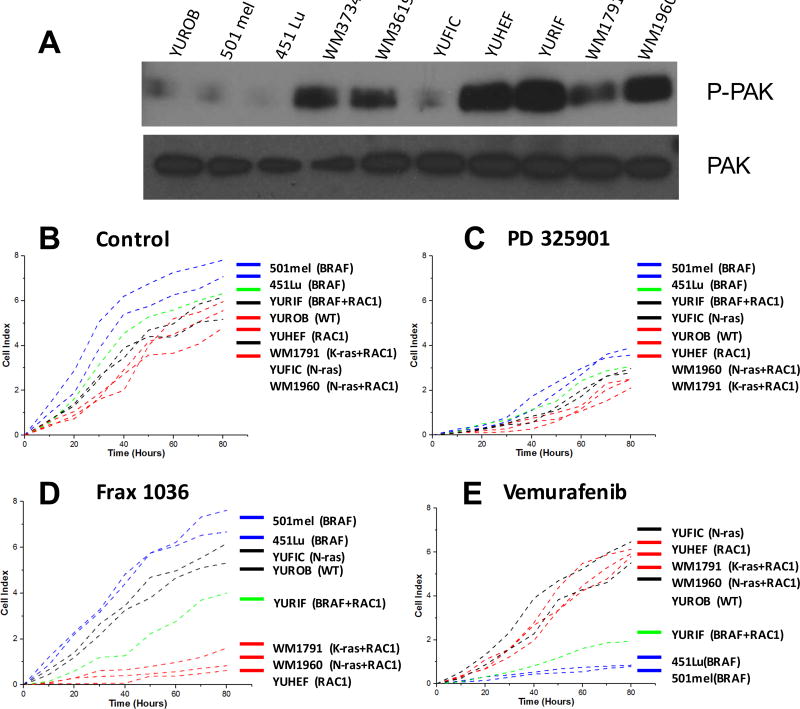
Next, we analyzed the effects of RAC1 mutation in mammalian melanocytes derived from patients (Table 1). We obtained four cell lines containing the RAC1P29S mutation, one with RAC1P29S alone (YUHEF) and three that also bore co-mutations for NRASQ61K (WM1960), KRASG12D (WM1791C), or BRAFV600E (YURIF). Two other cell lines contained activating mutations in the RAC guanine-nucleotide exchange factor PREX2, plus activating mutations in either NRAS (WM3619) or BRAF (WM3734). Two other melanoma cell lines bore mutations in BRAF alone (501mel and 451-Lu), or NRAS alone (YUFIC), and one cell line lacked mutation in any of these four oncogenes (YUROB). We found that PAK activity was markedly elevated in all cell lines with either PREX2 or RAC1 mutations (Fig. 3A), consistent with the idea that the PREX2 and RAC1 proteins are linked in a signaling pathway that engages PAK.
Table 1.
Human melanoma cell lines and their genetic profiles.
| RAC1 | PREX2 | RAS | BRAF | Source | |
|---|---|---|---|---|---|
| YUHEF | mutant | WT | WT | WT | Halaban |
| WM1960 | mutant | WT | mutant | WT | Herlyn |
| WM1791C | mutant | WT | mutant* | WT | Herlyn |
| YURIF | mutant | WT | WT | mutant | Halaban |
| WM3619 | WT | mutant | mutant | WT | Herlyn |
| WM3734 | WT | mutant | WT | mutant | Herlyn |
| YUFIC | WT | WT | WT | mutant | Halaban |
| 501mel | WT | WT | WT | mutant | ATCC |
| 451-Lu | WT | WT | WT | mutant | Herlyn |
| YUROB | WT | WT | WT | WT | Halaban |
KRASG12D mutation. All others are RAS mutants are NRASQ61K or NRASQ61L
Figure 3. Effects of targeted inhibitors on proliferation of BRAF, NRAS, and RAC1-mutant melanoma cell lines.
A) Western blots for activated PAK in the indicated cell lines. B) Cells were grown under standard conditions or treated with C) the MEK inhibitor PD325901 (100 nM), D) the PAK inhibitor Frax-1036 (100 nM), or E) the BRAF inhibitor vemurafenib (100 nM). Cell number was measured using an XCELLigence device.
We asked if inhibitors of MEK, PAK, or BRAF would differentially affect the proliferation of these cells depending on their genotypes. All eight of the cell lines tested had similar basal rates of proliferation (Fig. 3B). When treated with a MEK inhibitor, all cell lines showed a marked reduction in proliferation (Fig. 3C). Treatment with the Group A PAK inhibitor Frax-1036 had little effect on WT, NRAS, or BRAF mutant cells, but nearly abolished growth of cell lines bearing RAC1 or RAC1 plus NRAS mutations (Fig. 3D). Interestingly, the cell line with mutations in RAC1 and BRAF (YURIF), had an intermediate response to the PAK inhibitor. This pattern of response was completely reversed when the BRAF inhibitor vemurafenib was used. In this case, the NRAS and the RAC1 mutant cells had little response, whereas the BRAF mutant cells were severely impacted by vemurafenib (Fig. 3E). The YURIF cell line, with mutations in both RAC1 and BRAF, again showed an intermediate response.
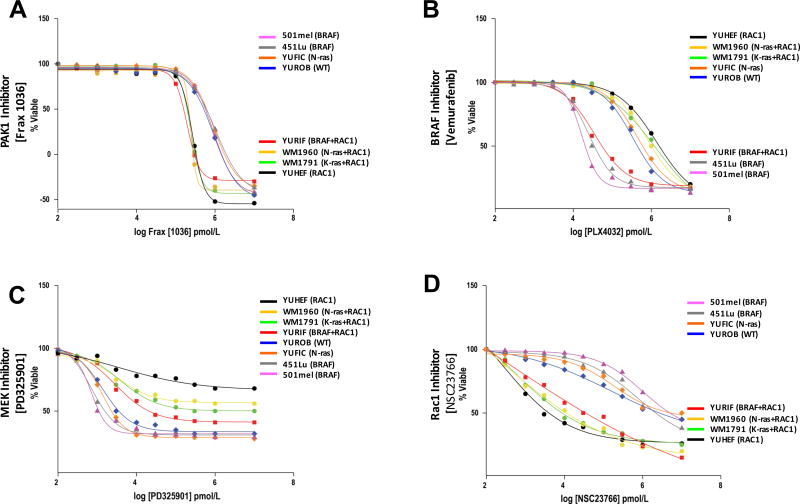
We obtained similar results when measuring cell viability. As with proliferation, treatment with Frax-1036 was effective only in cells bearing RAC1 mutations (EC50 values ~150 – 250 nM in RAC1-mutant cells, vs. ~1.2 µM in non-RAC1 mutant cells) (Fig. 4A, Supplemental Fig. S1A), whereas the opposite pattern was seen in cells treated with vemurafenib, which was effective only for BRAF-mutant cells (Fig. 4B, Supplemental Fig. S1B). All cells except WT showed reduced viability when treated with the MEK inhibitor PD325901 (Fig. 4C, Supplemental Fig. S1C). We also tested NSC23766, a small molecule inhibitor of RAC7 and found that it differentially decreased the viability of all cells bearing the RAC1P29S mutation (Fig. 4D, Supplemental Fig. S1D).
Figure 4. Effects of targeted inhibitors on viability of BRAF, NRAS, and RAC1-mutant melanoma cell lines.
Cells were grown under standard conditions and treated with either A) PAK inhibitor Frax-1036 (100 nM), B) the BRAF inhibitor vemurafenib (100 nM), C) the MEK inhibitor PD325901 (100 nM), or D) the RAC inhibitor NSC23766 (1 µM). Cell viability was determined by a redox indicator (Alamar Blue).
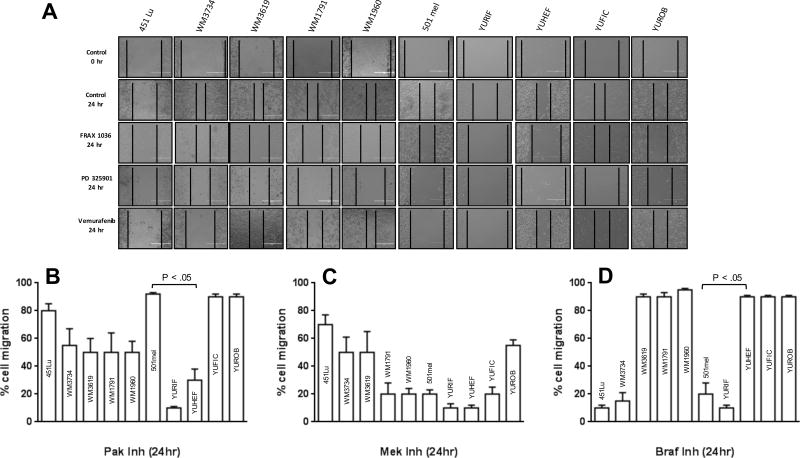
As RAC activation is strongly associated with enhanced cell motility, we next tested the effects of these small molecule inhibitors on this process. Using a wound-healing model, we found that YUHEF (RAC1 mutant) and YURIF (RAC1 plus BRAF mutation) cells were exquisitely sensitive to the PAK inhibitor Frax-1036. Other cell lines bearing RAC1 or PREX2 mutations, including WM1791C, WM1960, WM3619, and WM3734, showed intermediate effects, while the motility of the “pure” BRAF (501mel and 451-Lu), NRAS (YUFIC), or WT melanoma cells were not inhibited (Fig. 5A and B). The MEK inhibitor had a more uniformly inhibitory effect across the ten cell lines, though 451-Lu and WT cells were only about 25% and 50% inhibited, respectively. Treatment with the BRAF inhibitor was effective in all BRAF mutant cell lines, including the RAC1/BRAF double mutant line YURIF, but was completely ineffective in all other cell lines tested.
Figure 5. Effects of inhibitors on cell migration.
Cell Culture Wound Closure Assay was developed in 6-well confluent plates. After the scratch the different cell lines were treated with 100 nM BRAF inhibitor (vemurafenib), Pak1 inhibitor (Frax-1036), or MEK inhibitor (PD325901). Snapshot images in an inverted microscope were taken after 24h. Migration was quantified by measuring the size of the cell-free area. % migration for each cell line was measured against control (untreated cells), with the latter defined as 100% migration for each cell line. Where significant, p values are shown comparing responses of a RAC1-mutant cell line (YUHEF) to a BRAF-mutant cell line (501mel).
Consequences of small molecule inhibitors on melanoma cell signaling
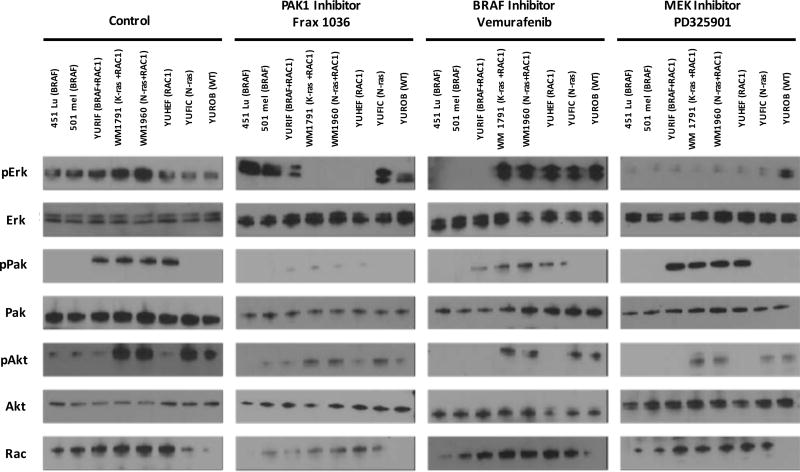
To determine the effects of PAK, MEK, and RAF inhibitors on signaling in the melanoma cell lines, we measured the activity of PAK, ERK, and AKT in untreated and inhibitor-treated cells. Under basal conditions, all four RAC1-mutant melanoma cell lines showed strong PAK activity, as determined by WB with anti-phospho-PAK antibodies (Fig. 6). PAK activity was nearly abolished by Frax-1036, and partly inhibited by vemurafenib, but not at all by PD325901. ERK activity was suppressed by Frax-1036 in all RAC1-mutant cells, and suppressed by vemurafenib in all BRAF-mutant cells. YURIF cells, which are doubly mutant for RAC1 and BRAF, showed ERK inhibition when treated with either Frax-1036 or vemurafenib. All cells showed ERK inhibition in when treated with PD325901. AKT was variably activated among the mutant cell lines, as well as WT YUROB cells. Interestingly, this activation was suppressed by all three types of inhibitors, suggesting that AKT is activated downstream of ERK in these melanoma cells.
Figure 6. Consequences of small molecule inhibitors on melanoma cell signaling.
Cells were grown under standard conditions or treated with vehicle (control) or 100 nM of the indicated inhibitors for 24h. Lysates were analyzed by Western blot for PAK, ERK, and AKT activity.
Effects of PAK1 or BRAF pharmaceutical inhibition on melanoma xenograft tumor growth
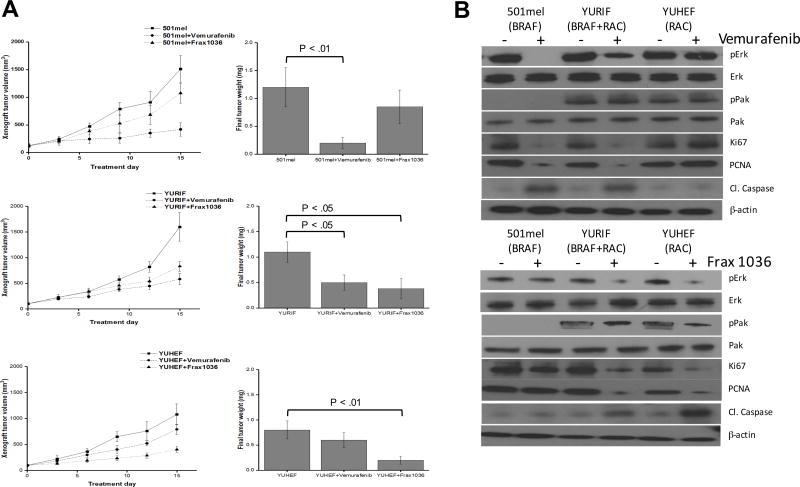
We chose three cell lines for in vivo xenograft experiments: 501mel (BRAFV600E), YURIF (BRAFV600E plus RAC1P29S), and YUHEF (RAC1P29S). These cells were placed in subcutaneous xenografts in nude mice and therapy was initiated after establishment of tumor (average 25 mm3). Tumor-bearing mice were treated with vehicle, Frax-1036 (30 mg/kg/day), or vemurafenib (30 mg/kg/day) for a period of 15 days (Fig. 7A). Treatment with Frax-1036 slightly attenuated the growth of 501mel xenografts (~1100 mm3 versus ~1500 mm3 in control group at study termination, p < 0.05), while tumors in mice receiving vemurafenib were significantly smaller (~400 mm3, p < 0.01). In YURIF cells, both Frax-1036 and vemurafenib had a modest effect, reducing tumor volume by about 50%. YUHEF xenograft growth was markedly slowed by Frax-1036 (~400 mm3 versus ~1100 mm3, p < 0.01) and less so by vemurafenib (~790 mm3 versus ~1100 mm3 p < 0.05). Reduction in tumor size was associated with loss of cell proliferation markers (PCNA and MCM2) and gain in apoptotic markers (cleaved caspase 3) (Fig. 7B).
Figure 7. Inhibition of xenograft growth by small molecule inhibitors.
501mel (BRAF), YURIF (BRAF+RAC1) and YUHEF (RAC1) cells were subcutaneously injected into the flanks of Nude mice (cohorts of ten mice/cell line). Ten days post-inoculation, when the tumors reached a volume of at least 25 mm3, the animals were treated by oral gavage with inhibitors for 2 weeks. A) Volumetric changes in tumor size between untreated mice (vehicle) and mice treated with inhibitor (vemurafenib or Frax-1036). B) Tumor weight was measured after mice were sacrificed. p<0.01 and p<0.05 values were determined by Student’s t-test. C) Immunblots for markers of proliferation (PCNA and MCM2) and apoptosis (cleaved caspase 3).
While it should be noted that these three cell lines are not isogenic and bear many genetic differences besides the status of BRAF and RAC1, these results are consistent with the differential sensitivities to targeted inhibitors observed in the zebrafish studies (Figs 1 and 2) and also in cell culture studies (Figs 3–6).
Discussion
To date, there are few studies of the molecular mechanisms that explain the contributions of RAC1P29S to melanoma. RAC1 mutations occur in 5–7% of sun-exposed skin areas and this mutation is most often found in combination with activating mutations in BRAF or NRAS, or inactivating mutation in NF1, suggesting an accessory role for this gene in melanomagenesis. In limited studies, the presence of the RAC1 mutation has been shown to leads to dependence on this oncogene, as shRNA-mediated knockdown of RAC1P29S slows proliferation in such cells.9 At the molecular level, it has been shown that the mutation at P29 confers an activated signaling state due to fast exchange of GDP for GTP, leading to increased effector engagement and activation4. Limited in vitro studies have shown that several human melanoma cell lines bearing this mutation are resistant to commonly used signaling agents such as BRAF inhibitors and MEK inhibitors,16, 30 but exceptions to this behavior have also been found, suggesting that there is not a simple relationship between RAC1 mutational status and drug sensitivity.9 In addition, Vu et al. reported that RAC1 mutant melanoma cells express high levels of PD-L1, suggesting an ability to evade immune surveillance29. However, no comprehensive evaluation of RAC1P29S induced signaling or response to inhibitors has been published to date, nor have any preclinical models been described.
In this work, we show that expression of activated RAC1 confers Rasopathy-like effects on zebrafish development, characterized by marked body axis elongation during the first 12h of development, accompanied by elevated ERK activity. In these embryos, blocking PAK activation with either of two small molecule inhibitors prevented abnormal development driven by RAC1 and also prevented ERK activation. While both of the PAK inhibitors tested have off-target effects, these are largely non-overlapping, indicating that the observed cellular and signaing effects are due to inhibition of the catalytic function of group A PAKs.27 Similar beneficial effects were seen using a MEK inhibitor, consistent with the idea that a RAC1/PAK/MEK/ERK signaling module is primarily responsible for the developmental phenotype in these animals. These results are in contrast to the more limited role of Group A PAKs in RAC1-driven melanoblast migration during mouse embryogenesis, in which other RAC effectors appear to play a primary role17.
The RAC1 protein has at least two direct effectors that are attractive candidates for drug therapy. The first is phosphoinositol-3 kinase (PI3K) β, which, of the four PI3K isoforms, is uniquely linked to RAC signaling6. RAC1, but not RAS, engages PI3Kβ to drive chemotaxis, and genetically engineered mice bearing mutations in the RBD of PI3Kβ are resistant to bleomycin-induced lung fibrosis6. As specific small molecule inhibitors of PI3Kβ have been described, it would be reasonable to ask if blocking this pathway impedes RAC1P29S signaling. The Group A PAKs are also plausible targets, as several studies have established these kinases as important for RAC1 signaling.25 Other RAC1 effector pathways, such as those that regulate actin reorganization, are also possibly relevant, especially given the recent description of a melanomagenic GNAQ pathway acting through a TRIO/RHO/RAC/actin signaling cassette that converged on the oncogenic transcription factor YAP5.
While cell-based models can be useful for determining drug sensitivities and for deconstructing cancer signaling pathways, and our work indicates an important role for Group A PAKs in RAC1-mediated transformation, the establishment of animal models for RAC1P29S-mutant melanoma. Such models will also be useful for determining the linkage, if any, between signaling from PREX2 and RAC1. For example, previous studies have shown that Nras-mediated melanoma metastasis can be reduced by deletion of the Prex1 gene in mice.20 As PREX1 and PREX2 are both exchange factors for RAS, it is tempting to speculate that NRAS signals through activated PREX to RAC1. If this is the case, inhibitors of RAC1 effectors might have utility in the relatively common NRAS-mutant melanomas as well as in the rarer PREX2 and RAC1 mutant forms of this disease.
Materials and Methods
Reagents
Frax-1036 was generously provided by Genentech. Vemurafenib was purchased from Selleckchem and NSC23766 and PD325901were purchased from Sigma-Aldrich
Zebrafish Microinjection Experiments
Wild-type AB and transgenic zebrafish lines were maintained in the Zebrafish Core Facility of the Fox Chase Cancer Center under standard conditions.14 Tg(cmlc2:EGFP) fish, expressing GFP in cardiac tissues, were a generous gift from Rebecca Burdine.28 Embryo collection and maintenance was carried out as previously described.26 BRAF (WT or V600E), KRAS-4A (G12V), and RAC1 (P29S) cDNAs, respectively, were subcloned into the pSGH2 vector. Transcripts were made in vitro for antisense (HindIII and T3 RNA polymerase) or sense (SacII and SP6 RNA polymerase) full-length mRNA using the mMessage Machine kit (Ambion). Capped mRNA (5 nl) was injected using a nitrogen-powered Picospritzer III injector (Intracel) conjugated to a Nikon SMZ 1000 stereomicroscope at a final concentration of 35 ng/µl directly in the cytoplasm of one-cell-stage wild-type embryos, as described previously.18 To analyze the effects of the small molecule inhibitors, mRNA injected 4 hpf embryos were incubated in E3 medium containing Frax-1036, vemurafenib, PD325901 or NSC23766 at a final concentration of 1 µM for 1hr and then washed thoroughly. Control-treated embryos were incubated in E3 with DMSO at the same final concentration as the small molecule inhibitors.
For protein extraction, zebrafish embryos were collected at 4hpf and de-yolked as previously described.21 For the immunoblott we used 4 hpf embryo’s lysates. To obtain lysates we removed E3 buffer, kept them at −80°C and rybolysed for 1 minute in protein extraction buffer [2M Tris pH 7.5, 5M NaCl, 1% NP40, Na deoxycholate, 10% SDS, 0.5M NaF, 1M β-glycosyl phosphate, protease inhibitor cocktail tablet (Roche)]. The protein content was measured by Bradford assay and the samples were normalized to protein content. Total protein extracts were probed with anti-p-PAK, -p-ERK, and -β-actin (1:1000) (Cell Signaling). Secondary antibodies conjugated to horseradish peroxidase were used to detect the proteins (1:10,000).
For analysis zebrafish morphology, dechorionated embryos at specified stages were placed on a glass depression slide in 1% methylcellose to stabilize embryo. Morphology was assessed visually using a light transmission Nikon SMZ 1500, and representative images recorded using a Nikon digital sight DS Fi1 camera.
Cell Lines
Melanoma cell lines were generously provided by Ruth Halaban (Yale University) and Meenhard Herlyn (Wistar Institute). YUHEF, YURIF, YUFIC, YUROB and 501mel cells were maintained in OptiMEM media (Invitrogen, Carlsbad, CA, USA) supplemented with 5% FBS and and penicillin/streptomycin. 451-Lu, WM3734, WM3619, WM1791 and WM1960 cells were maintained in 80% MCDB153, 20% Leibovitz’s L-15, supplemented with 2% FBS, 5 µg/ml insulin, and 1.68 mM CaCl2. All cells were cultured at 37°C in 5% CO2. Cells were routinely tested for mycoplasma. Cell line authentication was performed by sequencing the BRAF, PREX2, and RAC1 genes. Experiments with these cell lines were done within six months of their acquisition and were passaged no more than twelve times post thaw.
Proliferation and Survival Assays
Cell proliferation was assessed using E-16-well plates and xCELLigence technology (Acea Bioscience, San Diego, CA, USA, distributed by Roche).19 Cell growth was monitored for 72 h. Microelectrodes, placed on the bottom of plates, were used to detect impedance changes proportional to the number of adherent cells and expressed as the cell index. The impedance value of each well was automatically monitored by the xCELLigence system and expressed as a cell index value. The experiments were conducted in triplicate and repeated twice.
For viability assays, melanoma cell lines were plated in 96-well plates at 5000 cells/well in complete medium. 24 hours after plating, varied doses of inhibitors were added in triplicate. 0.1% DMSO was used as negative control. Cell viability was evaluated after 72-hour incubation with drugs using Alamar Blue fluorescent assay (Life Technologies).
Immunoblotting
Western blot assays were performed using standard techniques. Primary antibodies used in this study were: anti-phospho-PAK1 (pSer144) (#2606), -total PAK1 (#2602), -phospho-MEK1/2 (pSer217/221) (#9121), -total MEK1/2 (#9122), -phospho-ERK1/2 (pThr202/pTyr204) (#9101), -total ERK1/2 (#9102), -GPDH (#4138), and -β-actin (#13E5) from Cell Signaling Technology, and anti-RAC1 from Millipore (#07-1464).
Wound healing assay
Confluent monolayers of melanoma cells were manually scraped with a 200-µL pipette tip. The cells were washed once with growth media, and then grown in fresh growth media for 24h. Images were acquired at 100× magnification using an EVOS fluorescence microscope and analyzed by the number of cells that cross into the wound area from their reference point at time zero.
Xenografts
Female 6–7 week old nu/nu mice were injected subcutaneously into the flank with 106 melanoma cells in 0.1 ml 30% Matrigel (BD Biosciences)/PBS. Upon identification of a palpable tumor (minimal volume of 25 mm3), mice were randomly divided into 3 groups (10 mice in each group). Frax-1036 was formulated in 20% 2-hydroxypropyl-β-cyclodextrin in 50 mM citrate buffer (pH 3.0) and administrated by oral gavage at 30 mg/kg/day. Vemurafenib was dissolved in 4% DMSO, 30% PEG 300 and 5% Tween 80, followed by PBS and then administrated by oral gavage at 30 mg/kg/day. Mice were sacrificed at day 15 of treatment. Tumors were resected, individual portions of tumors were snap-frozen in liquid nitrogen for preparation of protein lysates, and fixed in formalin and paraffin embedded for immunohistochemical studies.
All animal procedures were performed in accordance with IACUC guides and regulations.
Statistics
Statistical analysis of all results was carried out using the paired Student’s t-test. All values reflect the mean±S.E.M, with a significance cutoff of P<0.05. All statistical analyses were completed in GraphPad Prism 6.0 or 7.0 (La Jolla, CA, USA).
Supplementary Material
Acknowledgments
We thank Drs. Ruth Halaban and Meenhard Herlyn for providing melanoma cell lines, and Dr. Rebecca Burdine for Tg(cmlc2:EGFP) zebrafish, Genentech for providing Frax-1036, and the Fox Chase Cancer Center Animal Facility for assistance with zebrafish experiments. This work was supported by NIH CORE Grant P30 CA006927 and an appropriation from the state of Pennsylvania to the Fox Chase Cancer Center.
Footnotes
Disclosure of Potential Conflicts of Interest
No potential conflicts of interest were disclosed.
Supplementary Information accompanies the paper on the Oncogene website (http://www.nature.com/onc).
References
- 1.Anastasaki C, Estep AL, Marais R, Rauen KA, Patton EE. Kinase-activating and kinase-impaired cardio-facio-cutaneous syndrome alleles have activity during zebrafish development and are sensitive to small molecule inhibitors. Hum Mol Genet. 2009;18:2543–2554. doi: 10.1093/hmg/ddp186. [DOI] [PMC free article] [PubMed] [Google Scholar]
- 2.Anastasaki C, Rauen KA, Patton EE. Continual low-level MEK inhibition ameliorates cardio-facio-cutaneous phenotypes in zebrafish. Dis Model Mech. 2012;5:546–552. doi: 10.1242/dmm.008672. [DOI] [PMC free article] [PubMed] [Google Scholar]
- 3.Chow HY, Jubb AM, Koch JN, Jaffer ZM, Stepanova D, Campbell DA, et al. p21-Activated kinase 1 is required for efficient tumor formation and progression in a Ras-mediated skin cancer model. Cancer Res. 2012;72:5966–5975. doi: 10.1158/0008-5472.CAN-12-2246. [DOI] [PMC free article] [PubMed] [Google Scholar]
- 4.Davis MJ, Ha BH, Holman EC, Halaban R, Schlessinger J, Boggon TJ. RAC1P29S is a spontaneously activating cancer-associated GTPase. Proc Natl Acad Sci U S A. 2013;110:912–917. doi: 10.1073/pnas.1220895110. [DOI] [PMC free article] [PubMed] [Google Scholar]
- 5.Feng X, Degese MS, Iglesias-Bartolome R, Vaque JP, Molinolo AA, Rodrigues M, et al. Hippo-independent activation of YAP by the GNAQ uveal melanoma oncogene through a trio-regulated rho GTPase signaling circuitry. Cancer Cell. 2014;25:831–845. doi: 10.1016/j.ccr.2014.04.016. [DOI] [PMC free article] [PubMed] [Google Scholar]
- 6.Fritsch R, de Krijger I, Fritsch K, George R, Reason B, Kumar MS, et al. RAS and RHO families of GTPases directly regulate distinct phosphoinositide 3-kinase isoforms. Cell. 2013;153:1050–1063. doi: 10.1016/j.cell.2013.04.031. [DOI] [PMC free article] [PubMed] [Google Scholar]
- 7.Gao Y, Dickerson JB, Guo F, Zheng J, Zheng Y. Rational design and characterization of a Rac GTPase-specific small molecule inhibitor. Proc Natl Acad Sci U S A. 2004;101:7618–7623. doi: 10.1073/pnas.0307512101. [DOI] [PMC free article] [PubMed] [Google Scholar]
- 8.Grzmil M, Whiting D, Maule J, Anastasaki C, Amatruda JF, Kelsh RN, et al. The INT6 cancer gene and MEK signaling pathways converge during zebrafish development. PLoS One. 2007;2:e959. doi: 10.1371/journal.pone.0000959. [DOI] [PMC free article] [PubMed] [Google Scholar]
- 9.Halaban R. RAC1 and melanoma. Clinical therapeutics. 2015;37:682–685. doi: 10.1016/j.clinthera.2014.10.027. [DOI] [PMC free article] [PubMed] [Google Scholar]
- 10.Halaban R, Krauthammer M. RASopathy Gene Mutations in Melanoma. The Journal of investigative dermatology. 2016;136:1755–1759. doi: 10.1016/j.jid.2016.05.095. [DOI] [PMC free article] [PubMed] [Google Scholar]
- 11.Hodis E, Watson IR, Kryukov GV, Arold ST, Imielinski M, Theurillat JP, et al. A landscape of driver mutations in melanoma. Cell. 2012;150:251–263. doi: 10.1016/j.cell.2012.06.024. [DOI] [PMC free article] [PubMed] [Google Scholar]
- 12.Jindal GA, Goyal Y, Burdine RD, Rauen KA, Shvartsman SY. RASopathies: unraveling mechanisms with animal models. Dis Model Mech. 2015;8:769–782. doi: 10.1242/dmm.020339. [DOI] [PMC free article] [PubMed] [Google Scholar]
- 13.Kawazu M, Ueno T, Kontani K, Ogita Y, Ando M, Fukumura K, et al. Transforming mutations of RAC guanosine triphosphatases in human cancers. Proc Natl Acad Sci U S A. 2013;110:3029–3034. doi: 10.1073/pnas.1216141110. [DOI] [PMC free article] [PubMed] [Google Scholar]
- 14.Kimmel CB, Ballard WW, Kimmel SR, Ullmann B, Schilling TF. Stages of embryonic development of the zebrafish. Dev Dyn. 1995;203:253–310. doi: 10.1002/aja.1002030302. [DOI] [PubMed] [Google Scholar]
- 15.Krauthammer M, Kong Y, Ha BH, Evans P, Bacchiocchi A, McCusker JP, et al. Exome sequencing identifies recurrent somatic RAC1 mutations in melanoma. Nature genetics. 2012;44:1006–1014. doi: 10.1038/ng.2359. [DOI] [PMC free article] [PubMed] [Google Scholar]
- 16.Krauthammer M, Kong Y, Bacchiocchi A, Evans P, Pornputtapong N, Wu C, et al. Exome sequencing identifies recurrent mutations in NF1 and RASopathy genes in sun-exposed melanomas. Nature genetics. 2015;47:996–1002. doi: 10.1038/ng.3361. [DOI] [PMC free article] [PubMed] [Google Scholar]
- 17.Li A, Ma Y, Yu X, Mort RL, Lindsay CR, Stevenson D, et al. Rac1 drives melanoblast organization during mouse development by orchestrating pseudopod- driven motility and cell-cycle progression. Dev Cell. 2011;21:722–734. doi: 10.1016/j.devcel.2011.07.008. [DOI] [PMC free article] [PubMed] [Google Scholar]
- 18.Lightcap CM, Kari G, Arias-Romero LE, Chernoff J, Rodeck U, Williams JC. Interaction with LC8 is required for Pak1 nuclear import and is indispensable for zebrafish development. PLoS One. 2009;4:e6025. doi: 10.1371/journal.pone.0006025. [DOI] [PMC free article] [PubMed] [Google Scholar]
- 19.Limame R, Wouters A, Pauwels B, Fransen E, Peeters M, Lardon F, et al. Comparative analysis of dynamic cell viability, migration and invasion assessments by novel real-time technology and classic endpoint assays. PLoS One. 2012;7:e46536. doi: 10.1371/journal.pone.0046536. [DOI] [PMC free article] [PubMed] [Google Scholar]
- 20.Lindsay CR, Lawn S, Campbell AD, Faller WJ, Rambow F, Mort RL, et al. P-Rex1 is required for efficient melanoblast migration and melanoma metastasis. Nat Commun. 2011;2:555. doi: 10.1038/ncomms1560. [DOI] [PMC free article] [PubMed] [Google Scholar]
- 21.Link V, Shevchenko A, Heisenberg CP. Proteomics of early zebrafish embryos. BMC Dev Biol. 2006;6:1. doi: 10.1186/1471-213X-6-1. [DOI] [PMC free article] [PubMed] [Google Scholar]
- 22.Ong CC, Jubb AM, Jakubiak D, Zhou W, Rudolph J, Haverty PM, et al. P21-activated kinase 1 (PAK1) as a therapeutic target in BRAF wild-type melanoma. J Natl Cancer Inst. 2013;105:606–607. doi: 10.1093/jnci/djt054. [DOI] [PubMed] [Google Scholar]
- 23.Ong CC, Gierke S, Pitt C, Sagolla M, Cheng CK, Zhou W, et al. Small molecule inhibition of group I p21-activated kinases in breast cancer induces apoptosis and potentiates the activity of microtubule stabilizing agents. Breast Cancer Res. 2015;17:59. doi: 10.1186/s13058-015-0564-5. [DOI] [PMC free article] [PubMed] [Google Scholar]
- 24.Qiu R-G, Chen J, Kirn D, McCormick F, Symons M. An essential role for Rac in Ras transformation. Nature. 1995;374:457–459. doi: 10.1038/374457a0. [DOI] [PubMed] [Google Scholar]
- 25.Radu M, Semenova G, Kosoff R, Chernoff J. PAK signalling during the development and progression of cancer. Nature reviews Cancer. 2014;14:13–25. doi: 10.1038/nrc3645. [DOI] [PMC free article] [PubMed] [Google Scholar]
- 26.Rhodes J, Amsterdam A, Sanda T, Moreau LA, McKenna K, Heinrichs S, et al. Emi1 maintains genomic integrity during zebrafish embryogenesis and cooperates with p53 in tumor suppression. Mol Cell Biol. 2009;29:5911–5922. doi: 10.1128/MCB.00558-09. [DOI] [PMC free article] [PubMed] [Google Scholar]
- 27.Semenova G, Chernoff J. Targeting PAK1. Biochem Soc Trans. 2017;45:79–88. doi: 10.1042/BST20160134. [DOI] [PMC free article] [PubMed] [Google Scholar]
- 28.Shin JT, Priest JR, Ovcharenko I, Ronco A, Moore RK, Burns CG, et al. Human-zebrafish non-coding conserved elements act in vivo to regulate transcription. Nucleic Acids Res. 2005;33:5437–5445. doi: 10.1093/nar/gki853. [DOI] [PMC free article] [PubMed] [Google Scholar]
- 29.Vu HL, Rosenbaum S, Purwin TJ, Davies MA, Aplin AE. RAC1 P29S regulates PD-L1 expression in melanoma. Pigment cell & melanoma research. 2015;28:590–598. doi: 10.1111/pcmr.12392. [DOI] [PMC free article] [PubMed] [Google Scholar]
- 30.Watson IR, Li L, Cabeceiras PK, Mahdavi M, Gutschner T, Genovese G, et al. The RAC1 P29S hotspot mutation in melanoma confers resistance to pharmacological inhibition of RAF. Cancer Res. 2014;74:4845–4852. doi: 10.1158/0008-5472.CAN-14-1232-T. [DOI] [PMC free article] [PubMed] [Google Scholar]
Associated Data
This section collects any data citations, data availability statements, or supplementary materials included in this article.


