Abstract
Both microbial and host genetic factors contribute to the pathogenesis of autoimmune disease1–4. Accumulating evidence suggests that microbial species that potentiate chronic inflammation, as in inflammatory bowel disease (IBD), often also colonize healthy individuals. These microbes, including the Helicobacter species, have the propensity to induce pathogenic T cells and are collectively referred to as pathobionts4–6. However, an understanding of how such T cells are constrained in healthy individuals is lacking. Here we report that host tolerance to a potentially pathogenic bacterium, Helicobacter hepaticus (H. hepaticus), is mediated by induction of RORγt+Foxp3+ regulatory T cells (iTreg) that selectively restrain pro-inflammatory TH17 cells and whose function is dependent on the transcription factor c-Maf. Whereas H. hepaticus colonization of wild-type mice promoted differentiation of RORγt-expressing microbe-specific iTreg in the large intestine, in disease-susceptible IL-10-deficient animals there was instead expansion of colitogenic TH17 cells. Inactivation of c-Maf in the Treg compartment likewise impaired differentiation and function, including IL-10 production, of bacteria-specific iTreg, resulting in accumulation of H. hepaticus-specific inflammatory TH17 cells and spontaneous colitis. In contrast, RORγt inactivation in Treg only had a minor effect on bacterial-specific Treg-TH17 balance, and did not result in inflammation. Our results suggest that pathobiont-dependent IBD is driven by microbiota-reactive T cells that have escaped this c-Maf-dependent mechanism of iTreg-TH17 homeostasis.
Main Text
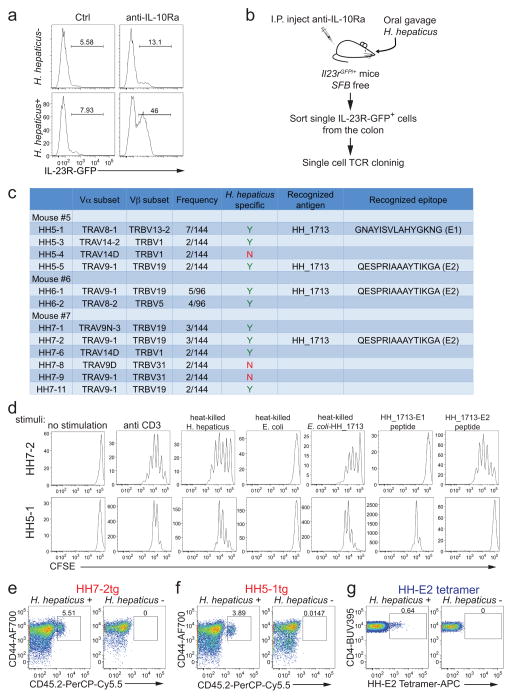
We chose Helicobacter hepaticus (H. hepaticus) as a model to investigate host-pathobiont interplay. IL-10RA blockade induced inflammation of the large intestine (LI) in H. hepaticus-colonized Il23rGFP reporter mice5,6, increasing GFP+ cells (predominantly TH17) from ~10% to ~50% of LI CD4+ T cells (Extended Data Fig. 1a). Therefore we wished to determine why H. hepaticus-induced T cells do not cause disease in wild-type (WT) animals at steady state. To tackle this question, we first identified the T cell receptor (TCR) sequences and cognate epitopes of H. hepaticus-induced TH17 cells that expand during inflammation, and subsequently traced the fate of these cells at steady state.
We cloned individual T cell receptor (TCR) sequences from colitogenic IL-23R-GFP+ T cells (Extended Data Fig. 1b) and found that nine out of twelve clonotypic TCRs were H. hepaticus-specific (Extended Data Fig. 1c). We subsequently identified7,8 a H. hepaticus-unique protein, HH_1713 containing two immunodominant epitopes. The E1 peptide epitope, presented by I-Ab, was recognized by H. hepaticus-specific TCR HH5-1, whereas E2 was recognized by TCR HH5-5, HH6-1 and HH7-2 (Extended Data Fig. 1c). We next developed two complementary approaches to track H. hepaticus-specific T cells in vivo9,10, HH7-2 and HH5-1 TCR transgenic mice (HH7-2tg and HH5-1tg) and a MHCII-tetramer loaded with E2 peptide (HH-E2 tetramer) (Extended Data Fig. 1d–g).
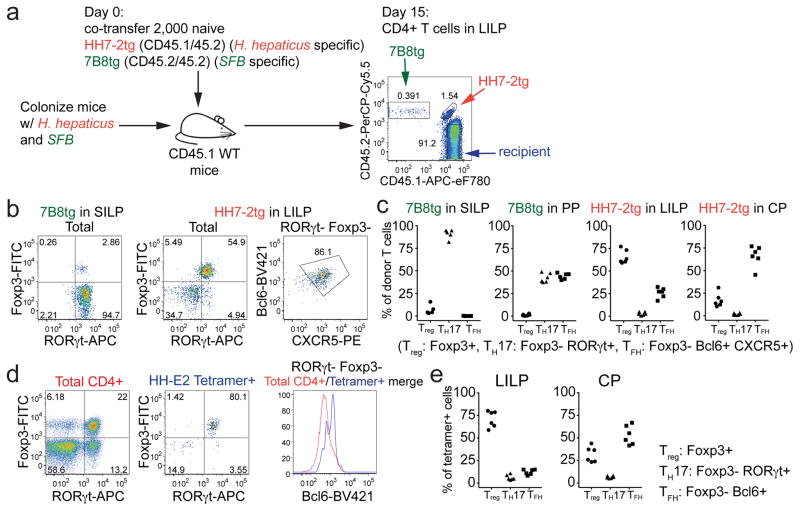
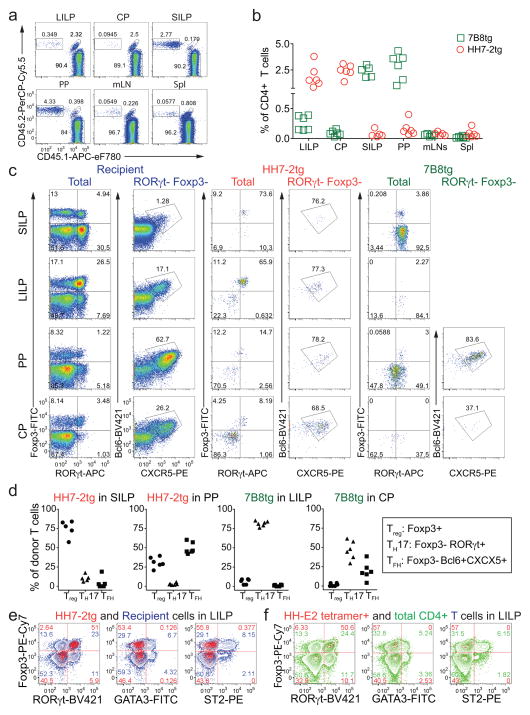
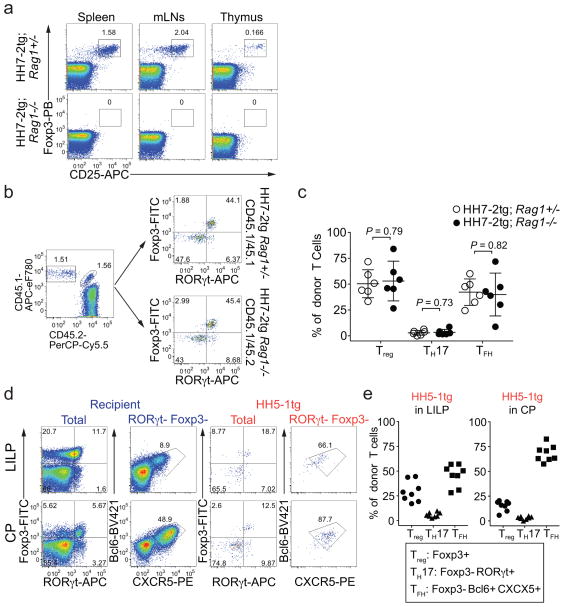
To track what happens to H. hepaticus-specific T cells in healthy animals, we simultaneously transferred naïve HH7-2tg and 7B8tg (segmented filamentous bacteria (SFB)-specific TCRtg control)8 T cells into WT mice that were stably colonized with H. hepaticus and SFB (Fig. 1a). Two weeks post adoptive transfer, HH7-2tg donor cells were enriched in the large intestinal lamina propria (LILP) and cecal patch (CP), whereas 7B8tg cells predominated in the small intestinal lamina propria (SILP) and Peyer’s patches (PPs) (Extended Data Fig. 2a, b), consistent with colonization of H. hepaticus in the LI and SFB in the SI. As previously reported, 7B8 cells developed into TH17 cells that were largely positive for RORγt and negative for Foxp38 (Fig. 1b, c, Extended Data Fig. 2c, d). By contrast, HH7-2tg cells in the LILP were mostly iTreg expressing both RORγt and Foxp3 (~60% of total donor-derived HH7-2tg cells)11,12, rather than TH17 cells (<10% of total HH7-2tg cells) (Fig. 1b, c, Extended Data Fig. 2c, d). Notably, two other colonic Treg markers, GATA3 and ST2, were not expressed on HH7-2tg cells (Extended Data Fig. 2e)13. 7B8tg and HH7-2tg T cells expressing neither RORγt nor Foxp3 were mostly T follicular helper (TFH) cells and were enriched in the PPs and CP (Fig. 1b, c, Extended Data Fig. 2c, d). Breeding HH7-2tg mice onto the Rag1−/− background excluded the possibility that HH7-2tg iTreg cells detected after adoptive transfer were contaminated by thymus-derived natural Treg (nTreg) or were influenced by the presence of dual TCRs (Extended Data Fig. 3a–c). Adoptively transferred HH5-1tg and HH-E2-tetramer positive cells had differentiation profiles similar to HH7-2tg cells (Fig. 1d, e and Extended Data Fig. 2f and 3d, e). These results indicate that the host responds to H. hepaticus by generating immunotolerant iTreg cells rather than pro-inflammatory TH17 cells.
Figure 1. H. hepaticus induces RORγt+ Treg and TFH responses under steady state.
a, Experimental scheme for co-transfer of congenic isotype-labeled HH7-2tg and 7B8tg cells into wild type (WT) mice colonized with H. hepaticus and SFB. b, c, RORγt, Foxp3, Bcl-6 and CXCR5 expression (b) and frequencies of Treg (Foxp3+), TH17 (Foxp3−RORγt+) and TFH (Bcl6+CXCR5+) (c) among donor-derived T cells in indicated tissues. Data are from one of 3 experiments, with n=15 in the 3 experiments. d, e, WT mice (n=6) were colonized with H. hepaticus for 3–4 weeks and analyzed for RORγt, Foxp3 and Bcl6 expression in total CD4+ (red) and HH-E2 tetramer+ (blue) T cells from the LILP (d) and frequencies of Treg (Foxp3+), TH17 (Foxp3−RORγt+) and TFH (Bcl6+) among HH-E2 tetramer+ T cells in the LILP and CP (e). Data summarize two independent experiments. SILP: small intestinal lamina propria; LILP: large intestinal lamina propria; PP: Peyer’s patches and CP: cecal patch.
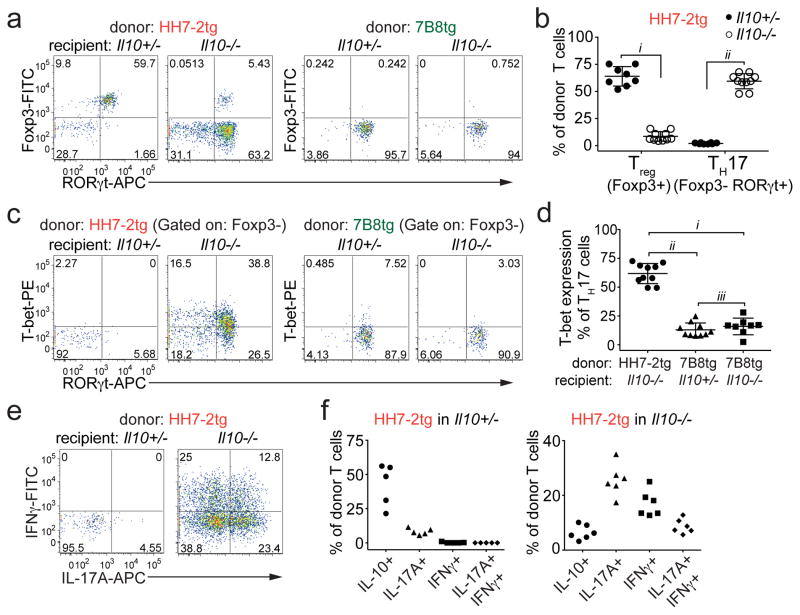
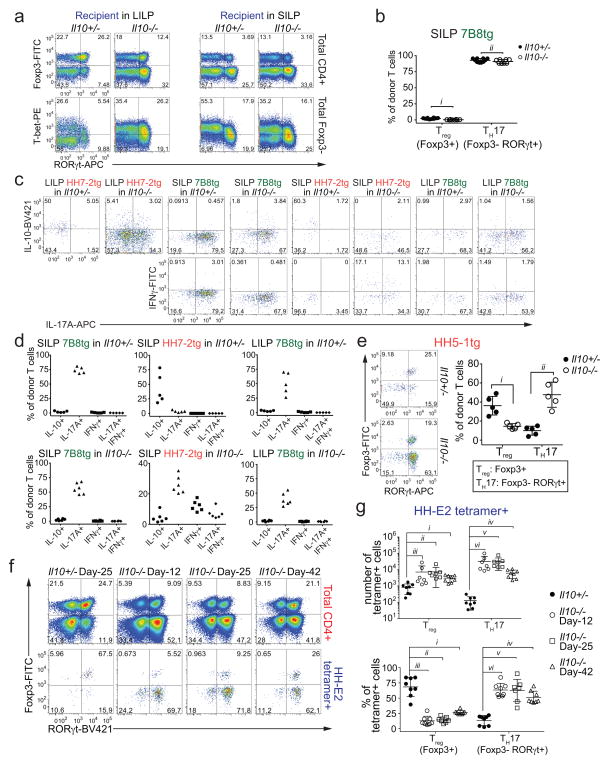
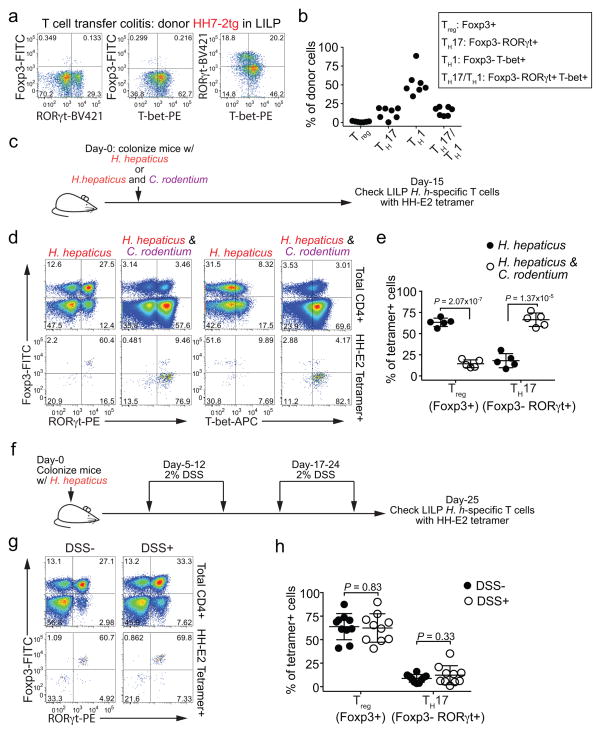
To examine if the iTreg-dominant differentiation of H. hepaticus-specific T cells is altered during intestinal inflammation, we co-transferred naïve HH7-2tg and control 7B8tg T cells into colonized Il10−/− recipients. Strikingly, only a small proportion of the transferred HH7-2tg T cells expressed Foxp3 in the LILP. Instead, most of them differentiated into pro-inflammatory TH17 cells with TH1-like features, characterized by expression of both RORγt and T-bet and high levels of IL-17A and IFNγ upon re-stimulation14 (Fig. 2a–f and Extended Data Fig. 4a, c, d). These results were recapitulated with adoptive transfer of HH5-1tg T cells and endogenous HH-E2 tetramer+ T cells (Extended Data Fig. 4e–g). By comparison, disruption of IL-10-mediated immune tolerance did not result in deviation of SFB-specific TH17 cells to the inflammatory TH17-TH1 phenotype (Fig. 2c, d and Extended Data Fig. 4a–d). Furthermore, we observed similar deviated T cell responses to H. hepaticus in models of T cell transfer colitis and Citrobacter rodentium (C. rodentium)-induced colonic inflammation, but not in DSS colitis, an innate immunity-dependent model (Extended Data Fig. 5a–h). Commensal microbe-specific T cells can thus acquire pro-inflammatory phenotypes during enteric infection15, although the high frequency of such infections suggests the existence of a mechanism to re-establish gut tolerance. Our observations of H. hepaticus-specific iTreg-TH17 skewing during colitis are consistent with a contemporaneous study using two different Helicobacter species16. These findings indicate that dysregulated T cell tolerance to pathobionts may be a general hallmark of IBD.
Figure 2. H. hepaticus predominantly induces inflammatory TH17 cells in IL-10 deficiency-dependent colitis.
a–d, LILP HH7-2tg and SILP 7B8tg donor-derived cells in Il10+/− (n=8) and Il10−/− (n=10) mice were analyzed for Foxp3 and RORγt expression (a), frequencies of Treg (Foxp3+) and TH17 (Foxp3−RORγt+) (b), RORγt and T-bet co-expression (c), and frequencies of T-bet expression among TH17 (Foxp3−RORγt+) cells (d). Data are from four independent experiments. e, f, IL-17A and IFNγ expression (e) and frequencies of IL-10, IL-17A and IFNγ positive cells (f) among LILP HH7-2tg donor-derived cells in Il10+/− (n=5) and Il10−/− (n=6) mice after re-stimulation. Data summarize two independent experiments. All statistics were calculated by unpaired two-sided Welch’s t-test. Error bars: mean ± 1 SD. P values are as follows: b, i=9.48x10⁻¹² and ii=1.11x10⁻¹³. d, i=2.16x10⁻⁹, ii=1.22x10⁻¹⁰ and iii=0.36.
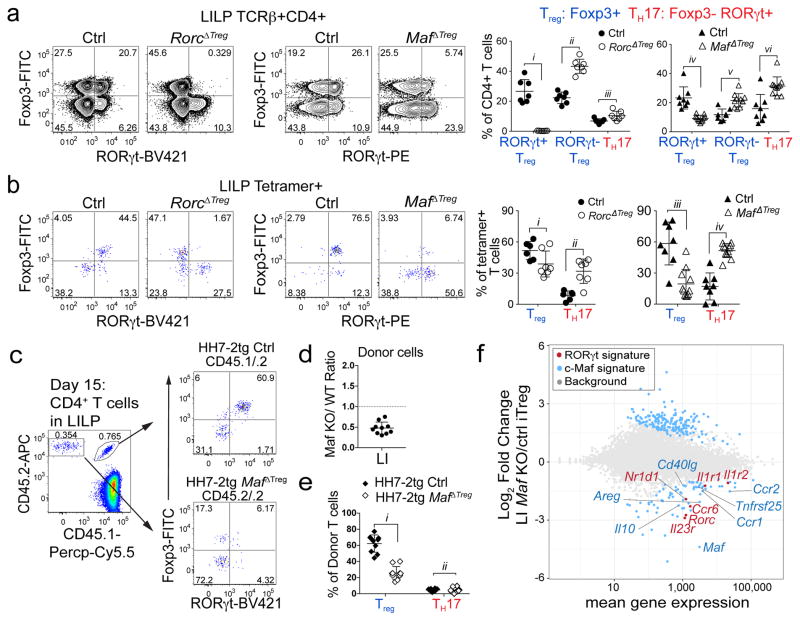
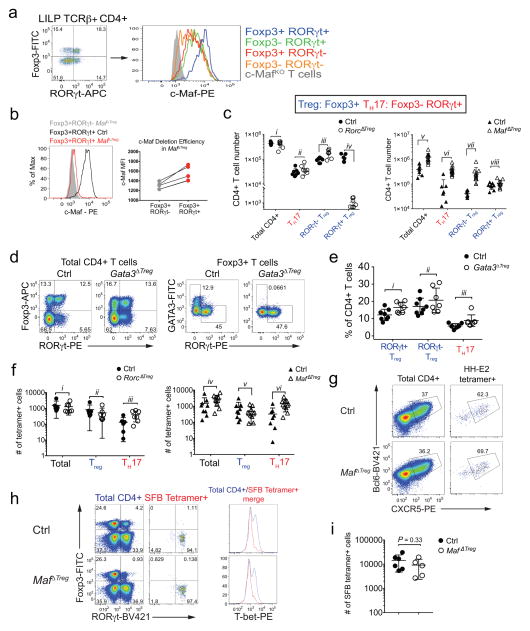
We next wished to determine if RORγt+ Treg cells are critical for immune tolerance to gut pathobionts. The transcription factor c-Maf attracted our attention as it was highly enriched in these cells11,17 (Extended Data Fig. 6a) and known to promote an anti-inflammatory program e.g. IL-10 expression in other T helper subsets18,19. We therefore deleted Maf with Foxp3cre to test its function in Treg. In H. hepaticus-colonized Maffl/fl;Foxp3cre (MafΔTreg) mice, despite incomplete depletion of c-Maf protein (Extended Data Fig. 6b), there was a marked decrease in the proportion of RORγt+ but not RORγt− Treg among CD4+ T cells in the LI, and a concomitant increase in TH17 frequency (Fig. 3a). MafΔTreg mice also had expanded numbers of total CD4+ T cells in the LI, reflected by a pronounced accumulation of TH17, but notably not RORγt+ Treg (Extended Data Fig. 6c). In contrast, after H. hepaticus-colonization, TH17 expansion was less striking in Rorcfl/fl;Foxp3cre (RorcΔTreg) mice (Fig. 3a, Extended Data Fig. 6c), and neither a decrease of RORγt+ Treg cells nor an expansion of TH17 cells was observed in Gata3fl/fl;Foxp3cre (Gata3ΔTreg) mice (Extended Data Fig. 6d, e). The altered frequency of RORγt+ Treg and TH17 subsets led us to test if the fate of H. hepaticus-specific T cells would be affected in the MafΔTreg and RorcΔTreg mice. Strikingly, HH-E2-tetramer+ cells were predominantly TH17 in MafΔTreg animals, but mostly RORγt+ Treg in control mice (Fig. 3b, Extended Data Fig. 6f). In contrast, although RorcΔTreg mice also had an increased proportion of H. hepaticus-specific TH17 cells, the majority of tetramer+ cells were Treg (Fig. 3b, Extended Data Fig. 6f). Collectively, these results suggest that pathobiont-specific RORγt+ iTreg cells are required for the suppression of inflammatory TH17 cell accumulation. While RORγt expression contributes to gut iTreg function, c-Maf plays a more substantial role in the differentiation and/or function of these cells. H. hepaticus-specific TFH differentiation in the CP did not appear to be affected in MafΔTreg animals (Extended Data Fig. 6g). Notably, as in IL-10-deficient mice, SFB-specific TH17 neither expanded nor adopted a TH1-like phenotype in MafΔTreg mice (Extended Data Fig. 6h, i). A potential explanation is that SFB- and H. hepaticus-specific TH17 responses are instructed by different innate immune pathways20,21.
Figure 3. c-Maf is required for the differentiation and function of induced Treg cells in the gut.
a, b, Transcription factor staining in total CD4+ (a) and HH-E2 tetramer+ (b) T cells from the LILP of indicated mice. Left panels: RORγt and Foxp3 expression. Right panels: frequencies of indicated Treg (Foxp3+) and TH17 (Foxp3−RORγt+) subsets. Mice were colonized with H. hepaticus for 5~6 weeks before analysis. Data summarize 3 independent experiments for RorcΔTreg (n=7) and littermate controls (n=7 for panel a and n=6 for b), and 4 independent experiments for MafΔTreg (n=10) and littermate controls (n=8). c–e, Co-transfer of MafΔTreg and control HH7-2tg T cells into WT H. hepaticus-colonized mice. c, Left: donor cell composition in the LILP of recipient mice. Right: RORγt and Foxp3 expression in indicated donor-derived cells. d, Ratios of MafΔTreg vs control HH7-2tg donor-derived cells in the LILP. Dashed line represents ratio of co-transferred cells prior to transfer. e, Frequencies of Treg (Foxp3+) and TH17 (Foxp3−RORγt+) cells among donor-derived cells. Data are a summary of 10 mice from 2 independent experiments. a, b, e, Statistics were calculated by unpaired two-sided Welch’s t-test. Error bars: mean ± 1 SD. P values are as follows: a, i=1.21x10⁻⁶, ii=8.82x10⁻⁷, iii=0.016, iv=6.38x10⁻⁴, v=8.06x10⁻⁴ and vi=9.89x10⁻⁷. b, i=0.056, ii=7.48x10⁻⁴, iii=7.64x10⁻⁷ and iv=6.01x10⁻⁶. e, i=6x10⁻¹⁴ and ii=0.86. f, MA plot depicting RNA-seq comparison of donor naïve T cell-derived MafΔTreg vs. control Foxp3-YFP+ iTreg cells (mean of 2 biologically independent experiments). Blue dots indicate 190 up-regulated and 75 down-regulated genes in c-Maf-dependent signature. Highlighted blue dots represent down-regulated genes related to Treg function and highlighted red dots indicate genes that are also dependent on RORγt11. Differentially expressed genes were calculated in DESeq2 using the Wald test with Benjamini-Hochberg correction to determine FDR (FDR<0.1 and Log2 fold change > 1.5).
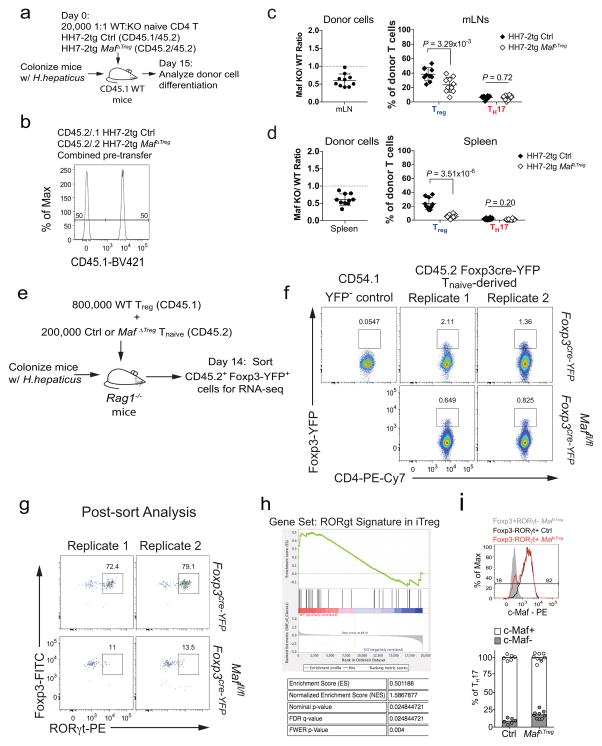
To investigate how c-Maf regulates the gut RORγt+ iTreg-TH17 axis, we co-transferred equal numbers of naïve Maf+/+;Foxp3cre (control) and Maffl/fl;Foxp3cre HH7-2tg cells into H. hepaticus-colonized WT animals (Extended Data Fig. 7a, b). Two weeks after adoptive transfer, the Maffl/fl;Foxp3cre HH7-2tg cells were markedly underrepresented compared to control cells in the LILP, mLNs and spleen, and were unable to form iTreg (Fig. 3c–e and Extended Data Fig. 7c,d). Importantly, at homeostasis, mutant donor-derived cells did not give rise to a high frequency of TH17 (Fig. 3e). Transcriptomics analysis revealed that the c-Maf-deficient iTreg cells were functionally impaired, as indicated by defective expression of Il10 and other Treg signature genes, as well as of RORγt-dependent genes11 (Fig. 3f, Extended Data Fig. 7e–h). Taken together, these findings show that c-Maf is a critical cell-intrinsic factor for both generation and function of microbe-specific iTreg. Notably, the vast majority of accumulated TH17 cells in MafΔTreg animals expressed c-Maf, indicating that the bulk of these cells did not arise from Treg in which c-Maf was deleted (Extended Data Fig. 7i). Thus, suppression of TH17 expansion is mediated by these iTreg cells in trans.
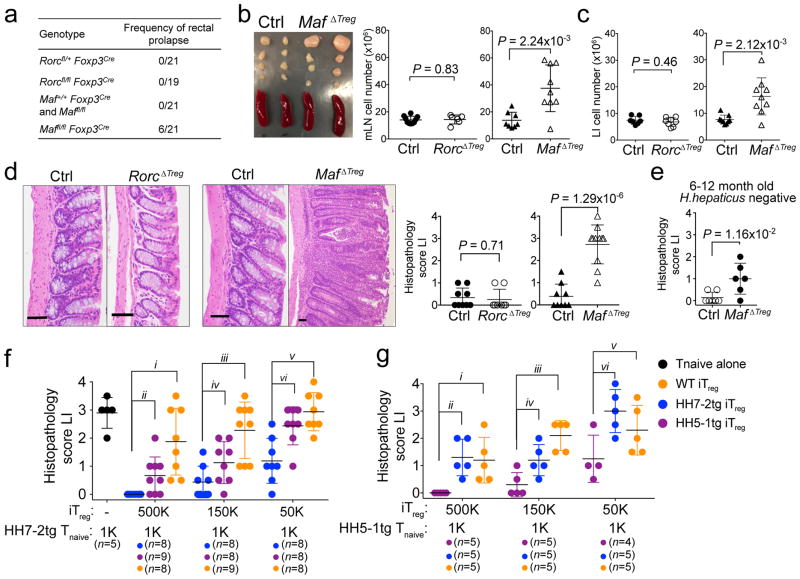
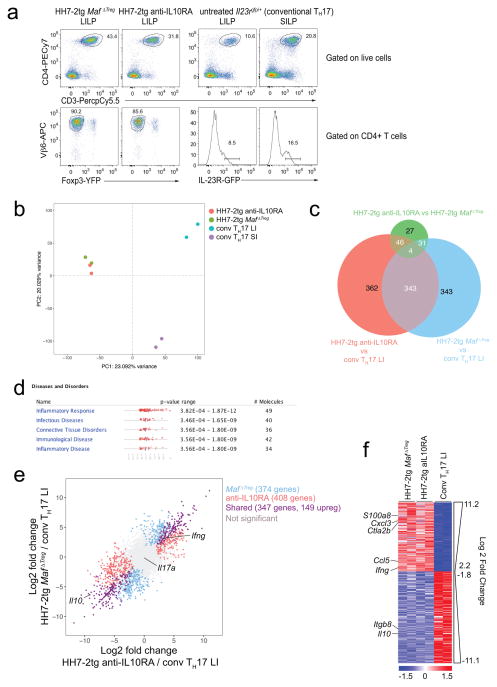
RORγt expression in iTreg cells has been implicated in the maintenance of gut immune homeostasis under different challenges11,12. However, spontaneous gut inflammation in RorcΔTreg animals has not been described. We noticed that MafΔTreg, but not RorcΔTreg or control littermates, were prone to rectal prolapse (Fig. 4a). MafΔTreg mice (8–12 weeks) colonized with H. hepaticus for five to six weeks had enlarged LI-draining mesenteric lymph nodes (mLN) and increased cellularity of mLNs and LI (Fig. 4b, c). Histopathological analysis of the LI of these animals revealed mixed acute and chronic inflammation (Fig. 4d). Without H. hepaticus colonization, aged (6–12 months) MafΔTreg mice also exhibited mild spontaneous colitis (Fig. 4e). Notably, none of the above changes was observed in RorcΔTreg mice (Fig. 4b–d). Thus, c-Maf but not RORγt expression in iTreg cells is critical for suppression of spontaneous inflammation. Indeed, the transcriptional profile of H. hepaticus-specific T effector (TEff) cells from MafΔTreg mice with spontaneous colitis was highly similar to that of pathogenic TH17 cells in IL-10RA blockade-induced colitis, but differed markedly from homeostatic TH17 cells (which are predominantly SFB-specific) (Extended Data Fig. 8a–f).
Figure 4. RORγt+ iTreg cells are required to maintain gut homeostasis.
a, Frequency of rectal prolapse by genotype. b, Spleens and mesenteric lymph nodes (mLNs) from MafΔTreg and littermate controls (left). Total cell numbers in mLNs (right). Data summarize 3 independent experiments for RorcΔTreg (n=6) and littermate controls (n=7), and 4 independent experiments for MafΔTreg (n=9) and littermate controls (n=8). c, Number of leukocytes in the LILP. Data summarize 3 independent experiments for RorcΔTreg (n=7) and littermate controls (n=8), and 4 independent experiments for MafΔTreg and littermate controls (n=9). d, Representative histology of LI sections (left) and colitis scores (right) of mice with indicated genotypes. RorcΔTreg (n=8) and littermate controls (n=9). MafΔTreg (n=11) and littermate controls (n=9). e, Colitis scores in aged H. hepaticus-negative MafΔTreg (n=6) and littermate control (n=7) mice. f, g, Suppression of H. hepaticus-specific TCRtg cell mediated transfer colitis by in vitro differentiated iTreg. Data summarize 2 independent experiments with indicated sample size (n) in total. Colitis scores for Rag1−/− mice that received the indicated TCRtg naïve T cells and iTreg combinations. All statistics were calculated by unpaired two-sided Welch’s t-test. Error bars: mean ± 1 SD. P values are indicated in the figure or as follows: f, i=5.34x10⁻⁴, ii=1.24x10⁻², iii=3.64x10⁻⁴, iv=0.056, v=3.26x10⁻⁴ and vi=4.54x10⁻³. g, i=0.013, ii=2.50x10⁻³, iii=4.59x10⁻⁴, iv=0.024, v=0.12 and vi=0.016.
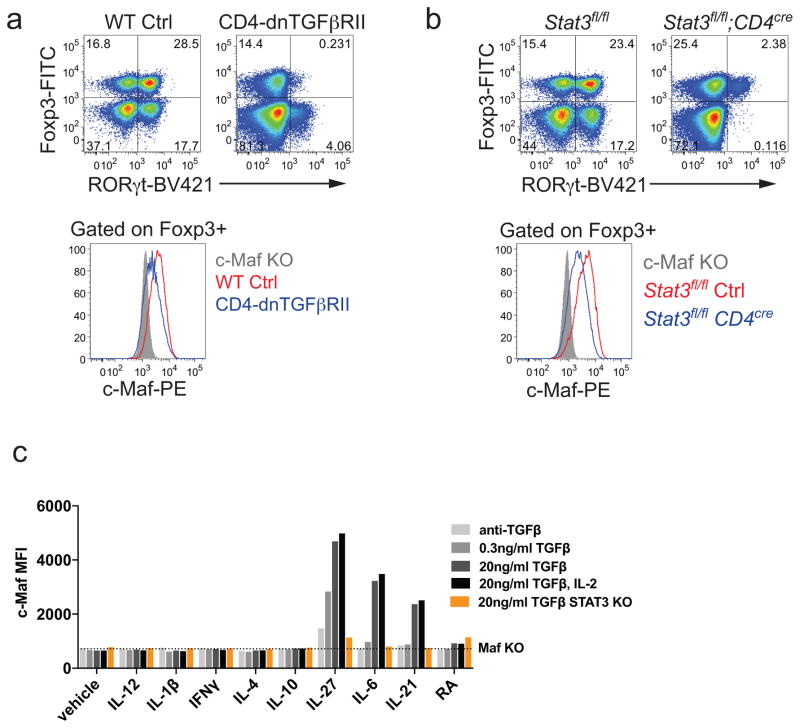
Similar to the MafΔTreg strain, mice with inactivation of Stat3 in the Treg compartment or impaired TGFβ signaling in CD4+ T cells also lacked RORγt+ Treg and developed spontaneous colitis (Extended Data Fig. 9a, b)12,22,23. Consistent with these findings, c-Maf expression in Treg required a combination of both TGFβ and Stat3 signals in vitro and in vivo, as it does in other CD4+ T cells (Extended Data Fig. 9a–c)18,19. This suggests that c-Maf integrates anti-inflammatory TGFβ receptor signals with microbe-induced cytokine-dependent Stat3 activation to mediate RORγt+ Treg induction.
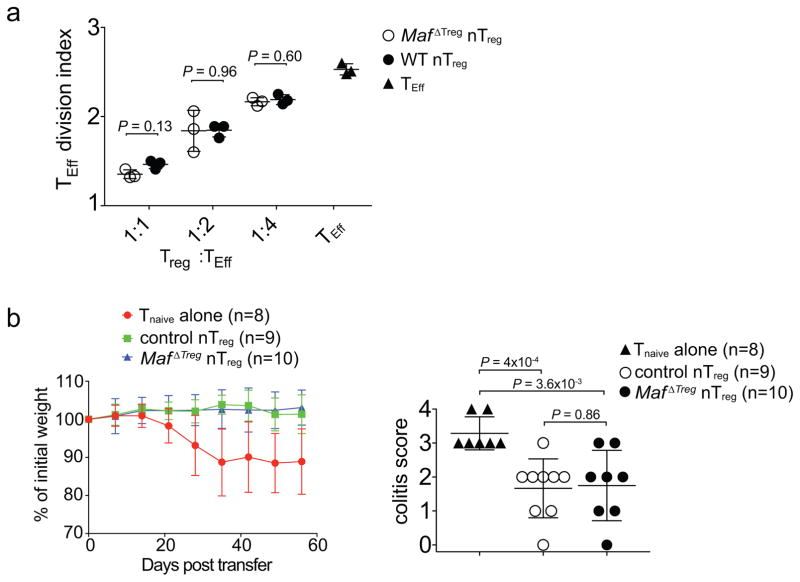
Although c-Maf is also expressed, albeit at a lower level, in nTreg cells, c-Maf-deficient and -sufficient nTreg showed equivalent activity in inhibiting TEff cell proliferation in vitro, as well as in suppressing pathogenesis in a model of T cell transfer colitis in vivo (Extended Data Fig. 10a, b). We therefore wondered why, despite their increased numbers (Extended Data Fig. 6c), nTreg cells were not sufficient to establish gut homeostasis in MafΔTreg mice. Adoptive transfer of 1,000 naïve HH7-2tg or HH5-1tg cells into H. hepaticus-colonized Rag1−/− mice led to colitis. Taking advantage of this system, we compared the suppressive function of iTreg cells differentiated in vitro from naïve HH7-2tg, HH5-1tg and polyclonal T cells. We found that epitope-specific iTreg were better at suppressing colitis, providing a potential explanation for why pathobiont-specific iTreg are required in addition to nTreg to maintain gut homeostasis24 (Fig. 4f, g).
Our results reveal a mechanism for how a healthy individual can host a “two-faced” commensal pathobiont like H. hepaticus without developing inflammatory disease. Our findings suggest that Treg induction serves as a strategy to establish commensalism, not only by helping the microbes to colonize their niche25, but also by protecting the host from inflammation. A similar requirement for iTreg has also been reported in the establishment of food tolerance26. Our observations in MafΔTreg mice are linked to and help explain the expansion of colitogenic TH17 cells in mice with Treg-specific inactivation of Stat323. Like c-Maf, Stat3 is likely required for the differentiation and/or function of microbiota-induced RORγt+ iTreg cells12. Moreover, microbe-specific iTreg cells, compared with non-specific nTreg, can better suppress inflammatory TEff cells by recognizing the same epitopes. This result raises the prospect of harnessing the mechanisms of pathobiont-specific iTreg responses to re-establish homeostasis in IBD patients, for example, by engineering non-pathogenic Treg-inducing microbes27 to express pathobiont antigens.
METHODS
Mice
Mice were bred and maintained in the animal facility of the Skirball Institute (New York University School of Medicine) and the National Institute of Allergy and Infectious Diseases (NIAID) in specific pathogen-free conditions. C57Bl/6 mice were obtained from Jackson Laboratories or Taconic Farm. Il10−/− (B6.129P2-Il10tm1Cgn/J) mice were purchased from Jackson Laboratories and bred with WT C57Bl/6 mice, which subsequently generated Il10+/− and Il10−/− littermates by heterozygous breeding. CD4-dnTGFbRII mice22 were purchased from Jackson Laboratories, and bred with WT C57Bl/6 mice to generate CD4-dnTGFbRII and WT littermates. CD4cre (Tg(Cd4-cre)1Cwi/BfluJ) and CD45.1 (B6.SJL-Ptprca Pepcb/BoyJ) mice were purchased from Jackson Laboratories. Foxp3creYFP mice were previously described and obtained from Jackson Laboratories28. Il23rgfp and Maffl/fl strains were previously described29,30 and kindly provided by Drs. M. Oukka and C. Birchmeier, respectively. Stat3fl/fl;CD4cre mice were kindly provided by Dr. David E. Levy. Gata3fl/fl;Foxp3creYFP mice were bred at the NIAID. Littermates with matched sex (both males and females) were used. Except the aged mice (6–12 month old) analyzed in the experiments of Fig. 4e, mice in all the experiments were 6–12 week old at the starting point of treatments. Animal sample size estimates were determined using power analysis (power=90% and alpha=0.05) based on the mean and standard deviation from our previous studies and/or pilot studies using 4–5 animals per group. All animal procedures were performed in accordance with protocols approved by the Institutional Animal Care and Usage Committee of New York University School of Medicine or the NIAID as applicable.
Antibodies, intracellular staining and flow cytometry
The following monoclonal antibodies were purchased from eBiosciences, BD Pharmingen or BioLegend: CD3 (145-2C11), CD4 (RM4-5), CD25 (PC61), CD44 (IM7), CD45.1 (A20), CD45.2 (104), CD62L (MEL-14), CXCR5 (L138D7), NPR-1 (3E12), ST2 (RMST2-2), TCRβ (H57-597), TCR Vβ6 (RR4-7), TCR Vβ8.1/8.2 (MR5-2), TCR Vβ14 (14-2), Bcl-6 (K112-91), c-Maf (T54-853), Foxp3 (FJK-16s), GATA3 (TWAJ), Helios (22F6), RORγt (B2D or Q31-378), T-bet (eBio4B10), IL-10 (JES5-16E3), IL-17A (eBio17B7) and IFN-γ (XM61.2). 4′,6-diamidino-2-phenylindole (DAPI) or Live/dead fixable blue (ThermoFisher) was used to exclude dead cells.
For transcription factor staining, cells were stained for surface markers, followed by fixation and permeabilization before nuclear factor staining according to the manufacturer’s protocol (Foxp3 staining buffer set from eBioscience). For cytokine analysis, cells were incubated for 5 h in RPMI with 10% FBS, phorbol 12-myristate 13-acetate (PMA) (50 ng/ml; Sigma), ionomycin (500 ng/ml; Sigma) and GolgiStop (BD). Cells were stained for surface markers before fixation and permeabilization, and then subjected to intracellular cytokine staining according to the manufacturer’s protocol (Cytofix/Cytoperm buffer set from BD Biosciences).
Flow cytometric analysis was performed on an LSR II (BD Biosciences) or an Aria II (BD Biosciences) and analyzed using FlowJo software (Tree Star).
Isolation of lymphocytes
Intestinal tissues were sequentially treated with PBS containing 1 mM DTT at room temperature for 10 min, and 5 mM EDTA at 37°C for 20 min to remove epithelial cells, and then minced and dissociated in RPMI containing collagenase (1 mg/ml collagenase II; Roche), DNase I (100 μg/ml; Sigma), dispase (0.05 U/ml; Worthington) and 10% FBS with constant stirring at 37°C for 45 min (SI) or 60 min (LI). Leukocytes were collected at the interface of a 40%/80% Percoll gradient (GE Healthcare). The Peyer’s patches and cecal patch were treated in a similar fashion except for the first step of removal of epithelial cells. Lymph nodes and spleens were mechanically disrupted.
Single-cell TCR cloning
Il23rGFP/+ mice were maintained in SFB-free conditions to guarantee low TH17 background levels. To induce a robust TH17 response, the mice were orally infected with H. hepaticus and injected intraperitoneally with 1mg anti-IL10RA (clone 1B1.3A, Bioxcell) every week from the day of infection. After two weeks, LI GFP+ CD4+ T cells were sorted on the BD Aria II and deposited at one cell per well into 96-well PCR plates pre-loaded with 5 μl high-capacity cDNA reverse transcription mix (Thermo Fisher) supplemented with 0.1% Triton X-100 (Sigma-Aldrich). Immediately after sorting, whole plates were incubated at 37 °C for 2 h, and then inactivated at 85°C for 10 min for cDNA preparation. A nested multiplex PCR approach described previously was used to amplify the CDR3α and CDR3β TCR regions separately from the single cell cDNA31. PCR products were cleaned up with ExoSap-IT reagent (USB) and Sanger sequencing was performed by Macrogen. Open reading frame nucleotide sequences of the TCRα and TCRβ families were retrieved from the IMGT database (http://www.imgt.org)32.
Generation of TCR hybridomas
The NFAT-GFP 58α−β− hybridoma cell line was kindly provided by Dr. K. Murphy33. To reconstitute TCRs, cDNA of TCRα and TCRβ were synthesized as gBlocks fragments by Integrated DNA Technologies (IDT), linked with the self-cleavage sequence of 2A (TCRα-p2A-TCRβ), and shuttled into a modified MigR1 retrovector in which IRES-GFP was replaced with IRES-mCD4 (mouse CD4) as described previously8. Then retroviral vectors were transfected into Phoenix E packaging cells using TransIT-293 (Mirus). Hybridoma cells were transduced with viral supernatants in the presence of polybrene (8μg/ml) by spin infection for 90 min at 32 °C. Transduction efficiencies were monitored by checking mCD3 surface expression three days later.
Assay for hybridoma activation
Splenic dendritic cells were used as antigen presenting cells (APCs). B6 mice were injected intraperitoneally with 5 × 10⁶ FLT3L-expressing B16 melanoma cells to drive APC proliferation as previously described34. Splenocytes were prepared 10 days after injection, and positively enriched for CD11c+ cells using MACS LS columns (Miltenyi). 2 x 10⁴ hybridoma cells were incubated with 105 APCs and antigens in round bottom 96-well plates for two days. GFP induction in the hybridomas was analyzed by flow cytometry as an indicator of TCR activation.
Construction and screen of whole-genome shotgun library of H. hepaticus
The shotgun library was prepared with a procedure modified from previous studies7,8. In brief, genomic DNA was purified from cultured H. hepaticus with DNeasy PowerSoil kit (Qiagen). DNA was partially digested with MluCI (NEB), and the fraction between 500 and 2000 bp was ligated into the EcoRI-linearized pGEX-6P-1 expression vector (GE Healthcare). Ligation products were transformed into ElectroMAX DH10B competent Cells (Invitrogen) by electroporation. To estimate the size of the library, we cultured 1% and 0.1% of transformed bacteria on lysogeny broth (LB) agar plates containing 100μg/mL Ampicillin for 12 h and then quantified the number of colonies. The library is estimated to contain 3X10⁴ clones. To ensure the quality of the library, we sequenced the inserts of randomly picked colonies. All the sequences were mapped to the H. hepaticus genome, and their sizes were 700 to 1200 bp. We aliquoted the bacteria into 96-well deepwell plates (Axygen) (~30 clones/well) and grew with AirPort microporous cover (Qiagen) in 37°C. The expression of exogenous proteins was induced by 1mM isopropylthiogalactoside (IPTG, Sigma) for 4 h. Then bacteria were collected in PBS and heat-killed by incubating at 85 °C for 1 h, and stored at −20 °C until use. Two screening rounds were performed to identify the antigen-expressing clones. For the first round, pools of heat-killed bacterial clones were added to a co-culture of splenic APCs and hybridomas. Clones within the positive pools were subsequently screened individually against the hybridoma bait. Finally, the inserts of positive clones were subjected to Sanger sequencing. The sequences were blasted against the genome sequence of H. hepaticus (ATCC51449) and aligned to the annotated open reading frames. Full-length open reading frames containing the retrieved fragments were cloned into pGEX-6P-1 to confirm their activity in the T cell stimulation assay.
Epitope mapping
We cloned overlapping fragments spanning the entire HH_1713 coding region into the pGEX-6P-1 expression vector, and expressed these in E. coli BL21 cells. The heat-killed bacteria were used to stimulate relevant hybridomas. This process was repeated until we mapped the epitope to a region containing 30 amino acids. The potential MHCII epitopes were predicted with online software RANKPEP35. Overlapping peptides spanning the predicted region were further synthesized (Genescript) and verified by stimulation of the hybridomas.
Generation of TCRtg mice
TCR sequences of HH5-1 and HH7-2 were cloned into the pTα and pTβ vectors kindly provided by Dr. D. Mathis36. TCR transgenic animals were generated by the Rodent Genetic Engineering Core at the New York University School of Medicine. Positive pups were genotyped by testing TCR Vβ8.1/8.2 (HH5-1tg) or Vβ6 (HH7-2tg) expression on T cells from peripheral blood.
MHCII tetramer production and staining
HH-E2 tetramer was kindly produced by the NIH Tetramer Core Facility37. Briefly, QESPRIAAAYTIKGA (HH_1713-E2), an immunodominant epitope validated with the hybridoma stimulation assay, was covalently linked to I-Ab via a flexible linker, to produce pMHCII monomers. Soluble monomers were purified, biotinylated, and tetramerized with phycoerythrin- or allophycocyanin-labelled streptavidin. SFB-specific tetramer (3340-A6 tetramer) was described previously8. To stain endogenous T cells, mononuclear cells from SILP, LILP or CP were first resuspended in MACS buffer with FcR block, 2% mouse serum and 2% rat serum. Then tetramer was added (10 nM) and incubated at room temperature for 60 min, and cells were re-suspended by pipetting every 20 min. Cells were washed with MACS buffer and followed by regular surface marker staining at 4 °C.
Adoptive transfer of TCRtg cells
Recipient mice were colonized with H. hepaticus and/or SFB by oral gavage seven days prior to adoptive transfer (The method for oral infection of SFB has been previously described8). Spleens from donor TCRtg mice were collected and mechanically disassociated. Red blood cells were lysed using ACK lysis buffer (Lonza). For TCRtg mice in WT background, naive Tg T cells were sorted as CD4+CD3+CD44loCD62LhiCD25− Vβ6+ (HH7-2tg), Vβ8.1/8.2+ (HH5-1tg) or Vβ14+ (7B8tg) on the Aria II (BD Biosciences). For HH7-2tg mice bred to the Foxp3creYFP background, naive Tg T cells were sorted as CD4+CD3+CD44loCD62LhiFoxp3creYFP−Vβ6+. Cells were resuspended in PBS on ice and transferred into congenic isotype-labeled recipient mice by retro-orbital injection. Cells from indicated tissues were analyzed two weeks after transfer.
H. hepaticus culture and oral infection
H. hepaticus was kindly provided by Dr. James Fox (MIT). Frozen stock aliquots of H. hepaticus were stored in Brucella broth with 20% glycerol and frozen at −80°C. The bacteria were grown on blood agar plates (TSA with 5% sheep blood, Thermo Fisher). Inoculated plates were placed into a hypoxia chamber (Billups-Rothenberg), and anaerobic gas mixture consisting of 80% nitrogen, 10% hydrogen, and 10% carbon dioxide (Airgas) was added to create a micro-aerobic atmosphere, in which the oxygen concentration was 3~5%. The micro-aerobic jars containing bacterial plates were left at 37°C for 5 days before animal inoculation. For oral infection, H. hepaticus was resuspended in Brucella broth by application of a pre-moistened sterile cotton swab applicator tip to the colony surface. The concentration of bacterial inoculation dose was determined by the use of a spectrophotometric optical density (OD) analysis at 600 nm, and adjusted to OD600 readings between 1 and 1.5. 0.2 mL bacterial suspension was administered to each mouse by oral gavage. Mice were inoculated every 5 days for a total of two doses.
H. hepaticus-specific TCRtg cell mediated transfer colitis
Naïve T (Tnaive) cells were isolated from the spleens of HH7-2tg mice as CD4+CD3+CD44loCD62LhiCD25− Vβ6+ by FACS. The sorted cells (1 ×10³) were administered by retro-orbital injection into H. hepaticus-colonized Rag1−/− mice. After two weeks, cells from the LI were isolated and analyzed by flow cytometry.
C. rodentium mediated colon inflammation
C. rodentium strain DBS100 (ATCC51459; American Type Culture Collection) was used for all inoculations. Bacteria were grown at 37°C in LB broth to OD600 reading between 0.4 and 0.6. Mice were inoculated with 200 μl of a bacterial suspension (1–2 × 10⁹ CFU) by way of oral gavage. After 15 days, cells from the LI were isolated, stained for HH-E2 tetramer and other markers as indicated and analyzed by flow cytometry.
DSS-induced colitis
Mice were colonized with H. hepaticus 5 days before dextran sulfate sodium (DSS) treatment. To induce colitis, mice were given 2% DSS (50,000MW, Affymetrix/USB) in drinking water for 2 cycles, with each exposure for 7 days with 5 days of untreated water in between. Control mice were given drinking water for the same period. Cells from the LI were then isolated, stained for HH-E2 tetramer and other marks as indicated and analyzed by flow cytometry. Animal weights were monitored daily during the entire experiment.
T cell culture
Naïve CD4+ T cells were purified from spleen and lymph nodes of mice with indicated genotypes. Briefly, CD4+ T cells were positively selected from organ cell suspensions by magnetic-activated cell sorting using CD4 beads (MACS, Miltenyi) according to the product protocol, and then isolated as CD4+CD3+CD44loCD62LhiCD25− (polyclonal) or CD4+CD3+CD44loCD62LhiCD25− Vβ6+ (HH7-2tg) or Vβ8.1/8.2+ (HH5-1tg) by FACS. T cells were cultured at 37°C in RPMI (Hyclone) supplemented with 10% heat-inactivated FBS (Hyclone), 50 U penicillin-streptomycin (Hyclone), 2 mM glutamine (Hyclone), 10mM HEPES (Hyclone), 1mM sodium pyruvate (Hyclone) and 50 μM β-mercaptoethanol (Gibco).
To generate iTreg cells for transfer colitis experiments (see below), WT, HH7-2tg or HH5-1tg cells were seeded at 1x10⁶ cells in 1.5 ml per well in 12-well plates pre-coated with an anti-hamster IgG secondary antibody (MP Biomedicals), and cultured for 72 h. The culture was supplemented with soluble anti-CD3ε (0.25μg/ml, Bioxcell, clone 145-2C11) and anti-CD28 (1μg/ml, Bioxcell, clone 37.51) for TCR stimulation, and anti-IL4 (1μg/ml, Bioxcell, clone 11B11), anti-IFNγ (1μg/ml, Bioxcell, clone XMG1.2), human TGFβ1 (20ng/ml, Peprotech), human IL-2 (500U/ml, Peprotech) and all-trans retinoic acid (100nM, sigma) for optimal iTreg polarization. Aliquots of cultured cells were analyzed for intracellular Foxp3 staining by flow cytometry. After they were confirmed to be >98% Foxp3+, the remaining live cells (DAPI negative) were FACS sorted for adoptive transfer.
To test the conditions inducing c-Maf expression, 200μl naïve T cells isolated from Maffl/fl, Maffl/fl; CD4cre or Stat3fl/fl; CD4cre mice were seeded at 1x10⁵ cells per well in 96-well plates pre-coated with the anti-hamster IgG secondary antibody, and cultured for 48 h. The culture was supplemented with soluble anti-CD3ε (0.25μg/mL) and anti-CD28 (1μg/mL) for TCR stimulation. Combinations of the following antibodies or cytokines were added as indicated in Extended Data Fig. 9c: anti-TGFβ (1μg/mL, Bioxcell, 1D11.16.8), human TGFβ1 (0.3 or 20ng/ml, Peprotech), human IL-2 (500U/ml, Peprotech), mouse IL-6 (20ng/ml, Thermo), mouse IL-10 (100ng/ml, Peprotech), mouse IL-27 (25ng/ml, Thermo), mouse IL-12 (10ng/ml, Peprotech), mouse IL-1β (10ng/ml, Peprotech), mouse IL-4 (10ng/ml, R&D systems), mouse IFNγ (10ng/ml, Peprotech), and all-trans retinoic acid (100nM, sigma).
Treg cell in vitro suppression assay
Tnaive cells with the phenotype CD4+CD3+CD44loCD62LhiCD25− were isolated from the spleen and lymph nodes of CD45.1 WT B6 mice by FACS and labeled with carboxyfluorescein diacetate succinimidyl ester (CFSE). nTreg (CD45.2) with the phenotype CD4+CD3+Foxp3creYFP+NRP1+ were isolated from the spleen and lymph nodes of Foxp3creYFP or MafΔTreg mice by FACS. B cells were isolated from the spleen and lymph nodes of CD45.2 WT B6 mice by positive enrichment for B220+ cells using MACS LS columns (Miltenyi). 2.5 × 10⁴ CFSE-labeled Tnaive cells were cultured for 72 h with B cell APCs (5 ×10⁴) and anti-CD3 (1 μg/ml) in the presence or absence of various numbers of nTreg cells as indicated. The cell division index of responder T cells was assessed by dilution of CFSE using FlowJo software (Tree Star).
Suppression of adoptive transfer colitis with Treg cells
To compare the suppressive function of c-Maf -sufficient and -deficient nTreg cells, CD4+CD3+CD25−CD45RBhi TEff cells were isolated by FACS from B6 mouse spleens and CD4+CD3+Foxp3-YFP+NPR1+ nTreg were isolated from spleen of H. hepaticus-colonized Foxp3creYFP or MafΔTreg mice. TEff cells (5 ×10⁵) were administered by retro-orbital injection into H. hepaticus-colonized Rag1−/− mice alone, or simultaneously with 4 ×10⁵ nTreg as previously described38. Animal weights were measured weekly.
To compare the suppressive function of TCRtg and polyclonal Treg cells, Tnaive cells with the phenotype CD4+CD3+CD44loCD62LhiCD25− and Vβ6+ (HH7-2tg) or CD4+CD3+CD44loCD62LhiCD25− and Vβ8.1/8.2+ (HH5-1tg) were isolated from spleens of TCRtg mice. 1,000 naïve HH7-2tg or HH5-1tg cells were co-transferred with different numbers (500,000, 150,000 or 50,000 as indicated in Fig. 4f, g) of in vitro polarized (see T cell culture, above) HH7-2tg, HH5-1tg or polyclonal iTreg cells into H. hepaticus-colonized Rag1−/− mice by retro-orbital injection.
Co-housed littermate recipients were randomly assigned to different treatment groups such that each cage contained all treatment conditions. After four to five weeks (for nTreg comparisons) or eight weeks (for the Tg T cell comparisons), large intestines were collected and fixed with 10% neutral buffered formalin (Fisher). Samples were sectioned and stained with hematoxylin and eosin (H&E) by the Histopathology Core at the New York University School of Medicine.
Histology analysis
The H&E slides from each sample were examined in a blinded fashion. Samples of proximal, mid, and distal colon were graded semiquantitatively from 0 to 4 as described previously39. Scores from proximal, mid, and distal sites were averaged to obtain inflammation scores for the entire colon.
Cell isolation for RNA-seq experiment
A T cell reconstitution system was designed to purify c-Maf-sufficient or -deficient iTreg cells from compatible microenvironments. Briefly, Tnaive cells were isolated from the spleen of CD45.2 Foxp3creYFP or MafΔTreg mice as CD4+CD3+CD44loCD62LhiFoxp3-YFP− and Treg cells were isolated from the spleens of CD45.1 WT B6 mice as CD4+CD3+CD25+ by FACS. Tnaive cells (2 ×10⁵) and Treg cells (8 ×10⁵) were simultaneously administered by retro-orbital injection into H. hepaticus-colonized Rag1−/− mice. Two weeks after transfer, c-Maf-sufficient or -deficient iTreg cells were purified from the LI of reconstituted mice as CD4+CD3+CD45.1−CD45.2+Foxp3-YFP+ by FACS and collected into FBS. 20% of the sorted cells were stained for RORγt and Foxp3 and the remaining cells were saved in TRIzol (Invitrogen) for RNA extraction.
To isolate H. hepaticus-specific colitogenic T effector (TEff) cells, HH7-2tg;Maf ΔTreg and HH7-2tg;Foxp3cre mice were colonized with H. hepaticus. HH7-2tg;Foxp3cre mice were further I.P. injected with 1mg anti-IL10RA antibody (clone 1B1.3A, Bioxcell) weekly from the day of colonization. HH7-2 TEff cells (CD3+CD4+TCRVβ6+Foxp3-YFP−) were sorted from the LILP two weeks after colonization. Homeostatic IL-23R-GFP+ T cells (CD3+CD4+IL-23R-GFP+) were sorted from both SILP and LILP of Il23rgfp/+ mice stably colonized with SFB.
RNA-seq library preparation
Total RNA was extracted using TRIzol (Invitrogen) followed by DNase I treatment and cleanup with RNeasy MinElute kit (Qiagen). Treg RNA-seq libraries were prepared with the SMART-Seq v4 Ultra Low Input RNA Kit (Clontech cat # 634899 and 634888). TH17 RNA libraries were prepared using the Nugen Ovation Ultralow Library Systems V2 (cat # 7102 and 0344). All sequencing was performed using the Illumina NextSeq. RNAseq libraries were prepared and sequenced by the Genome Technology Core at New York University School of Medicine.
Data processing of RNA-seq
RNA-seq reads were mapped to the Mus musculus genome Ensembl annotation release 87 with STAR (v2.5.2b)40. Uniquely mapped reads were counted using featureCounts41 with parameters: -p -Q 20. DESeq242 was used to identify differentially expressed genes across conditions with experimental design: ~Condition + Gender. Read counts were normalized and transformed by functions varianceStabilizingTransformation and rlog in DESeq2 with the following parameter: blind=FALSE. Gender differences were considered as batch effect, and were corrected by ComBat43. Downstream analysis and data visualization were performed in R44.
Statistical analysis
For animal studies, mutant and control groups did not always have similar standard deviations therefore unpaired two-sided Welch’s t-test was used. Error bars represent +/- 1 standard deviation. Animal sample size estimates were determined using power analysis (power=90% and alpha=0.05) based on the mean and standard deviation from our previous studies and/or pilot studies using 4–5 animals. No samples were excluded from analysis. For RNA-seq analysis, differentially expressed genes were calculated in DESeq2 using the Wald test with Benjamini-Hochberg correction to determine FDR. Genes were considered differentially expressed with FDR < 0.1 and Log2 fold change > 1.5. Enriched disease pathways in pathogenic HH7-2 TH17 were determined using Ingenuity Pathway Analysis (www.Ingenuity.com). Gene set enrichment analysis (GSEA, http://www.broad.mit.edu/gsea/) on Maf-deficient vs –sufficient iTreg was performed using a gene set of 33 RORγt-dependent genes in Nrp1− colonic Treg (RORC, CCR6, IDUA, IL1RN, C2CD4B, NXT1, TMEM176B, CXCR3, TNFRSF1A, ADAMTS7, PIK3IP1, RRAD, CRMP1, IRAK3, FAM129B, PPCS, TBXA2R, AVPI1, SERPINB1A, ALKBH7, NCKIPSD, HAVCR2, IL23R, TXNIP, IGJ, TRIM16, PIGP, RRAS, SAMD10, IL1R2, F2RL1, MAFF, LY6C1)11.
Data Availability
cDNA sequences of H. hepaticus-specific TCRs yielding data that support the findings of this study have been deposited in GenBank with the accession codes KY964547-KY964570. RNA-seq data can be found under the following accession numbers: SRA (SRP126932), GEO (GSE108184).
Extended Data
Extended Data Figure 1. Cloning and characterization of H. hepaticus-specific TH17 TCRs, and generation of TCR transgenic (TCRtg) mice and MHC-II tetramers.
a, IL-23R-GFP expression in CD4+ T cells from the large intestines of mice with and without H. hepaticus colonization and after IL-10Ra blockade. Data are from one of five independent experiments. b, Experimental scheme for cloning H. hepaticus-induced single IL-23R-GFP+ (predominantly TH17) cell TCRs under IL-10Ra blockade. c, Summary of the twelve dominant H. hepaticus-induced TH17 TCRs. d, In vitro activation of CFSE-labeled naive HH7-2tg and HH5-1tg cells by indicated stimuli in the presence of antigen-presenting cells. Data are from one of two independent experiments. e, f, Expansion of donor-derived HH7-2tg (e) and HH5-1tg (f) (CD45.2) cells in the large intestine (LI) of H. hepaticus-colonized or -free CD45.1 mice, gated on total CD4+ T cells. Data are from one of three independent experiments. g, HH-E2 tetramer staining of CD4+ T cells from the LI of H. hepaticus-colonized or -free mice. Data are from one of six independent experiments.
Extended Data Figure 2. Extended characterization of SFB- and H. hepaticus-specific T cells in distinct anatomical sites in bacteria-colonized WT mice.
a, Representative flow cytometry plots of donor-derived HH7-2tg (CD45.1/45.2) and 7B8tg (CD45.2/45.2) T cells in indicated tissues of mice colonized with SFB and H. hepaticus, gated on total CD4+ T cells (CD4+CD3+) (n=15). b, Proportions of donor-derived HH7-2tg and 7B8tg T cells among total CD4+ T cells in indicated tissues. Data in (a) and (b) are from one of 3 experiments, with total of 15 mice in the 3 experiments. c, Representative flow cytometry plots of RORγt, Foxp3, Bcl6 and CXCR5 expression in CD4+ T cells from the host and from HH7-2tg and 7B8tg donors in different tissues (n=15). d, Frequencies of Treg (Foxp3+), TH17 (Foxp3−RORγt+) and TFH (Bcl6+CXCR5+) cells among donor-derived HH7-2tg and 7B8tg cells in different tissues. Data are from one of 3 experiments, with total of 15 mice in the 3 experiments. e, Representative flow cytometry plots of Foxp3, RORγt, GATA3 and ST2 expression in CD4+ T cells from the host (blue) and from HH7-2tg donors (red) in the LILP (n=5). f, Representative flow cytometry plots of Foxp3, RORγt, GATA3 and ST2 expression in total CD4+ (green) and HH-E2 tetramer+ (red) T cells in the LILP (n=5). SILP: small intestinal lamina propria; LILP: large intestinal lamina propria; PP: Peyer’s patches; CP: cecal patches; mLNs: mesenteric lymph nodes; and Spl: spleen.
Extended Data Figure 3. Extended characterization of H. hepaticus-specific TCRtg cell differentiation.
a, HH7-2tg;Rag1−/− mice do not develop Treg cells in the thymus. Representative flow cytometry plots of Treg (Foxp3+CD25+) frequency in indicated tissues of H. hepaticus-free HH7-2tg;Rag1+/− (n=3) or HH7-2tg;Rag1−/− (n=3) mice. b, c, HH7-2tg Rag1−/− and Rag1+/− donor-derived T cells differentiated into equal frequencies of RORγt+ Treg in the LI of WT mice. Equal numbers (2,000) of congenic isotype-labeled HH7-2tg Rag1+/− (CD45.1/45.1) and Rag1−/− (CD45.1/45.2) naïve T cells were co-transferred into H. hepaticus-colonized WT B6 mice. Cells from the LILP were analyzed two weeks after transfer. Data summarize two independent experiments (n=6). b, Representative flow cytometry plots of donor and recipient T cell frequency (left), and RORγt and Foxp3 expression (right) (n=6). c, Frequencies of Treg (Foxp3+), TH17 (Foxp3−RORγt+) and TFH (Bcl6+CXCR5+) cells among HH7-2tg Rag1+/− (n=6) and Rag1−/− (n=6) donor-derived T cells. d, e, 2,000 naïve HH5-1tg cells (CD45.1/45.2) were adoptively transferred into WT B6 mice (CD45.2/45.2) colonized with H. hepaticus. Cells from LILP and CP were analyzed two weeks after transfer. d, Representative flow cytometry plots are shown for RORγt, Foxp3, Bcl6 and CXCR5 expression in donor-derived and recipient CD4+ T cells in indicated tissues. e, Frequencies of Treg (Foxp3+), TH17 (Foxp3−RORγt+) and TFH (Bcl6+CXCR5+) among HH5-1tg donor T cells (n=8). Data are a summary of eight mice from two independent experiments. All statistics were calculated by unpaired two-sided Welch’s t-test. Error bars: mean ± 1 SD. P values are indicated in the figure.
Extended Data Figure 4. Differentiation of SFB- and H. hepaticus-specific T cells in Il10+/− and Il10−/− mice.
a–d, Equal numbers (10,000) of congenic isotype-labeled HH7-2tg (CD45.1/45.2) and 7B8tg (CD45.1/45.1) T cells were co-transferred into Il10−/− and Il10+/− mice (CD45.2/45.2) colonized with both H. hepaticus and SFB. Intestinal T cells were examined two weeks later. a, Representative flow cytometry plots of Foxp3, RORγt and T-bet expression in total and Foxp3− host CD4+ T cells in the SILP and LILP of Il10+/− (n=10) and Il10−/− (n=8) mice that received TCR Tg T cell transplants. b, Frequencies of Treg (Foxp3+) and TH17 (Foxp3−RORγt+) cells among SILP 7B8tg donor-derived cells in Il10+/− (n=10) and Il10−/− (n=8) mice. Data for (a) and (b) are a summary of four independent experiments. c, Representative flow cytometry plots of IL-10, IL-17A and IFNγ expression in transferred 7B8tg and HH7-2tg cells from LILP and SILP of Il10+/− and Il10−/− mice after re-stimulation (n=5 or 6). d, Proportions of transferred 7B8tg and HH7-2tg cells in the SILP and LILP of Il10+/− and Il10−/− mice that express IL-10, IL-17A and IFNγ after re-stimulation (n =5 or 6). Data for (c) and (d) are a summary of two independent experiments. e, 2000 naïve HH5-1tg cells (CD45.1/45.2) were adoptively transferred into Il10+/− and Il10−/− mice colonized with H. hepaticus. Cells from the LILP were analyzed two weeks after transfer (n=5). Representative flow cytometry plots of RORγt and Foxp3 expression in HH5-1tg donor cells are shown (left), along with a compilation of frequencies of Treg (Foxp3+) and TH17 (Foxp3−RORγt+). f, g, RORγt and Foxp3 expression in total CD4+ and HH-E2 tetramer+ T cells (f) and frequencies (above) and absolute numbers (below) of Treg (Foxp3+) and TH17 (Foxp3−RORγt+) among HH-E2 tetramer+ T cells (g) in the LILP of Il10+/− (day 25, n=8) and Il10−/− (day-12 n=8, day-25 n=7, day-42 n=8) mice colonized with H. hepaticus for indicated times. All statistics were calculated by unpaired two-sided Welch’s t-test. Error bars: mean ± 1 SD. P values are as follows: b, i=0.062 and ii=0.063. e, i=1.46x10⁻³ and ii=3.10x10⁻⁴. g, (top) i=7.82x10⁻⁴, ii=0.014, iii=0.088, iv=1.48x10⁻⁴, v=1.47x10⁻³ and vi=0.016 and (bottom) i=3.85x10⁻⁶, ii=9.63x10⁻⁷, iii=1.31x10⁻⁶, iv=8.91x10⁻⁷, v=1.15x10⁻⁵ and vi=1.56x10⁻⁷.
Extended Data Figure 5. Differentiation of H. hepaticus-specific T cells in colitis models.
a, b, Naïve HH7-2tg T cells were adoptively transferred into H. hepaticus-colonized Rag1−/− mice to induce colitis (n=7). Data summarize two independent experiments. Representative expression of Foxp3, RORγt, and T-bet (a), and a compilation of frequencies of Treg (Foxp3+), TH17 (Foxp3−RORγt+), TH1 (Foxp3−T-bet+) and TH17/TH1 (Foxp3−RORγt+T-bet+) in HH7-2tg donor-derived cells in the LILP of recipient mice was analyzed 4 weeks post transfer. c–e, Analysis of H. hepaticus-specific T cell differentiation during C. rodentium-induced colonic inflammation. Data summarize two independent experiments. c, Schematic of experimental design. d, e, Representative flow cytometry plots of Foxp3, RORγt and T-bet expression in total CD4+ and HH-E2 tetramer+ T cells (d) and frequencies of Treg (Foxp3+) and TH17 (Foxp3−RORγt+) cells among HH-E2 tetramer+ T cells (e) in the LILP of C. rodentium-infected (n=5) and -uninfected mice (n=5). f–h, Analysis of H. hepaticus-specific T cell differentiation during DSS-colitis. Data are a summary of two independent experiments. f, Schematic of experimental design. g, h, Representative flow cytometry plots of Foxp3, RORγt and T-bet expression in total CD4+ and HH-E2 tetramer+ T cells (g) and a compilation of frequencies of Treg (Foxp3+) and TH17 (Foxp3−RORγt+) cells among HH-E2 tetramer+ cells (h) in the LILP of DSS-treated (n=10) and -untreated mice (n=10). All statistics were calculated by unpaired two-sided Welch’s t-test. Error bars: mean ± 1 SD. P values are indicated in the figure.
Extended Data Figure 6. Extended characterization of Maf ΔTreg, RorcΔTreg and Gata3ΔTreg animals.
a, Expression of c-Maf in the indicated CD4+ T cell subsets in the LILP. b, Incomplete depletion of c-Maf protein in RORγt+ Treg cells in MafΔTreg mice shown by a representative flow cytometry graph from 3 independent experiments (left), and a compilation of mean fluorescence intensities (MFI) in RORγt− Tregs and residual RORγt+ Tregs (right). c, Absolute numbers of indicated CD4+ T cell populations in the LILP of indicated mice. Data are a summary of 3 independent experiments for RorcΔTreg (n=7) and littermate controls (n=7) and 4 independent experiments for Maf ΔTreg (n=11) and littermate controls (n=8). d, e, Representative flow cytometry plots of Foxp3, RORγt and GATA3 expression in total and Foxp3+ CD4+ T cells (d) and a compilation of frequencies of RORγt+ and RORγt− Treg (Foxp3+) cells and TH17 (Foxp3−RORγt+) cells among total CD4+ T cells (e) in the LILP of Gata3ΔTreg (n=8) and littermate controls (n=7). Data summarize two independent experiments. f, Absolute numbers of indicated HH-E2 tetramer+ T cell populations in the LILP of indicated mice. Data are a summary of 3 independent experiments for RorcΔTreg (n=7) and littermate controls (n=6) and 4 independent experiments for Maf ΔTreg (n=11) and littermate controls (n=8). g, Representative flow cytometry plots of TFH markers Bcl6 and CXCR5 among total CD4+ and HH-E2 tetramer+ cells from the CP of MafΔTreg mice and littermate controls (n=4). h, i, SFB-specific T cells did not adopt pro-inflammatory TH17-TH1 phenotype or expand in MafΔTreg mice. Data summarize two experiments, MafΔTreg (n=5) and littermate controls (n=6). Representative flow cytometry plots of Foxp3, RORγt and T-bet expression in total CD4+ and SFB-tetramer+ T cells (h) and absolute number of SFB-tetramer+ cells (i) in the SILP. All statistics were calculated by unpaired two-sided Welch’s t-test. Error bars: mean ± 1 SD. P values are indicated in the figure or as follows: c, i=0.42, ii=0.73, iii=6.38x10⁻³, iv=2.28x10⁻⁴, v=7x10⁻¹¹, vi=7.10x10⁻³, vii=2.99x10⁻² and viii=0.83. e, i=0.081, ii=0.102 and iii=0.16. f, i=0.65, ii=0.41, iii=0.045, iv=0.12, v=0.29 and vi=6.28x10⁻³.
Extended Data Figure 7. Analysis of c-Maf function in RORγt+ iTreg cells.
a–d, Equal numbers of congenic isotype-labeled naïve Maf+/+;Foxp3cre (Ctrl, CD45.1/45.2) and Maffl/fl;Foxp3cre (CD45.2/45.2) HH7-2tg cells were co-transferred into H. hepaticus-colonized WT CD45.1 mice. Cells from the LILP, mLNs and spleen were analyzed 15 days after transfer. a, Schematic of experimental design. b, Flow cytometry plot depicting ratio of pooled co-transferred naïve T cells prior to transfer. c, d, Left, ratios of MafΔTreg vs control HH7-2tg donor-derived cells in the mLNs and spleen (n=10). Dashed line represents ratio of co-transferred cells prior to transfer. Right, frequencies of Treg (Foxp3+) and TH17 (Foxp3−RORγt+) among donor-derived cells (n=10). Statistics were calculated by unpaired two-sided Welch’s t-test. Error bars: mean ± 1 SD. P values are indicated in the figure. e–h, Isolation of Maf-deficient and -sufficient iTreg cells for RNA-seq through a T cell reconstitution system. Two replicates represent two independent experiments. e, Schematic of experimental design. f, Flow cytometry plots indicating the sorting gates from two independent experiments. g, Flow cytometry plots showing Foxp3 and RORγt expression in sorted Foxp3-YFP+ cells from two independent experiments. h, Gene Set Enrichment Analysis performed on RNA-seq dataset of c-Maf-sufficient vs. -deficient iTreg (Foxp3-YFP+) cells (n=2 independent experiments) with gene set of 33 RORγt-dependent transcripts identified previously11. i, Top, representative flow cytometry plot of c-Maf expression in TH17 cells (Foxp3− RORγt+) from LILP of control (black) and Maf ΔTreg (red) mice. The c-Maf negative population is defined by gating on Foxp3+RORγt− Treg from MafΔTreg mice (solid grey). Bottom, frequency of c-Maf expression in Th17 cells in control (n=6) and Maf ΔTreg (n=9) mice from 3 independent experiments.
Extended Data Figure 8. Transcriptional profiling of conventional TH17 and H. hepaticus-specific T effector cells.
a–f, RNA-seq was performed on 2 biological replicates of each indicated condition. a, Flow cytometry analysis of HH7-2tg T effector cells from H. hepaticus-colonized mice and conventional IL-23R-GFP+ (predominantly SFB-specific TH17) cells from SFB-colonized mice. GFP+ gates in the lower panel were used for sorting to perform RNA-seq. b, Principal component analysis of RNA-seq data from sorted cell populations. Colored dots represent individual samples (n=2). c, e, f, Differentially expressed genes were calculated in DESeq2 using the Wald test with Benjamini-Hochberg correction to determine FDR. Genes were considered differentially expressed when FDR<0.1 and Log2 fold change > 1.5. c, Venn diagram depicting differentially expressed genes between indicated comparisons. d, Significantly enriched disease pathways in the set of 149 shared genes upregulated in HH7-2tg Maf ΔTreg and HH7-2tg from anti-IL-10RA-treated mice compared to conventional LI TH17. P-values calculated by Ingenuity Pathway Analysis using Fisher’s Exact Test. e, Comparison of transcriptomes of H. hepaticus-specific TH17 cells from mice treated with IL-10Ra blockade or MafΔTreg and conventional TH17 cells. Scatter plot depicting log2 fold change of gene expression. Blue, red and purple dots indicate significant difference. f, Heatmap depicting the 347 shared genes differentially expressed between pathogenic HH7-2 and conventional TH17 cells (purple dots in e). Data for each condition are the mean of 2 biological replicates. Scale bar represents z-scored variance stabilized data (VSD) counts.
Extended Data Figure 9. Stat3 and TGFβ signal synergistically to promote c-Maf expression.
a, Above, representative flow cytometry plots depicting RORγt and Foxp3 expression in CD4+ T cells in the LILP of CD4-dnTGFbRII and littermate controls (n=3). Below, representative plot of c-Maf expression in Foxp3+ cells from above animals. b, Above, representative flow cytometry plots depicting RORγt and Foxp3 expression in CD4+ T cells in the LILP of Stat3fl/fl; CD4Cre and Stat3fl/fl littermate controls (n=4). Below, representative plot of c-Maf staining in Foxp3+ cells from above animals. c, Mean fluorescence intensity of c-Maf staining in in vitro differentiated CD4+ T cells. Naïve CD4+ T cells from WT, Stat3fl/fl;CD4Cre and Maffl/fl;CD4cre mice were activated for 48 h with α-CD3ε/α-CD28 under indicated conditions. Dashed line represents the MFI of c-Maf in Maffl/fl;CD4cre T cells. Data shows one of two independent experiments.
Extended Data Figure 10. c-Maf-deficient nTreg cells retain suppressive function.
a, Equivalent inhibitory function of nTreg cells from Maf ΔTreg and control mice in the in vitro proliferative response of CD4+ T cells (TEff). Three data points are from one of two independent replicates. b, Activity of nTreg cells in the transfer-mediated colitis model. Percentage weight change (left) and colitis histology scores (right) of Rag1−/− mice adoptively transferred with naïve T cells alone (n=8), or naïve T cells in combination with nTreg cells from Maf ΔTreg (n=10) or littermate control Foxp3creYFP (n=9) mice. Data are a summary of two independent experiments. All statistics were calculated by unpaired two-sided Welch’s t-test. Error bars: mean ± 1 SD. P values are indicated in the figure.
Supplementary Material
Acknowledgments
We thank S.Y. Kim and the NYU Rodent Genetic Engineering Laboratory (RGEL) for generating TCR transgenic mice, A. Heguy and colleagues at the NYU School of Medicine’s Genome Technology Center (GTC) for timely preparation of RNA-seq libraries and RNA-sequencing, the NIH Tetramer Core Facility for generating MHC II tetramers, K. Murphy for providing the 58α−β− hybridoma line, D.E. Levy for providing the Stat3fl/fl;CD4cre mice, J. Fox for providing the H. hepaticus strain, P. Dash and P.G. Thomas for advice on single cell TCR cloning, and J.A. Hall, J. Muller and J. Lafaille for suggestions on the manuscript. The Experimental Pathology Research Laboratory of NYU Medical Center is supported by National Institutes of Health Shared Instrumentation Grants S10OD010584-01A1 and S10OD018338-01. The GTC is partially supported by the Cancer Center Support Grant P30CA016087 at the Laura and Isaac Perlmutter Cancer Center. This work was supported by the Irvington Institute fellowship program of the Cancer Research Institute (M. X.); the training program in Immunology and Inflammation 5T32AI100853 (M.P.); the Helen and Martin Kimmel Center for Biology and Medicine (D.R.L.); the Colton Center for Autoimmunity (D.R.L.); and National Institutes of Health grant R01DK103358 (R.B. and D.R.L.). D.R.L. is an Investigator of the Howard Hughes Medical Institute.
Footnotes
Supplementary Information is available in the online version of the paper.
Author Contributions
M.X. and M.P. designed and performed all experiments and analyzed the data. Y.D. performed blinded histology scoring on colitis sections. C.A and C.G. assisted with in vivo and in vitro experiments. R.Y. and M.P. performed RNA-seq analysis. O.J.H. and Y.B. analyzed the Gata3ΔTreg mouse phenotype. R.B. supervised RNA-seq analysis. M.X., M.P., and D.R.L. wrote the manuscript with input from the co-authors. D.R.L. supervised the research and contributed to experimental design.
The authors declare no competing financial interests.
Readers are welcome to comment on the online version of the paper.
References
- 1.Round JL, Mazmanian SK. The gut microbiota shapes intestinal immune responses during health and disease. Nat Rev Immunol. 2009;9:313–323. doi: 10.1038/nri2515. [DOI] [PMC free article] [PubMed] [Google Scholar]
- 2.Hooper LV, Littman DR, Macpherson AJ. Interactions between the microbiota and the immune system. Science. 2012;336:1268–1273. doi: 10.1126/science.1223490. [DOI] [PMC free article] [PubMed] [Google Scholar]
- 3.Kamada N, Seo SU, Chen GY, Nunez G. Role of the gut microbiota in immunity and inflammatory disease. Nat Rev Immunol. 2013;13:321–335. doi: 10.1038/nri3430. [DOI] [PubMed] [Google Scholar]
- 4.Chow J, Tang H, Mazmanian SK. Pathobionts of the gastrointestinal microbiota and inflammatory disease. Curr Opin Immunol. 2011;23:473–480. doi: 10.1016/j.coi.2011.07.010. [DOI] [PMC free article] [PubMed] [Google Scholar]
- 5.Kullberg MC, et al. IL-23 plays a key role in Helicobacter hepaticus-induced T cell-dependent colitis. J Exp Med. 2006;203:2485–2494. doi: 10.1084/jem.20061082. [DOI] [PMC free article] [PubMed] [Google Scholar]
- 6.Hue S, et al. Interleukin-23 drives innate and T cell-mediated intestinal inflammation. J Exp Med. 2006;203:2473–2483. doi: 10.1084/jem.20061099. [DOI] [PMC free article] [PubMed] [Google Scholar]
- 7.Sanderson S, Campbell DJ, Shastri N. Identification of a CD4+ T cell-stimulating antigen of pathogenic bacteria by expression cloning. J Exp Med. 1995;182:1751–1757. doi: 10.1084/jem.182.6.1751. [DOI] [PMC free article] [PubMed] [Google Scholar]
- 8.Yang Y, et al. Focused specificity of intestinal TH17 cells towards commensal bacterial antigens. Nature. 2014;510:152–156. doi: 10.1038/nature13279. [DOI] [PMC free article] [PubMed] [Google Scholar]
- 9.Kearney ER, Pape KA, Loh DY, Jenkins MK. Visualization of peptide-specific T cell immunity and peripheral tolerance induction in vivo. Immunity. 1994;1:327–339. doi: 10.1016/1074-7613(94)90084-1. [DOI] [PubMed] [Google Scholar]
- 10.Moon JJ, et al. Naive CD4(+) T cell frequency varies for different epitopes and predicts repertoire diversity and response magnitude. Immunity. 2007;27:203–213. doi: 10.1016/j.immuni.2007.07.007. [DOI] [PMC free article] [PubMed] [Google Scholar]
- 11.Sefik E, et al. MUCOSAL IMMUNOLOGY. Individual intestinal symbionts induce a distinct population of RORgamma(+) regulatory T cells. Science. 2015;349:993–997. doi: 10.1126/science.aaa9420. [DOI] [PMC free article] [PubMed] [Google Scholar]
- 12.Ohnmacht C, et al. MUCOSAL IMMUNOLOGY. The microbiota regulates type 2 immunity through RORgammat(+) T cells. Science. 2015;349:989–993. doi: 10.1126/science.aac4263. [DOI] [PubMed] [Google Scholar]
- 13.Schiering C, et al. The alarmin IL-33 promotes regulatory T-cell function in the intestine. Nature. 2014;513:564–568. doi: 10.1038/nature13577. [DOI] [PMC free article] [PubMed] [Google Scholar]
- 14.Hirota K, et al. Fate mapping of IL-17-producing T cells in inflammatory responses. Nat Immunol. 2011;12:255–263. doi: 10.1038/ni.1993. [DOI] [PMC free article] [PubMed] [Google Scholar]
- 15.Hand TW, et al. Acute gastrointestinal infection induces long-lived microbiota-specific T cell responses. Science. 2012;337:1553–1556. doi: 10.1126/science.1220961. [DOI] [PMC free article] [PubMed] [Google Scholar]
- 16.Chai JN, et al. Helicobacter species are potent drivers of colonic T cell responses in homeostasis and inflammation. Sci Immunol. 2017;2 doi: 10.1126/sciimmunol.aal5068. [DOI] [PMC free article] [PubMed] [Google Scholar]
- 17.Yang BH, et al. Foxp3(+) T cells expressing RORgammat represent a stable regulatory T-cell effector lineage with enhanced suppressive capacity during intestinal inflammation. Mucosal Immunol. 2016;9:444–457. doi: 10.1038/mi.2015.74. [DOI] [PubMed] [Google Scholar]
- 18.Ciofani M, et al. A validated regulatory network for Th17 cell specification. Cell. 2012;151:289–303. doi: 10.1016/j.cell.2012.09.016. [DOI] [PMC free article] [PubMed] [Google Scholar]
- 19.Apetoh L, et al. The aryl hydrocarbon receptor interacts with c-Maf to promote the differentiation of type 1 regulatory T cells induced by IL-27. Nat Immunol. 2010;11:854–861. doi: 10.1038/ni.1912. [DOI] [PMC free article] [PubMed] [Google Scholar]
- 20.Hoshi N, et al. MyD88 signalling in colonic mononuclear phagocytes drives colitis in IL-10-deficient mice. Nature communications. 2012;3:1120. doi: 10.1038/ncomms2113. [DOI] [PMC free article] [PubMed] [Google Scholar]
- 21.Ivanov II, et al. Specific microbiota direct the differentiation of IL-17-producing T-helper cells in the mucosa of the small intestine. Cell host & microbe. 2008;4:337–349. doi: 10.1016/j.chom.2008.09.009. [DOI] [PMC free article] [PubMed] [Google Scholar]
- 22.Gorelik L, Flavell RA. Abrogation of TGFbeta signaling in T cells leads to spontaneous T cell differentiation and autoimmune disease. Immunity. 2000;12:171–181. doi: 10.1016/s1074-7613(00)80170-3. [DOI] [PubMed] [Google Scholar]
- 23.Chaudhry A, et al. CD4+ regulatory T cells control TH17 responses in a Stat3-dependent manner. Science. 2009;326:986–991. doi: 10.1126/science.1172702. [DOI] [PMC free article] [PubMed] [Google Scholar]
- 24.Haribhai D, et al. A requisite role for induced regulatory T cells in tolerance based on expanding antigen receptor diversity. Immunity. 2011;35:109–122. doi: 10.1016/j.immuni.2011.03.029. [DOI] [PMC free article] [PubMed] [Google Scholar]
- 25.Round JL, et al. The Toll-like receptor 2 pathway establishes colonization by a commensal of the human microbiota. Science. 2011;332:974–977. doi: 10.1126/science.1206095. [DOI] [PMC free article] [PubMed] [Google Scholar]
- 26.Kim KS, et al. Dietary antigens limit mucosal immunity by inducing regulatory T cells in the small intestine. Science. 2016;351:858–863. doi: 10.1126/science.aac5560. [DOI] [PubMed] [Google Scholar]
- 27.Atarashi K, et al. Treg induction by a rationally selected mixture of Clostridia strains from the human microbiota. Nature. 2013;500:232–236. doi: 10.1038/nature12331. [DOI] [PubMed] [Google Scholar]
- 28.Rubtsov YP, et al. Regulatory T cell-derived interleukin-10 limits inflammation at environmental interfaces. Immunity. 2008;28:546–558. doi: 10.1016/j.immuni.2008.02.017. [DOI] [PubMed] [Google Scholar]
- 29.Wende H, et al. The transcription factor c-Maf controls touch receptor development and function. Science. 2012;335:1373–1376. doi: 10.1126/science.1214314. [DOI] [PubMed] [Google Scholar]
- 30.Awasthi A, et al. Cutting edge: IL-23 receptor gfp reporter mice reveal distinct populations of IL-17-producing cells. J Immunol. 2009;182:5904–5908. doi: 10.4049/jimmunol.0900732. [DOI] [PMC free article] [PubMed] [Google Scholar]
- 31.Dash P, et al. Paired analysis of TCRalpha and TCRbeta chains at the single-cell level in mice. J Clin Invest. 2011;121:288–295. doi: 10.1172/JCI44752. [DOI] [PMC free article] [PubMed] [Google Scholar]
- 32.Lefranc MP, et al. IMGT, the international ImMunoGeneTics information system. Nucleic Acids Res. 2009;37:D1006–1012. doi: 10.1093/nar/gkn838. [DOI] [PMC free article] [PubMed] [Google Scholar]
- 33.Ise W, et al. CTLA-4 suppresses the pathogenicity of self antigen-specific T cells by cell-intrinsic and cell-extrinsic mechanisms. Nat Immunol. 2010;11:129–135. doi: 10.1038/ni.1835. [DOI] [PMC free article] [PubMed] [Google Scholar]
- 34.Mach N, et al. Differences in dendritic cells stimulated in vivo by tumors engineered to secrete granulocyte-macrophage colony-stimulating factor or Flt3-ligand. Cancer Res. 2000;60:3239–3246. [PubMed] [Google Scholar]
- 35.Reche PA, Reinherz EL. Prediction of peptide-MHC binding using profiles. Methods Mol Biol. 2007;409:185–200. doi: 10.1007/978-1-60327-118-9_13. [DOI] [PubMed] [Google Scholar]
- 36.Kouskoff V, Signorelli K, Benoist C, Mathis D. Cassette vectors directing expression of T cell receptor genes in transgenic mice. J Immunol Methods. 1995;180:273–280. doi: 10.1016/0022-1759(95)00002-r. [DOI] [PubMed] [Google Scholar]
- 37.Altman JD, et al. Phenotypic analysis of antigen-specific T lymphocytes. Science. 1996;274:94–96. [PubMed] [Google Scholar]
- 38.Ostanin DV, et al. T cell transfer model of chronic colitis: concepts, considerations, and tricks of the trade. Am J Physiol Gastrointest Liver Physiol. 2009;296:G135–146. doi: 10.1152/ajpgi.90462.2008. [DOI] [PMC free article] [PubMed] [Google Scholar]
- 39.Read S, Malmstrom V, Powrie F. Cytotoxic T lymphocyte-associated antigen 4 plays an essential role in the function of CD25(+)CD4(+) regulatory cells that control intestinal inflammation. J Exp Med. 2000;192:295–302. doi: 10.1084/jem.192.2.295. [DOI] [PMC free article] [PubMed] [Google Scholar]
- 40.Dobin A, et al. STAR: ultrafast universal RNA-seq aligner. Bioinformatics (Oxford, England) 2013;29:15–21. doi: 10.1093/bioinformatics/bts635. [DOI] [PMC free article] [PubMed] [Google Scholar]
- 41.Liao Y, Smyth GK, Shi W. featureCounts: an efficient general purpose program for assigning sequence reads to genomic features. Bioinformatics (Oxford, England) 2014;30:923–930. doi: 10.1093/bioinformatics/btt656. [DOI] [PubMed] [Google Scholar]
- 42.Love MI, Huber W, Anders S. Moderated estimation of fold change and dispersion for RNA-seq data with DESeq2. Genome biology. 2014;15:550. doi: 10.1186/s13059-014-0550-8. [DOI] [PMC free article] [PubMed] [Google Scholar]
- 43.Johnson WE, Li C, Rabinovic A. Adjusting batch effects in microarray expression data using empirical Bayes methods. Biostatistics (Oxford, England) 2007;8:118–127. doi: 10.1093/biostatistics/kxj037. [DOI] [PubMed] [Google Scholar]
- 44.R: A language and environment for statistical computing. R Foundation for Statistical Computing; Vienna, Austria: 2016. [Google Scholar]
Associated Data
This section collects any data citations, data availability statements, or supplementary materials included in this article.
Supplementary Materials
Data Availability Statement
cDNA sequences of H. hepaticus-specific TCRs yielding data that support the findings of this study have been deposited in GenBank with the accession codes KY964547-KY964570. RNA-seq data can be found under the following accession numbers: SRA (SRP126932), GEO (GSE108184).


