

Abstract
The recent development of tau-specific positron emission tomography (PET) tracers enables in vivo quantification of regional tau pathology, one of the key lesions in Alzheimer's disease (AD). Tau PET imaging may become a useful biomarker for clinical diagnosis and tracking of disease progression but there is no consensus yet on how tau PET signal is best quantified. The goal of the current study was to evaluate multiple whole-brain and region-specific approaches to detect clinically relevant tau PET signal. Two independent cohorts of cognitively normal adults and amyloid-positive (Aβ+) patients with mild cognitive impairment (MCI) or AD-dementia underwent [18F]AV-1451 PET. Methods for tau tracer quantification included: (i) in vivo Braak staging, (ii) regional uptake in Braak composite regions, (iii) several whole-brain measures of tracer uptake, (iv) regional uptake in AD-vulnerable voxels, and (v) uptake in a priori defined regions. Receiver operating curves characterized accuracy in distinguishing Aβ- controls from AD/MCI patients and yielded tau positivity cutoffs. Clinical relevance of tau PET measures was assessed by regressions against cognition and MR imaging measures. Key tracer uptake patterns were identified by a factor analysis and voxel-wise contrasts. Braak staging, global and region-specific tau measures yielded similar diagnostic accuracies, which differed between cohorts. While all tau measures were related to amyloid and global cognition, memory and hippocampal/ entorhinal volume/thickness were associated with regional tracer retention in the medial temporal lobe. Key regions of tau accumulation included medial temporal and inferior/middle temporal regions, retrosplenial cortex, and banks of the superior temporal sulcus. Our data indicate that whole-brain tau PET measures might be adequate biomarkers to detect AD-related tau pathology. However, regional measures covering AD-vulnerable regions may increase sensitivity to early tau PET signal, atrophy and memory decline.
Keywords: Tau, β-amyloid, Positron emission tomography, AV-1451, Biomarker, Alzheimer's disease
Introduction
The aggregation of hyperphosphorylated tau protein into intracellular neurofibrillary tangles (NFT) is one of the key pathological lesions in Alzheimer's disease (AD), but early tau pathology in medial temporal lobe regions is also common in cognitively normal elderly people (Crary et al., 2014). Post-mortem data indicate that tau accumulation begins in mid-life, years before amyloid beta (Aβ) plaques deposit in the neocortex (Braak and Braak, 1991, 1997). The recent advent of tau-specific positron emission tomography (PET) tracers now allows assessment of regional tau load in the living human brain (Dani et al., 2016; Saint-Aubert et al., 2017; Villemagne et al., 2015), which will provide new insights into the etiology of AD, and help diagnostic accuracy, early detection, and development of treatment. The tau-specific radioligand that has been most widely studied so far is 18[F] AV-1451 (T807), which binds with high affinity to paired-helical filament tau in AD patients (Chien et al., 2013; Lowe et al., 2016; Marquié et al., 2015). Several studies have recently shown that the topography of tau tracer retention corresponds well with expected pathologic stages of NFT deposition delineated by Braak and Braak (Cho et al., 2016a; Johnson et al., 2016; Schöll et al., 2016; Schwarz et al., 2016). Across studies, most normal elderly adults demonstrate elevated binding confined to the medial temporal lobe, whereas neocortical binding, particularly in the inferior temporal lobe, is associated with clinical impairment and the presence of Aβ. Furthermore, recent tau PET studies have found a close relationship between patterns of tau deposition and hypometabolism (Ossenkoppele et al., 2016; Saint-Aubert et al., 2016), atrophy (Sepulcre et al., 2016; Wang et al., 2016) and cognitive impairment (Brier et al., 2016; Johnson et al., 2016; Ossenkoppele et al., 2016), in contrast to weaker associations seen with Aβ.
Aβ PET imaging has been employed for over a decade, and it is now commonly used in therapeutic trials and as a biomarker for clinical diagnosis (McKhann et al., 2011; Siemers et al., 2016). In contrast, the novel modality of tau PET has only recently been incorporated into a proposed new biomarker classification system (Jack et al., 2016a). In this new A/T/N system, Aβ (PET or CSF Aβ 42), tau (PET or CSF phospho-tau), and neurodegeneration (fluorodeoxyglucose-PET, structural MRI, or CSF total tau) are each rated as positive or negative to categorize individuals. While cutoffs for Aβ PET positivity have been intensively studied and compared across different Aβ PET imaging agents (Landau et al., 2013; Mormino et al., 2012; Villeneuve et al., 2014), there is no consensus yet on how to label tau PET scans as normal or abnormal. Unlike the diffuse distribution of Aβ, which is commonly quantified as global cortical mean tracer uptake, tau accumulation shows a hierarchical pattern of spread (Cho et al., 2016a). Thus, the question of how to define tau accumulation requires examination of both the quantity of tracer retention and its location, each of which can be defined in multiple ways. One approach that has been recently used to categorize tau PET positivity is based on the mean tracer uptake in a pre-specified set of “AD-signature” regions (Jack et al., 2016b; Wang et al., 2016). Authors defined cut points by the accuracy to distinguish between clinically impaired and cognitively normal adults. An alternative to a binary classification, previously examined in our lab (Schöll et al., 2016), is a multi-stage approach as proposed by Braak and Braak that is based on the topographic pattern of NFT pathology.
The goal of the current study was to evaluate and compare different approaches to detect clinically relevant tau PET signal and to stage participants. Two ind ependent cohorts of Aβ+ and Aβ- cognitively healthy adults as well as Aβ+ patients with mild cognitive impairment (MCI) or AD-dementia received [18F]AV-1451 tau PET. We employed topographic staging of tau based on Braak-region specific tracer uptake. We also assessed different whole-brain measures to define tracer retention including a global average, a voxel-wise t-score relative to young/middle-aged participants, and the number of supra-threshold voxels. Finally, we quantified tau from AD-vulnerable composite regions: one defined by our group of MCI and AD patients and a second reported in the literature (Jack et al., 2016b). Because we do not have independent neuropathological data to confirm the validity of each method, we examined reliability across cohorts, and correlations with clinical and other variables to assess face validity. For each approach we derived imaging biomarker cut points of tau positivity by discriminating Aβ- cognitively normal elderly participants from Aβ+ MCI and AD patients in one cohort, and tested their reliability (i.e. accuracy) in the other cohort. Finally, we compared the regional pattern of tau PET signal across the different approaches.
Materials and methods
Participants
We studied two independent samples, both of which included Aβ+and Aβ- cognitively normal adults, as well as Aβ+ patients diagnosed with mild cognitive impairment (MCI) or probable AD dementia (Table 1). Participants underwent structural MRI, [18F]AV-1451 PET imaging, neuropsychological assessment and standard laboratory blood tests including apolipoprotein E (ApoE) genotyping. Elderly subjects and patients received [11C]PiB (sample 1) or [18F] Florbetapir (sample 2), which was used to define Aβ status (see PET). The Institutional Review Boards of all participating institutions approved the study and informed consent was obtained from all participants or authorized representatives.
Table 1.
Demographics (Mean ± SD).
| Young/middle-aged controls | Old controls | MCI | AD | |
|---|---|---|---|---|
| Sample 1: BACS/UCSF | ||||
| n | 12 | 74 | 12 | 48 |
| Age (years) | 38 ± 16 | 77 ± 6 | 69 ± 8 | 63 ± 8 |
| Sex (% female) | 8 | 61 | 67 | 60 |
| Education (years) | 16 ± 2 (1 N/A) | 17 ± 2 | 18 ± 3 (1 N/A) | 17 ± 3 (4 N/A) |
| APOE (% of e4 carriers) | 33 (3 N/A) | 32 (3 N/A) | 50 (3 N/A) | 52 |
| MMSE | 29 ± 1 (1 N/A) | 29 ± 1 | 27 ± 2 | 21 ± 5 (2 N/A) |
| CVLT free recall (% correct) | 68 ± 9 (1 N/A) | 58 ± 14 | 67 ± 15 (1 N/A) | 44 ± 16 (6 N/A) |
| PiB DVR | .96 ± .01 (10 N/A) | 1.16 ± .23 | 1.54 ± .28 | 1.67 ± .20 (2 N/A) |
| PiB-positive (n) | 0 (9 N/A)* | 33 | 12 | 47 (1 N/A)* |
| Days betw. PiB and AV-1451 | 0 ± 0 (9 N/A) | 54 ± 95 | 0 ± 0 | 23 ± 60 (1 N/A) |
| Hippocampal volume (cm3) | 4.4 ± .4 | 3.5 ± .4 | 3.4 ± .7 | 3.4 ± .5 |
| Sample 2: ADNI | ||||
| n | 0 | 42 | 19 | 9 |
| Age (years) | – | 74 ± 6 | 79 ± 7 | 79 ± 5 |
| Sex (% female) | – | 50 | 74 | 67 |
| Education (years) | – | 16 ± 2 | 16 ± 3 | 15 ± 3 |
| APOE (% of e4 carriers) | – | 40 (1 N/A) | 53 | 67 |
| MMSE | – | 29 ± 1 | 27 ± 2 | 22 ± 5 |
| RAVLT free recall (% correct) | – | 63 ± 16 (1 N/A) | 45 ± 14 (1 N/A) | 32 ± 12 |
| [18 F] Florbetapir SUVR | – | 1.12 ± .18 | 1.37 ± .13 | 1.45 ± .16 |
| Florbetapir-positive (n) | – | 14 | 19 | 9 |
| Days betw. Florbetapir and AV-1451 | – | 133 ± 156 | 112 ±150 | 324 ± 259 |
| Hippocampal volume (cm3) | – | 3.8 ± .5 | 3.4 ± .5 | 2.9 ± .6 |
APOE = carriers of apolipoprotein E (APOE) ε4 allele; MMSE = Mini-Mental State Examination; Free recall = sum of words across immediate recall trials; CVLT = California Verbal Learning Test (BACS: trials 1–5, 16 words, UCSF: trials 1–4, 9 words); PiB DVR = Pittsburgh Compound-B (PiB) retention in neocortical regions of interest;
For 1 young subject from BACS only PiB SUVR was available (PiB-), 1 AD patient and 9 middle-aged controls had no PiB scan (see PET); RAVLT = Rey Auditory Verbal Learning Test (trials 1–5, 15 words).
Sample 1 (BACS/UCSF)
The first sample comprised 12 young and middle-aged controls (YC/MAC; age range 20-60 yrs) and 74 older cognitively normal controls (OC; 61-93 yrs) from the Berkeley Aging Cohort Study (BACS), of whom 33 were PiB+ (based on threshold global DVR > 1.065; see PET for details). Twelve subjects with MCI (55-80 yrs) and 48 patients with probable AD (48-83 yrs) were recruited from the University of California San Francisco (UCSF) Memory and Aging Center.
BACS eligibility requirements included the following: no MRI or PET contraindications, living independently in the community, Mini-Mental State Examination (MMSE; Folstein et al., 1975) ≥ 25, normal performance on cognitive tests (within 1.5 SD of normative values on the California Verbal Learning Test (CVLT) (Delis et al., 2000) and Delayed Recall from the Wechsler Memory Scale (Wechsler, 1997)), absence of neurological or psychiatric illness, and lack of major medical illnesses and medications that affect cognition. Furthermore, we excluded subjects if they performed below normative values in more than one follow-up session and/or more than one memory test (i.e. verbal and spatial figure recall).
Clinical diagnoses of AD/MCI patients were established by consensus in a multidisciplinary team. All patients underwent standard dementia screening including medical history and physical examination, caregiver interview, and neuropsychological examination. Patients met National Institute on Aging–Alzheimer's Association (NIA-AA) criteria for MCI due to AD (n =12; Albert et al., 2011) or probable AD dementia (n = 48; McKhann et al., 2011). The AD group was relatively young with a mean age at PET of 63 yrs (31/48 with early age [< 65 years] at symptom onset) and included a variety of clinical AD phenotypes such as posterior cortical atrophy, logopenic variant of primary progressive aphasia, amnestic and non-amnestic manifestations. All patients met criteria for Aβ positivity except for one AD patient with no PiB scan who was part of our original data set for definition of Braak ROI-based standardized uptake value ratios (SUVR) thresholds (Schöll et al., 2016). As one of our goals was to re-calculate Braak thresholds using that original data set, we included that patient in the current study.
Sample 2 (ADNI)
Sample 2 included 42 OC (65-83 yrs), 19 MCIs (60-92 yrs) and 9 late-onset AD patients (73-89 yrs) from the Alzheimer's Disease Neuroimaging Initiative (ADNI). ADNI is a multisite longitudinal biomarker study that has enrolled over 1500 cognitively normal older individuals, people with early or late amnestic MCI, and people with early AD (www.adni-info.org). The OC group also included 11 subjects with subjective memory concern (SMC), defined as participants who scored within normal ranges for cognition (Clinical Dementia Rating [CDR] = 0) but indicated that they have memory concerns. The MCI group consisted of 7 subjects with early mild cognitive impairment (EMCI) and 12 with late mild cognitive impairment (LMCI) based on performance on the Wechsler Memory Scale Logical Memory II (Aisen et al., 2010). MCI and AD diagnoses were made using standard criteria (Petersen et al., 2010).
We only included ADNI subjects who had a Florbetapir scan within 2 years of the AV-1451 scan. All MCI and AD patients had positive Florbetapir-PET scans (global SUVR > 1.11).
Magnetic resonance imaging (MRI)
For all subjects included in the study, 1 × 1 × 1 mm3 resolution T1-weighted magnetization prepared rapid gradient echo (MPRAGE) images were acquired. Data for BACS participants were collected at 1.5 T at Lawrence Berkeley National Laboratory (LBNL) (see Schöll et al., 2016 for details); MCI/AD patients underwent 3 T MRI at the UCSF Neuroimaging Center (Ossenkoppele et al., 2015). For ADNI we used maximally-preprocessed 3 T MPRAGE images that have been corrected for non-uniformity and distortion, and at uniform voxel resolution.
All MPRAGE scans were processed with FreeSurfer (v5.3.0 in BACS/UCSF and v5.3.1 in ADNI; http://surfer.nmr.mgh.harvard.edu/) to derive regions of interest (ROIs) in each subject's native space using the Desikan-Killiany atlas. ROIs were used for calculation of region-specific tau PET measures after partial volume correction (PVC; see AV-1451 processing for ROI-based analyses and Baker et al., submitted for publication). FreeSurfer output was also used to derive bilateral hippocampal volume and entorhinal thickness measures.
MRI images were also segmented into brain tissue types using SPM12 (Statistical Parametric Mapping; Wellcome Department of Cognitive Neurology, London, England). Tissue segments for non-cerebral tissues (cerebrospinal fluid [CSF], soft tissue, bone) were subsequently used for PVC. Segmentations for gray matter, white matter and CSF were summed to derive total intra cranial volume (ICV), which was included as a covariate in correlation analyses between tau measures and hippocampal volume to account for differences in head size.
Finally, we created an inferior cerebellar gray ROI (which we used as reference region for AV-1451) from the reverse-normalized cerebellar SUIT template (rnCereSUIT). A detailed description including code can be found in Baker et al. (submitted for publication).
PET (Positron emission tomography)
Imaging in BACS/UCSF
A detailed description of AV-1451 (tau) PET and PiB (Aβ) PET acquisition for BACS/UCSF has been published previously (Ossenkoppele et al., 2016; Schöll et al., 2016). Briefly, PiB and AV-1451 PET data were acquired at LBNL. AV-1451 scans were collected within 38 ± 80 days of PiB.
We created AV-1451 SUVR images based on mean uptake over 80–100 min post-injection (Baker et al., 2016; Shcherbinin et al., 2016; Wooten et al., 2016) normalized by mean inferior cerebellar gray matter uptake. We chose inferior cerebellum as reference region as the superior portion of the cerebellar gray showed frequent tracer binding as well as bleeding in from neighbored cortical regions (see Baker et al., submitted for publication; Fig. 3).
Fig. 3.
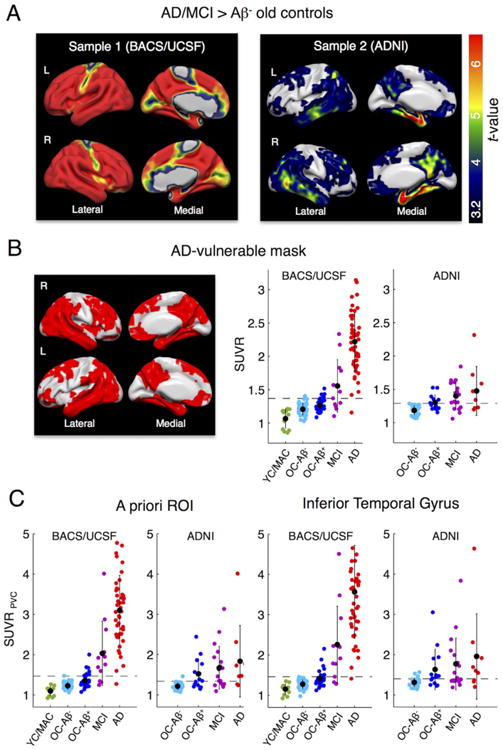
AD-specific tau tracer uptake and regional tau measures. A. To identify and compare AD-specific regions of high tau tracer retention within the 2 samples, we performed voxel-wise 2-sample t-tests between AD/MCI patients (all Aβ+) vs. Aβ- old controls (OC). Sample 1: Aβ+ MCIs/ADs (n = 60) patients from UCSF vs. BACS Aβ- controls (n = 41). Sample 2: Aβ+ MCIs/ADs (n = 28) vs. Aβ- controls (n = 28) from ADNI. Results are FWE-corrected at cluster-level (pcluster < .05, pvoxel < .001). Note that sample 1 included a variety of AD phenotypes. B. The overlap between significant t-test maps was used to create an AD-vulnerable mask (left). The mean SUVR across voxels in the AD-mask (in MNI space, no PVC) was calculated for both samples (right). Cut points that best discriminate patients from Aβ+ controls (Table 3) are displayed as dashed lines. C. Regional uptake was also determined in a composite a priori ROI of AD-signature regions as well as the inferior temporal gyrus after PVC. Black dots are group means. Error bars denote SD.
AV-1451 PET images were reconstructed using an ordered subset expectation maximization algorithm with weighted attenuation and smoothed with a 4 mm Gaussian kernel with scatter correction (calculated image resolution 6.5 × 6.5 × 7.25 mm3 using Hoffman). SUVR images were coregistered and resliced to the structural MRI closest in time to AV-1451 PET. BACS/UCSF AV-1451 SUVR images were further smoothed with a 4.7 × 4.7 × 2.8 mm3 FWHM kernel to achieve a similar resolution as the ADNI data (i.e. 8 × 8 × 8 mm3).
Distribution volume ratios (DVRs) for PiB images were generated with Logan graphical analysis on PiB frames corresponding to 35–90 min post-injection using a cerebellar gray matter reference region (Logan et al., 1996; Price et al., 2005). The global cortical PiB DVR was calculated as a weighted mean across FreeSurfer-derived frontal, temporal, parietal and posterior cingulate cortical regions. Participants were classified as PiB-positive if their global PiB DVR was above 1.065, a cutoff adapted from previous thresholds developed in our laboratory (Mormino et al., 2012; Villeneuve et al., 2015).
For 1 middle-aged subject who received a PiB scan (note that PiB scans were not mandatory for the YC/MAC) no full dynamic PiB data was available; in this case, an SUVR image was generated (50–70 min post-injection, cerebellar gray reference). The MAC was PiB-negative (global PiB SUVR = 1.13), (Villeneuve et al., 2015). We only included OC and patients with full dynamic PiB data (i.e. PiB DVR images) into our analyses except for one AD patient with no PiB scan who was part of our original data set for definition of Braak ROI-based thresholds (Schöll et al., 2016).
Imaging in ADNI
For ADNI participants, AV-1451 scans were collected within 151 ± 181 days of the Florbetapir scans. Subjects were scanned beginning at 75 min post-injection, for 30 min (6 × 5 min frames). As in BACS/ UCSF, SUVR images were created based on mean uptake over 80–100 min post-injection normalized by mean inferior cerebellar gray matter. In ADNI SUVR images are smoothed to a common resolution of 8 mm3 (Joshi et al., 2009).
Florbetapir image acquisition details have been previously described in detail (Landau et al., 2012, 2013). Briefly, Florbetapir images consisted of 4 × 5 min frames acquired at 50–70 min post-injection; these were realigned, averaged, resliced to a common voxel size (1.5 mm × 1.5 mm × 1.5 mm), and smoothed to a common resolution of 8 mm3. MPRAGE images that were acquired concurrently with the baseline Florbetapir images were used as a structural template to define cortical and reference regions in native space for each subject using FreeSurfer (v5.3.1) as described previously.
After coregistering Florbetapir scans for each subject to baseline structural MRI scans, we extracted weighted cortical retention means (SUVRs) from frontal, cingulate, parietal, and temporal regions. These were averaged and divided by a whole cerebellum reference region to create a SUVR with a positivity threshold of 1.11 (Landau et al., 2012, 2013).
AV-1451 data processing for ROI-based analyses in individual space
In both data sets, analyses based on a priori defined regions of interest were performed on AV-1451 SUVR images in individual space after correction for partial volume (PV) effects. A detailed description of our PVC method including code to create the ROIs can be found in Baker et al. (submitted for publication). Goals of the PVC were to correct for choroid plexus and basal ganglia signal bleeding into neighboring regions (such as hippocampus), and to account for PV effects due to atrophy. In contrast to our recent study on AV-1451 Braak ROI staging (Schöll et al., 2016), we additionally included non-cerebral tissues into the PVC to correct for spill-over from extra-cortical hotspots (ECH). As described in Baker et al. (submitted for publication), ECH in skull, meninges and soft-tissue was found to decrease with age. In contrast, choroid plexus and basal ganglia uptake increases with age. We used the Geometric Transfer Matrix approach (Rousset et al., 1998) for PVC based on FreeSurfer-derived ROIs. The set of ROIs can be found in Baker et al. (submitted for publication) in Table 2. In addition, we used skull, tissue and CSF segments from SPM tissue probability masks to correct for high signal in extra-cortical regions. Finally, ROI-specific PV-corrected SUVR values were re-normalized by PV-corrected inferior cerebellar gray.
Table 2.
Braak ROI staging based on AV-1451 uptake.
| Stage 0 | Stage I/II | Stage III/IV | Stage V/VI | |
|---|---|---|---|---|
| SUVR thresholds (PVC) | BraakI/II ROI ≤1.129 | BraakI/II ROI > 1.129 | BraakIII/IV ROI > 1.304 | BraakV/VI ROI > 1.873 |
| Original Sample (BACS/UCSF) | ||||
| n (YC/OC-Aβ-/OC-Aβ+/AD) ntotal = 5/18/15/15 | 3/1/3/0 | 2/15/8/0 | 0/2/4/1 | 0/0/0/14 |
| New Sample (BACS/UCSF) | ||||
| n (MAC/OC-Aβ-/OC-Aβ+/MCI/AD) ntotal = 7/23/18/12/33 | 4/9/1/0/0 | 3/13/11/3/1 | 0/1/6/5/3 | 0/0/0/4/29 |
| Original+New (BACS/UCSF) | ||||
| n (YC+MAC/OC-Aβ-/OC-Aβ+/MCI/AD) ntotal =12/41/33/12/48 | 7/10/4/0/0 | 5/28/19/3/1 | 0/3/10/5/4 | 0/0/0/4/43 |
| New Sample (ADNI) | ||||
| n (OC-Aβ-/OC-Aβ+/MCI/AD) ntotal = 28/14/19/9 | 7/2/3/0 | 20/5/5/3 | 1/7/10/5 | 0/0/1/1 |
| Total (BACS/UCSF+ADNI) | ||||
| n (YC+MAC/OC-Aβ-/OC-Aβ+/MCI/AD) ntotal = 12/69/47/31/57 | 7/17/6/3/0 | 5/48/24/8/4 | 0/4/17/15/9 | 0/0/0/5/44 |
| Percentage of group within stage (YC+MAC/OC-Aβ-/OC-Aβ+/MCI/AD) | 58/25/13/10/0 | 42/70/51/26/7 | 0/6/36/48/16 | 0/0/0/16/77 |
Number of participants within a specific in vivo “Braak” stage. An initial subgroup of BACS/UCSF subjects (“original sample”) was used to derive Braak ROI thresholds using a regression-based conditional interference tree approach. Thresholds were tested on a new subgroup of BACS/UCSF subjects as well as on ADNI participants. See also Supplementary Fig. S2. YC=young controls (age range 20-26 yrs), MAC=middle-aged
In addition, for comparability with other studies, we also report cut points and performance of staging for non PV-corrected data.
AV-1451 data processing for voxel-wise analyses in MNI space
In both AV-1451 samples, voxel-wise analyses used SUVR images (normalized to inferior cerebellar gray) that were transformed into MNI152 space (1 mm × 1 mm × 1 mm voxel size). Therefore, T1 images were spatially normalized by SPM12 (using SPM standard normalization) and warping parameters were applied to the PET data.
Approaches for quantification of tau
Braak ROI-based staging
First we quantified tracer retention in ROIs that anatomically approximate the pathologic stages of tangle deposition delineated by Braak and Braak (Braak and Braak, 1991). Specifically we calculated weighted mean SUVR (after PVC, native space) from 3 composite ROIs that correspond to anatomical definitions of Braak stages I/II (transentorhinal), III/IV (limbic), and V/VI (neocortical). Freesurfer indexes for the different Braak ROIs can be found in Baker et al. (submitted for publication) in Table 2. Based on Braak ROI-specific tracer uptake in different clinical groups we have recently employed a regression-based approach to classify subjects into stages and thereby derive SUVR thresholds for each Braak ROI. A detailed description of this approach can be found in Schöll et al. (2016).
In brief, we employed a conditional inference tree in R (v. 3.1.2; Ihaka and Gentleman, 1996) using the function “ctree” of the package “party” to classify subjects with regard to their clinical diagnosis (i.e. YC, OC, AD). We started at late Braak regions, entering the whole dataset into the model to derive an SUVR threshold above which subjects were classified as stage V/VI. After removal of those subjects, we continued the staging with the next Braak ROI (III/IV). Continuing this approach we derived 3 thresholds to assign subjects to stage V/VI, stage III/IV, and stage I/II, defining subjects reaching no threshold as stage 0.
In the current study, we first aimed to re-calculate Braak ROI-based thresholds due to changes in data pre-processing. Therefore, we used the original sample of 5 young (age range 20-26 yrs) and 33 elderly controls from BACS and 15 AD subjects from UCSF. Changes to preprocessing included an initial smoothing to match ADNI AV-1451 resolution, the addition of non-cerebral tissues to the PVC, as well as final re-normalization of each region post-PVC by inferior cerebellar gray. Furthermore, as regions that are likely to reflect extensive off-target binding, we excluded basal ganglia (Lowe et al., 2016; Marquié et al., 2015) and thalamus from the Braak ROIs.
After deriving new thresholds, we applied them to newly acquired data from BACS and UCSF subjects, and to the ADNI sample.
Mean SUVR in Braak stage composite ROIs
In addition to the 4-level Braak ROI-based staging, we also examined mean SUVR (after PVC, native space) within each single Braak composite ROI as a possible regional tau PET biomarker.
Whole-brain measures of tracer uptake
We calculated three whole-brain tau PET scores. First, to derive a global mean SUVR, we calculated a size-weighted average across all ROIs that were included in the Braak regions after PVC (note that this does not include basal ganglia and thalamus).
Second, we used the MNI space SUVR images (no PVC, cortical mask excluding basal ganglia and thalamus) to calculate a global sum t-value score across “abnormal” voxels. The explicit mask can be downloaded from Supplementary file 1. The t-value for each voxel in each scan was calculated relative to the mean and standard error of the mean of BACS YC/MAC subjects (for each voxel: tsubject=[SUVRsubject -mean(SUVRYC/MAC)]/SE(SUVRYC/MAC). For every participant, we calculated the sum of t-values across all voxels where t > 4 (corresponding to 1-sided alpha of .001, 11 degrees of freedom). The utility of a t-sum score as a diagnostic indicator of PET scan abnormality has been reported previously (Chen et al., 2011; Herholz et al., 2002) when using FDG-PET to calculate a summary measure of hypometabolism. A square-root transformation of the t-sum was performed as proposed by Herholz et al. (2002).
Finally, as a whole-brain measure of tau spread, we counted the number of voxels above a certain SUVR threshold for each subject in MNI space data (no PVC, cortical mask excluding basal ganglia and thalamus; see Supplementary file 1). First we examined the relationship between SUVR threshold and number of supra-threshold voxels in each group. We determined the SUVR threshold (in an SUVR range from 1 to 3, with .1 step-size) that yielded the best discrimination between Aβ- OC and MCI/AD patients by means of receiver operating characteristics (ROC) area under the curve (AUC). A threshold of 1.4 yielded the highest AUC compared to other cutoffs (see results); we therefore used percentage of voxels above an SUVR of 1.4 as a measure for subsequent analyses.
Mean SUVR in AD-vulnerable voxels
To identify regions that are particularly sensitive for measuring AD-related tracer uptake, we performed voxel-wise 2-sample t-tests between AD/MCI patients and Aβ- OC within each sample (in SPM12). Results were family-wise error (FWE) corrected at cluster-level (pcluster < .05) using an uncorrected threshold at voxel-level of pvoxel < .001. We created an AD-vulnerable binary overlap mask consisting of voxels found significant in both samples. We used this mask to derive a mean SUVR for each subject in this “AD vulnerable” ROI (in MNI space, no PVC). The AD- vulnerable mask can be downloaded from Supplementary file 2.
A priori ROI (Jack et al., 2016) and IFT mean SUVR
We also included an “a priori ROI” of AD-signature regions in our analyses that has been reported previously (Jack et al., 2016b). The a priori ROI mean SUVR was formed from a size-weighted average of uptake in entorhinal, amygdala, parahippocampal, fusiform, inferior temporal, and middle temporal ROIs (PV-corrected data).
Finally, we also determined mean SUVR in the inferior temporal gyrus (IFT), a region in the temporal lobe that shows strong AD-related tau PET signal.
Statistical analyses
Group comparisons
To test for significant group effects (i.e. group differences in demographics or tau PET measures), we ran non-parametric Kruskal-Wallis tests, followed by post-hoc Mann-Whitney U group-wise comparisons. Non-parametric tests were applied due to small group sizes, and as they do not require the data to be normally distributed. Group analyses were run in SPSS (IBM Corp., IBM SPSS Statistics, V 24, Armonk, NY, USA). We only report significant group differences at Bonferroni-corrected p-thresholds (1-tailed, alpha = .05, BACS/UCSF: 10 comparisons, ADNI: 6 comparisons).
Correlation of tau PET measures with clinical and other imaging variables
To assess and compare associations between the ten different tau PET measures and clinically relevant variables, we ran non-parametric Spearman rank correlations across all subjects within each sample (excluding BACS YC/MAC). Variables of interest comprised PiB DVR (BACS/UCSF) or Florbetapir SUVR (ADNI) as measures of Aβ, MMSE as a measure of global cognition, percentage correctly recalled words on CVLT (BACS/UCSF) or RAVLT (Rey Auditory Verbal Learning Test (Rey, 1964); ADNI) as measures of verbal memory, and hippocampal volume and entorhinal thickness as cross-sectional measures of atrophy. A shorter version of the CVLT was used for UCSF patients (recall across trials 1–4 on a list of 9 words) as compared to the standard CVLT used for BACS controls (recall across trials 1–5 on list of 16 words). For the correlational analyses with volume, we included ICV as covariate to control for head size. We report absolute values of correlation coefficients to normalize different directionality across variables. We also calculated the mean correlation coefficient across all regressions for each tau measure to assess the overall clinical relevance of that measure. Therefore, we first Fisher-transformed rho values to Z-values, averaged, and finally back-transformed Z-values to rho values. P-values were Bonferroni-corrected for multiple comparisons (1-tailed, alpha = .05, 10 comparisons).
Receiver operating characteristics and cut point determination
The major goal of this study was to compare the different tau PET measures in their ability to detect AD-related tau-PET signal. Therefore, we chose ROC analyses to evaluate the discriminative power of each measure to separate patients with MCI or probable AD from healthy elderly participants, (Metz, 1978). While all AD dementia and MCI patients included in the current study were Aβ+, to ensure that we selected controls not on the AD pathway, we restricted ROC analyses to Aβ- OC. To compare tau measures, we calculated the AUC in distinguishing MCI/AD patients from Aβ- OC within each sample (in SPSS using non-parametric estimates). Furthermore, we derived cutoffs in each data set, defined as the value that maximized accuracy (cutoffmax). Accuracy was defined as sensitivity + specificity - 1 (i.e. Youden's index). If several cutoffs yielded the same accuracy, we chose the lowest value to maximize sensitivity. We then applied the cutoffs derived in one sample to the other independent sample and report this measure of accuracy, sensitivity and specificity at cutofftest. Notably, the determination of ultimate tau PET thresholds requires a ‘gold standard’ of truth, and thus pathological examination. We run ROC analyses on both PV-corrected and uncorrected data.
Key regions contributing to abnormal tau measures
Factor analysis
We performed a factor analysis to derive the major data-defined uptake topography (i.e. factor score that explains most variance), represented by a group of brain regions that accumulate deposits in a positively or negatively correlated manner. The resulting factor score serves as summary uptake measures unbiased by assumptions of ROI or reference regions. A similar approach has been used recently by Brier et al. (2016), who applied singular value decomposition on AV-1451 data to identify unique disease-related stereotypical spatial patterns.
The particular type of factor analysis we used is called Nonparametric Sparse Factor Analysis (NSFA; Knowles and Ghahramani, 2011), which optimizes for sparsity (and hence, interpretability) of latent topographical factors, while allowing the number of factors to grow as needed. We fit the model to 89 baseline AV-1451 PET scans in the ADNI database (31 OC, 11 SMC, 19 EMCI, 19 LMCI, and 9 AD subjects). Of note, the factor analysis was run prior to the current analyses on an earlier data set of ADNI AV-1451 scans also including Aβ- MCI and AD patients to increase variability.
To convert AV-1451 scans into an input format amenable for factor analysis, we represented each scan as a vector consisting of the PV-corrected means of 40 bilateral FreeSurfer-defined brain regions. These include the 36 bilateral Braak ROIs as well as cerebral white matter, cerebellar gray matter, cerebellar white matter and brainstem (note that choroid plexus and non-cerebral tissues were not included here). Each scan vector was normalized by its l1-norm (“Manhattan norm”), and then each region value was standardized to a Z-score across all subjects. In other words, each input value represents the percentage contribution of a particular region to the total scan signal, normalized to standard deviations above the population mean. The model was fit via Gibbs sampling. Results were averaged over the last 100 samples out of 10,000, and the model converged to K=12 factors.
Comparison of spatial tau patterns between approaches
Finally we determined the key regions contributing to each measure of abnormal tau tracer uptake. For each method to quantify tau tracer uptake, which can be an a priori defined composite ROI or a binary mask derived by whole-brain analyses, we report the percentage of individual regions included in that ROI/mask. Individual regions are the 36 cortical and subcortical brain regions (bilateral) that composed the Braak stage ROIs. For supra-threshold voxels, we calculated a binary overlap mask between cohorts, which is the overlap of frequency maps thresholded at .2 (voxels with SUVR > 1.4 in more than 20% of subjects in both cohorts). For AD-vulnerable voxels we used the overlap between significant t-test maps. We then identified how much of each individual ROI (in MNI space) was covered by that binary mask. In addition, we report the factor weights for the factor score that explained most variance in AV-1451 tracer uptake. Here, regions with highest positive weights can be interpreted as regions contributing most to high global tau.
Results
Sample characteristics
Sample characteristics are summarized in Table 1. Of note, the ADNI sample (n = 70) was only half the size of BACS/UCSF (n=146), and did not include young control participants.
For both samples, age, MMSE and verbal memory differed between diagnostic groups (Kruskal-Wallis test, p < .001). There was no group difference in education in any sample (all p > .06).
In BACS/UCSF, MCI and AD patients comprised a variety of phenotypes across a broad age range (48–83 yrs). Both patient groups were significantly younger than the elderly controls (Mann–Whitney U, 2-tailed, pcorr < .02). In contrast, ADNI MCI and AD patients were older than ADNI controls; a difference that was significant for the MCI group only (pcorr = .02).
In both cohorts, AD patients performed significantly worse on the MMSE and CVLT/ RAVLT than control participants (all pcorr < .01). The same was true for MCI subjects in ADNI who had lower cognitive scores than OC (all pcorr < .01).
Approaches for quantification of tau
Braak ROI-based staging
Re-calculation of Braak ROI thresholds
The initial step involved recalculation of the previously published Braak stage classification (Schöll et al., 2016) using the original data set (5 young and 33 old controls, 15 AD patients) reprocessed as described above. To derive thresholds for each Braak composite ROI, we used a non-parametric class of regression trees to classify subjects in stages (I/II, III/IV, V/VI) with regard to clinical diagnosis, based on each subject's mean SUVR in that ROI. Proceeding from high (V/VI) to low Braak (I/II) regions, we derived cutoff SUVR values above which subjects were classified at the specific stage (all p-values < .001). Results are summarized in Table 2.
Similar to our previous results (Schöll et al., 2016), the classification approach assigned 14/15 AD patients to stage V/VI (BraakV/VI mean SUVR > 1.873), the 1 remaining AD subject and 6/33 elderly controls to stage III/IV (BraakIII/IV mean SUVR > 1.304), and 23/33 elderly controls and 2/5 young subjects to stage I/II (BraakI/II mean SUVR > 1.129). The remaining 4/33 old and 3/5 young controls were classified as stage 0. Similarly, thresholds for non PV-corrected data were derived and are as follows: 1.407, 1.232 and 1.135 for BraakV/VI, BraakIII/IV and BraakI/II mean SUVR, respectively. When using non-PV corrected data, stages differed by ± 1 for 22/146 BACS/UCSF and 10/ 70 ADNI subjects.
Validation of Braak stage ROI thresholds on independent data sets
Next we applied the new thresholds (PV-corrected) to the remaining newly acquired BACS controls (7 YC/MAC, 41 OC) as well as 12 MCI and 33 AD patients from UCSF (Table 2). Most AD subjects (n = 29/33) were assigned to stage V/VI, whereas the majority of MCI patients were classified as stage III/IV (n = 5/12), with 4 in stage V/VI and 3 in stage I/II. Only 7/41 elderly controls were assigned to stage III/IV. The majority of old controls (n = 34/41) and all YC/MAC participants were assigned to stage I/II or 0. Braak ROI specific tracer uptake for each group across the whole BACS/UCSF sample is displayed in Fig. 1A (left panel). Thresholds are illustrated as solid lines. Braak ROI uptake for early- versus late-onset ADs is further illustrated in Supplementary Fig. S1. Early-onset AD patients (age < 65 years) showed stronger uptake in BraakV/VI regions compared to late-onset patients (p = .002).
Fig. 1.
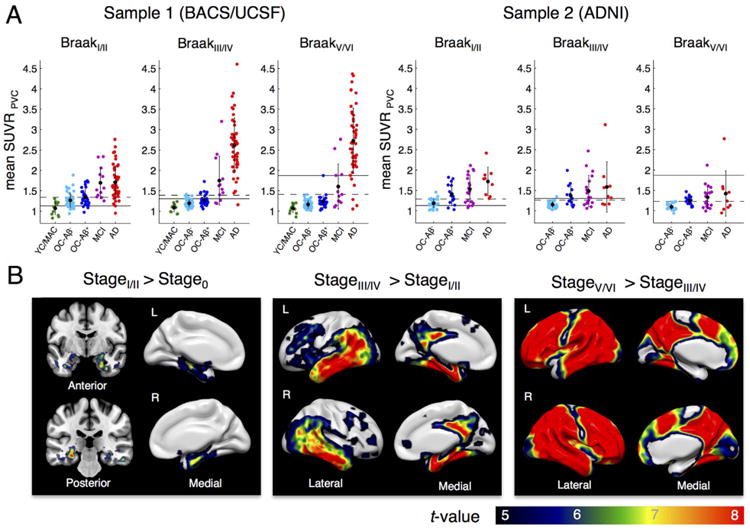
Braak ROI-based AV-1451 staging. A. Tau tracer uptake (mean SUVR, PVC, native space) for each Braak composite region of interest (ROI) by group shown for 2 samples: BACS/UCSF (left) and ADNI participants (right). Black dots display mean values, error bars denote SD. An initial subgroup of BACS/UCSF was used to derive Braak ROI thresholds to classify young controls (YC, N = 5), old controls (OC, N = 33) and AD patients (N = 15). The 4-stage classification proceeds from late to early Braak ROIs with subjects > SUVR threshold being assigned to the specific stage (thresholds: BraakV/VI > 1.87, BraakIII/IV > 1.30, BraakI/II > 1.13, Braak0 ≤ 1.13, see text for non-PVC thresholds). Thresholds for Braak classification are shown as solid lines. Cut points to discriminate patients from Aβ+ controls by an individual Braak ROI mean SUVR (Table 3) are shown as dashed lines. B. Voxel-wise 2-sample t-tests between subjects assigned to different stages (no PVC, MNI space) reveal a “spread” of tau from medial temporal lobe/hippocampus (stage I/II) to other temporal regions, posterior cingulate/retrosplenial cortex, parietal &frontal regions (stage III/IV), and finally higher neocortical regions (stage V/VI). Samples were merged for t-tests to reach adequate group sizes. Results are FWE corrected at voxel level (pvoxel < .05, k > 100). MAC = middle-aged controls.
In a next step we used the Braak ROI thresholds to categorize ADNI subjects (Table 2 and Fig. 1A; right panel). ADNI AD patients had overall lower BraakV/VI ROI uptake than UCSF patients. Only 1/9 AD and 1/19 MCI patients exceeded the threshold for stage V/VI. Most MCI (n = 10/19) and AD patients (n = 5/9) were assigned to stage III/ IV, the remaining patients to stage I/II (5/19 MCIs, 3/9 ADs) or stage 0 (3/19 MCIs). From all 43 ADNI elderly controls, 8 were classified as III/IV, whereas the majority (n = 25/43) were categorized as stage I/II. The remaining 9/43 OC were classified as stage 0.
Across both samples, 70% of Aβ- OC were categorized as stage I/II and only 6% as stage III/IV, while in Aβ+ OC the proportion for stage III/IV was much higher with 36%. No elderly normal subject exceeded the threshold for stage V/VI. Regarding MCI subjects, 48% fell into the III/IV category and 16% exceeded the threshold for stage V/VI. Out of all AD patients, 77% were assigned to stage V/VI, 16% to stage III/IV and only 7% stage I/II. The percentage of subjects assigned to specific stage is illustrated for each group in Supplementary Fig. S2.
Voxel-wise comparisons between Braak ROI stages
In a next step we wanted to verify the regions accounting for the difference in Braak ROI-specific AV-1451 uptake and thus assignment to different stages. We performed voxel-wise 2-sample t-tests between participants assigned to contiguous stages (using the MNI-warped SUVR images, no PVC), merging both samples to increase sample size. Results are illustrated in Fig. 1B. Stage I/II participants (n = 89) showed significantly more tau tracer uptake in hippocampus and adjacent parahippocampal regions (mostly anterior) than stage 0 participants (n = 33). Voxel-wise t-tests between stage III/IV (n = 45) and I/II subjects revealed elevated uptake in medial temporal lobe, inferior temporal cortex, retrosplenial/ posterior cingulate cortex, parietal and frontal regions. Stage III/IV is of particular interest since it might be considered as the transitional stage towards AD. We additionally examined tracer uptake patterns separately patients (MCI/AD, n = 24) and controls (n = 21) in stage III/IV (see Supplementary Fig. S3). Regions showing elevated tracer retention (relative to stage I/II controls) in cognitively normal subjects staged III/IV were remarkably similar to those seen in AD/MCI patients, but with weaker tracer uptake. In both t-tests, strongest difference was seen in amygdala/entorhinal cortex at the border towards the hippocampal head. Finally, voxel-wise comparisons between participants classified as stage V/VI (n = 49) and those classified III/IV showed elevated tracer uptake across the whole brain, only sparing primary visual and motor regions.
Mean SUVR in Braak stage composite ROIs
Across all Braak stage ROIs and within both samples, mean SUVR (PV-corrected) differed by group (Kruskal-Wallis test, all p < .01). As expected, mean SUVRs increased by diagnostic group (YC/MAC < OCAβ- < OC-Aβ+ < MCI < AD).
In the BACS/UCSF sample, tracer uptake in BraakI/II ROIs was different between all groups except for MCI vs. AD patients (pcorr > .2). Mean SUVRs in BraakIII-IV ROIs significantly differed between all groups. For the BraakV/VI composite ROI there was no significant difference between YC/MAC and Aβ- OC or between Aβ+ OC and MCI patients (pcorr > .1) but differed between all other groups.
For the ADNI cohort, mean tracer retention was significantly lower for Aβ- OC than Aβ+ OC and MCI patients in all Braak composite regions. The difference between Aβ- OC and AD patients was only significant for BraakI/II and BraakIII/IV ROIs. Aβ+ OC, MCIs and ADs did not significantly differ in any Braak stage composite region (all pcorr > .09).
Whole-brain measures of tracer uptake
The global mean SUVRs derived from a weighted average across all Braak regions (excluding basal ganglia and thalamus) after PVC are displayed as individual data and group-specific mean values in Fig. 2A (BACS/UCSF on left, ADNI on right). In BACS/UCSF, global mean SUVRs were significantly different between all groups except for YC/ MAC and Aβ- OC (pcorr = .17). In ADNI, Aβ- OC were lower than Aβ+ OC and MCIs but not lower than ADs (pcorr = .07). Aβ+ OC, MCIs and ADs did not significantly differ (all pcorr > .2). UCSF AD patients had on average nearly twice as much global tracer uptake as ADNI AD patients.
Fig. 2.
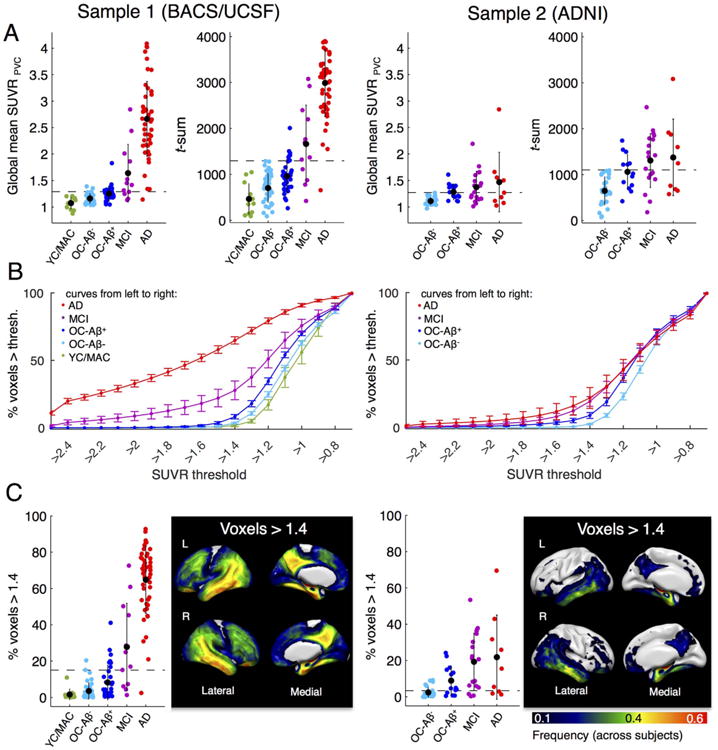
Whole-brain AV-1451 uptake measures by group. Left panel: BACS/UCSF participants. Right panel: ADNI participants. We examined three global tau PET measures. Cut points that best discriminate patients from Aβ- controls are displayed as dashed lines. A. Global mean SUVR (ROI-based, PVC) and sum of t-values across abnormal voxels relative to the young/middle-aged controls (MNI space, no PVC). Black dots are group means. Error bars denote SD. B. Percentage of voxels above an SUVR threshold (in MNI space, no PVC). An explicit mask excluding basal ganglia and thalamus was used. Note that the step-sizes are larger in the tails of the plotted graph. Error bars denote SEM. A threshold of 1.4 revealed best performance to discriminate AD/MCI patients from Aβ- controls. C. Scatterplot of subject data and frequency map that shows the location of voxels > 1.4 (frequency across all subjects).
Next, the sum of t-values across abnormal voxels for each group is shown in Fig. 2A. For BACS/UCSF, t-sum scores were not significantly different between YC/MAC and Aβ- OC (pcorr = .16) but differed between all other groups. Within the ADNI cohort, Aβ- OC had lower t-sum scores than all other groups, whereas Aβ+ OC, MCIs and ADs did not differ (all pcorr > .2).
Finally, we measured the spatial extent of elevated tracer uptake by counting the number of supra-threshold voxels. A threshold of 1.4 yielded the highest AUC compared to other cutoffs (see Methods and Fig. 2B). Individual subject data and average values by diagnostic groups are shown in Fig. 2C. In BACS, YC/MAC had on average only 2% of supra-threshold voxels, whereas in Aβ- OC 4% and in Aβ+ OC 8% of voxels exceeded an SUVR of 1.4. In UCSF, MCI patients had 28% and AD subjects 65% of voxels above 1.4. The percentage of supra-threshold voxels was not significantly different between YC/MAC vs. Aβ- OC (pcorr > .2), but differed between all other groups. In the ADNI sample, Aβ- OC had significantly lower percentage of supra-threshold voxels (2%) than all other groups. There was no significant difference between Aβ+ OC (9%), MCIs (19%) and ADs (22%) (all pcorr > .16). The location of voxels above 1.4 is displayed in Fig. 2C as frequency map for each cohort (frequency across subjects). These maps indicate that the most frequent location of supra-threshold voxels is similar to distribution of elevated tracer uptake seen in subjects at stage III/IV (Fig. 1B).
Mean SUVR in AD vulnerable voxels
To identify regions that show high tau tracer retention related to AD, we performed 2-sample t-tests between AD/MCI patients (all Aβ+) vs. Aβ- elderly controls. Results are illustrated in Fig. 3A (FWE-corrected at cluster-level; pcluster < .05, pvoxel < .001). While UCSF AD patients showed higher tau tracer uptake than controls across most brain regions, ADNI patients had higher tracer uptake than controls in a more limited set of regions, including medial temporal and inferior temporal regions, retro-splenial/posterior cingulate, parietal and frontal cortex (peak in amygdala). However, regions showing strongest difference between patients and controls were remarkably similar across cohorts (also note that the ADNI sample is much smaller). The overlap between significant t-maps across both samples was used to create an “AD-vulnerable mask”, from which we calculated mean SUVR values for each group (see Fig. 3B and Supplementary file 2 for download). This mask should be highly sensitive to AD-related tau accumulation and yield good tau PET-based discrimination between AD/MCI patients and controls. In BACS/UCSF, mean SUVRs in the AD-mask were not different between Aβ- vs. Aβ+ OC (pcorr = .16) or Aβ+ OC vs. MCI subjects (pcorr = .06), but differed between all other groups. For ADNI, Aβ- OC had significantly lower uptake than all other groups, whereas Aβ+ OC, MCIs and ADs did not significantly differ (all pcorr > .2).
A priori ROI (Jack et al., 2016) and IFT ROI mean SUVR
We also calculated mean SUVR in an a priori defined ROI that combined a set of AD-signature regions (Jack et al., 2016b) as well as the IFT as one key region that shows elevated tau PET signal in AD. Individual data and group-specific mean values for the PV-corrected data are displayed in Fig. 3C. In BACS/UCSF, mean uptake in the a priori ROI as well as IFT was significantly different between all groups. For ADNI, Aβ- OC subjects had lower values than the other groups in both ROIs, whereas Aβ+ OC, MCI and AD patients did not differ (all pcorr > .2).
Determination and validation of cut-points
We compared the different approaches for tau quantification in their diagnostic ability to distinguish Aβ- elderly control subjects from AD/MCI patients by means of ROC analyses. Cut points for abnormal tau were derived in each sample as the value that maximized accuracy (i.e. sensitivity and specificity) measured as Youden index. For all tau measures, cutoff values are displayed as dashed lines in Figs. 1–3. For ROI-based measures we calculated thresholds using both PV-corrected SUVR data (Table 3, left column) and non-PV corrected data (Table 3, right column).
Table 3.
ROC-derived cut points for all tau PET measures.
| PV-corrected data | Non PV-corrected data | |||||||
|---|---|---|---|---|---|---|---|---|
|
|
|
|||||||
| AUC [95%CI] | Cutoffmax | Acc./sens./spec. at cutoffmax |
Acc./sens./spec. at cutofftest |
AUC [95%CI] | Cutoffmax | Acc./sens./spec. at cutoffmax |
Acc./sens./spec. at cutofftest |
|
| Braak ROI-based stages | ||||||||
| Sample 1 (BACS/UCSF) | – | > StageI/II | 86/93/93 | 86/93/93 | % | > StageI/II | 80/95/85 | 80/95/85 |
| Sample 2 (ADNI) | – | > StageI/II | 57/61/96 | 57/61/96 | % | > StageI/II | 50/54/96 | 50/54/96 |
| BraakI/II ROI SUVR | ||||||||
| Sample 1 (BACS/UCSF) | .88 [.81, .95] | 1.34 | 68/85/83 | 66/83/83 | .92 [.88, .98] | 1.35 | 75/85/90 | 64/88/76 |
| Sample 2 (ADNI) | .85 [.75, .96] | 1.29 | 64/75/89 | 64/68/96 | .80 [.68, .93] | 1.31 | 68/68/100 | 57/57/100 |
| BraakIII/IV ROI SUVR | ||||||||
| Sample 1 (BACS/UCSF) | .97 [.94, 1] | 1.39 | 93/93/100 | 78/95/83 | .96 [.92, 1] | 1.28 | 92/92/100 | 89/92/98 |
| Sample 2 (ADNI) | .84 [.73, .94] | 1.26 | 57/64/93 | 46/46/100 | .78 [.66, .91] | 1.25 | 54/54/100 | 54/54/100 |
| BraakV/VI ROI SUVR | ||||||||
| Sample 1 (BACS/UCSF) | .95 [.90, .99] | 1.41 | 85/85/100 | 75/92/83 | .94 [.89, .99] | 1.25 | 87/87/100 | 74/93/80 |
| Sample 2 (ADNI) | .77 [.65, .90] | 1.23 | 54/54/100 | 43/43/100 | .76 [.62, .89] | 1.15 | 57/57/100 | 36/36/100 |
| Global SUVR | ||||||||
| Sample 1 (BACS/UCSF) | .97 [.94, 1] | 1.29 | 88/93/95 | 81/93/88 | .95 [.90, 1] | 1.22 | 88/90/98 | 82/92/90 |
| Sample 2 (ADNI) | .80 [.68, .92] | 1.27 | 54/54/100 | 50/50/100 | .77 [.64, .89] | 1.18 | 54/54/100 | 50/50/100 |
| % voxels > SUVR 1.4 (MNI) | ||||||||
| Sample 1 (BACS/UCSF) | – | – | – | – | .97 [.95, 1] | 15 | 89/92/98 | 70/97/73 |
| Sample 2 (ADNI) | – | – | – | – | .86 [.76, 96] | 4 | 61/79/82 | 54/54/100 |
| Voxel-wise t-sum (MNI) | ||||||||
| Sample 1 (BACS/UCSF) | – | – | – | – | .96 [.93, 1] | 1295 | 92/92/100 | 84/93/90 |
| Sample 2 (ADNI) | – | – | – | – | .82 [.70, .93] | 1109 | 57/57/100 | 54/54/100 |
| AD-mask SUVR (MNI) | ||||||||
| Sample 1 (BACS/UCSF) | – | – | – | – | .95 [.91, 1] | 1.37 | 88/90/98 | 75/92/83 |
| Sample 2 (ADNI) | – | – | – | – | .84 [.73, 95] | 1.29 | 68/68/100 | 50/50/100 |
| A priori ROI SUVR | ||||||||
| Sample 1 (BACS/UCSF) | .98 [.97, 1] | 1.47 | 93/93/100 | 84/93/90 | .98 [.95, 1] | 1.27 | 97/97/100 | 84/93/90 |
| Sample 2 (ADNI) | .87 [.78, .96] | 1.34 | 64/68/96 | 50/50/100 | .84 [.73, .95] | 1.20 | 64/86/79 | 57/61/96 |
| IFT ROI SUVR | ||||||||
| Sample 1 (BACS/UCSF) | .99 [.97, 1] | 1.46 | 95/95/100 | 87/97/90 | .99 [.97, 1] | 1.30 | 95/95/100 | 77/97/80 |
| Sample 2 (ADNI) | .82 [.70, .93] | 1.40 | 54/64/89 | 46/57/89 | .82 [.70, .94] | 1.23 | 61/79/82 | 54/57/96 |
The case/control discrimination cut point “cutoffmax” for separating MCIs/ADs from Aβ- old controls was obtained by identifying the point of maximum accuracy (accmax, using Youden's index). A value above the cut point is considered abnormal. We tested cut points derived in one sample in the other sample (cutofftest). BACS/UCSF: nAD/MCI = 60; nOC-Aβ- = 41; ADNI: nAD/MCI = 28; nOC-Aβ- = 28. All ROI-based analyses were performed in subject space (PVC data left, non PVC data right). All voxel-wise analyses were performed in MNI space (no PVC). AUC = area under the curve.
Discriminative power (AUC) for the different tau PET measures was excellent in BACS/UCSF and ranged from .88 to .99. AUC was overall lower for ADNI with values between .76 and .87. Cutoff values that maximized accuracy (cutoffmax) were similar across samples and generally slightly lower for the ADNI sample.
In BACS/UCSF, global measures (e.g. global mean SUVR or percentage of supra-threshold voxels) performed equally well as regional measures (e.g. a priori ROI or BraakIII/IV SUVR) with AUCs ≥ .97. The IFT regional mean SUVR yielded highest AUC with .99 for both PV-corrected and non-corrected data.
For ADNI, AUC was highest for the mean SUVR in the a priori ROI (PV-corrected; AUC = .87), but percentage of supra-threshold voxels as a global measure performed similarly well (AUC = .86).
We also applied cut points that maximized accuracy in one sample to the opposite (independent) sample and examined accuracy, sensitivity and specificity at cutofftest. When thresholds were derived in BACS/UCSF and applied to ADNI, re-test accuracy was between 64% (BraakI/II ROI mean SUVR; PV-corrected) and 36% (BraakV/VI ROI; no PVC). Applying cut points derived in ADNI to BACS/UCSF yielded better overall accuracy, which was highest for the BraakIII/IV ROI (no PVC) with 89% and lowest for BraakI/II ROI (no PVC) with 64%.
Correlation of tau PET measures with cognition, Aβ and structural measures
A tile plot for each sample displaying absolute Spearman correlation coefficients is shown in Fig. 4. In both cohorts all tau PET measures were significantly positively related to Aβ (all pcorr < .001; all rho > .6). The relationship was strongest for the Braak ROI-based stage (rho = .79) in BACS/UCSF and the a priori ROI mean SUVR in ADNI (rho = .73). Regarding global cognition, increasing tau PET scores were significantly related to decreasing MMSE across all approaches and both samples. The strongest correlation was found with Braak stage and IFT mean SUVR in BACS/UCSF (both rho = −.71) and BraakI/II mean SUVR in ADNI (rho = −.54). Verbal recall performance showed weaker but more specific associations with tau measures, especially in ADNI. In BACS/UCSF participants, all tau measures were significantly related to verbal recall (all pcorr < .001) with the highest correlation for Braak stage, a priori ROI mean SUVR, and BraakIII/IV ROI mean SUVR (all rho = −.39). In the ADNI sample, only BraakI/II ROI (entorhinal/hippocampal) tracer uptake showed a significant relationship to RAVLT performance (rho = -.40, pcorr = .004). Lowest correlations with verbal memory were found with BraakV/VI mean SUVR in both samples (rhoBACS/UCSF = .33 and rhoADNI = .12). Finally, bilateral hippocampal volume and entorhinal thickness were most strongly related to tau in the same regions, i.e. BraakI/II ROIs in both cohorts (hippocampal volume: rhoBACS = −.37, rhoADNI = −.51; entorhinal thickness: rhoBACS = −.52, rhoADNI= −.53; all pcorr < .001).
Fig. 4.
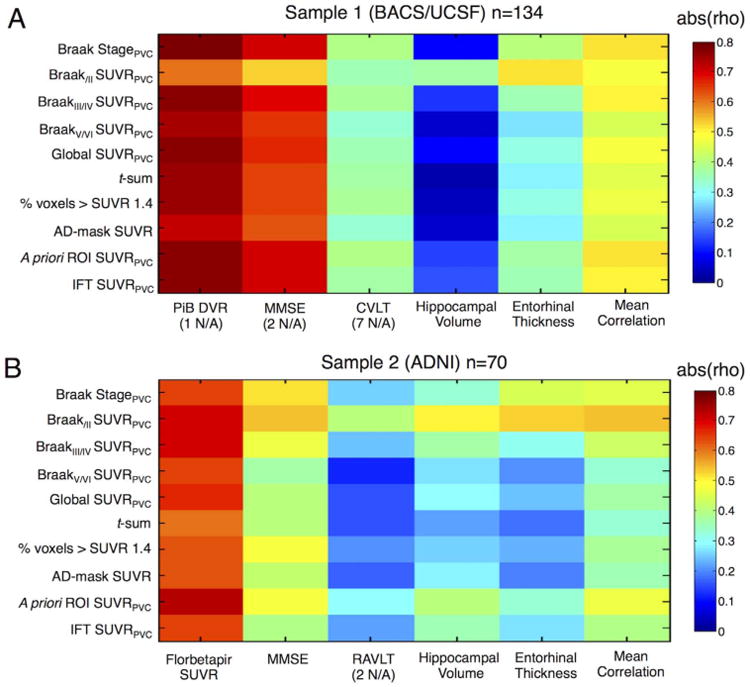
Relationship between tau PET measures and amyloid, cognition and volume. Tile plots show absolute correlation coefficients (rho) of Spearman rank correlations between tau PET measures and amyloid PET, Mini-Mental State Examination (MMSE), verbal episodic memory, bilateral hippocampal volume, entorhinal thickness and the mean correlation across columns. Correlations were calculated across old controls, MCI and AD patients within each sample. A. BACS/UCSF subjects. B. ADNI participants. Verbal recall was measured as percentage of correctly recalled words in the California Verbal Learning Test (CVLT) or Rey Auditory Verbal Learning Test (RAVLT).
We also computed the mean correlation coefficient for each tau PET measure as an index of overall clinical significance. In BACS/ UCSF, mean correlation coefficients were above .44 for all tau measures with the strongest mean correlation found for Braak ROI-based stage (rho = .52) and regional uptake in the a priori-ROI (rho = .52) with very similar values for IFT (rho = .51) and BraakIII/IV ROIs (rho = .50). In ADNI, BraakI/II ROI mean SUVR showed strongest average correlation with imaging and cognitive measures (rho = .55), followed by a priori ROI mean SUVR (rho = .47) and Braak stage (rho = .45; all other rho values < .44).
Effects of partial volume correction
While all voxel-wise measures of tracer uptake that required warping to MNI space are not corrected for PV effects, we applied PVC in subject-space to derive ROI-based SUVRs. We applied PVC to account for AV-1451 off-target binding in choroid plexus close to the hippocampus, basal ganglia, and non-cerebral tissues (all related to age) as well as to account for atrophy effects.
When we examined correlations between non PV-corrected SUVRs and cognition, Aβ and structural measures, correlations were weaker but the overall pattern of results was consistent. When comparing accuracies for separating MCIs/ADs from Aβ- old controls between PV-and non PV-corrected data, AUC values were similar (Table 3). Cutpoints for the non PV-corrected data were overall slightly lower by ∼.1 SUVR units, except for the BraakI/II composite ROI.
Key regions contributing to abnormal tau measures
Finally we examined the key spatial pattern of in vivo tau pathology. We ran a factor analysis on PV-corrected ROI data as a data-driven approach to identify the major regions contributing to high global tau signal. Since many ROIs were highly correlated with each other, they might be more concisely summarized as topographies. We only report the factor that explained most variance (81%) and that might be interpreted as global tau. Factor weights for all individual Braak stage ROIs are displayed in Table 4 sorted from low to high Braak stage. In addition, positive factor weights are illustrated as a heat map in Fig. 5. Regions with strongest positive factor weights comprised inferior parietal, middle and inferior temporal, and middle frontal cortex. Basal ganglia, and thalamus, regions that typically show off-target binding, had highest negative factor weights (not shown). Furthermore, cerebellum, brain stem and cerebral white matter, regions that usually show no tracer uptake, also had negative factor loadings.
Table 4.
Individual regions contributing to different tau measures.
| Region | BraakIII/IV ROI | Voxel > 1.4 (binary mask) | AD Mask | A priori ROI | Factor Score Weights |
|---|---|---|---|---|---|
| Entorhinal | 0 | 54 | 68 | 100 | 38 |
|
| |||||
| Hippocampus | 0 | 66 | 31 | 0 | −5 |
|
| |||||
| Parahippocampal | 100 | 45 | 67 | 100 | 43 |
| Fusiform | 100 | 65 | 68 | 100 | 54 |
| Lingual | 100 | 6 | 19 | 0 | −42 |
| Amygdala | 100 | 90 | 85 | 100 | 34 |
|
| |||||
| Middle temporal | 100 | 37 | 41 | 100 | 76 |
| Thalamus | 0 | 0 | 0 | 0 | −85 |
| Caudal anterior cingulate | 100 | 0 | 0 | 0 | −9 |
| Rostral anterior cingulate | 100 | 2 | 9 | 0 | −14 |
| Posterior cingulate | 100 | 9 | 35 | 0 | 42 |
| Isthmus cingulate | 100 | 24 | 57 | 0 | 48 |
| Insula | 100 | 11 | 7 | 0 | −8 |
| Inferior temporal | 100 | 66 | 58 | 100 | 75 |
| Temporal pole | 100 | 15 | 14 | 0 | −6 |
|
| |||||
| Superior frontal | 0 | 4 | 13 | 0 | 33 |
| Orbitofrontal | 0 | 34 | 19 | 0 | −10 |
| Middle frontal | 0 | 4 | 16 | 0 | 60 |
| Inferior frontal | 0 | 7 | 6 | 0 | 7 |
| Caudate | 0 | 0 | 0 | 0 | −78 |
| Putamen | 0 | 0 | 27 | 0 | −75 |
| Lateral occipital | 0 | 20 | 22 | 0 | 32 |
| Parietal supramarginal | 0 | 10 | 15 | 0 | 66 |
| Inferior parietal | 0 | 28 | 33 | 0 | 76 |
| Superior temporal | 0 | 8 | 11 | 0 | 15 |
| Pallidum | 0 | 0 | 1 | 0 | −68 |
| Superior parietal | 0 | 6 | 28 | 0 | 50 |
| Precuneus | 0 | 11 | 57 | 0 | 28 |
| Banks of the STS | 0 | 63 | 82 | 0 | 55 |
| Accumbens | 0 | 0 | 20 | 0 | −19 |
| Transverse temporal | 0 | 0 | 0 | 0 | −53 |
|
| |||||
| Pericalcarine | 0 | 0 | 1 | 0 | −47 |
| Postcentral | 0 | 0 | 1 | 0 | −15 |
| Cuneus | 0 | 0 | 17 | 0 | −41 |
| Precentral | 0 | 0 | 7 | 0 | −14 |
| Paracentral | 0 | 0 | 4 | 0 | −36 |
Percentage of each region included in a specific mask (sensitive for measuring “abnormal” tau). Regions are sorted by Braak stage (low to high) and stages separated by a line. Bold indicates values > 50%. To identify regions that show high tracer uptake (SUVR > 1.4) across both samples, we created an overlap mask between frequency maps. The AD-mask is the overlap of significant t-test results (AD/MCI > Aβ- old controls) between both samples. Factor score weights are shown for the factor explaining most variance derived from a factor analysis on ADNI SUVR data. STS=superior temporal sulcus.
Fig. 5.
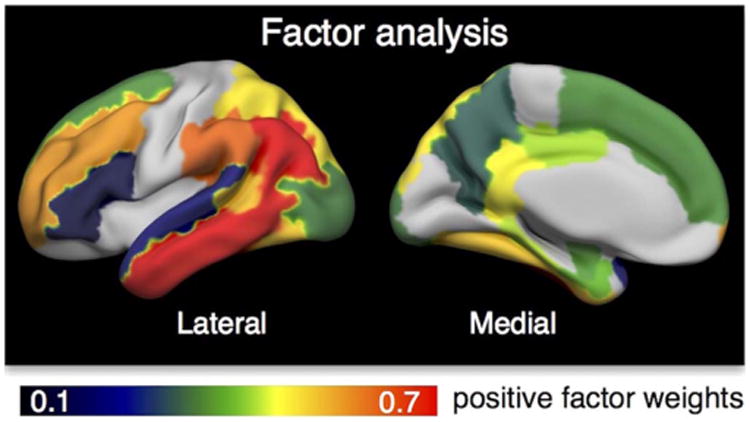
Key regions identified by factor analysis. We performed a factor analysis to determine the regions that mainly contributed to high global tau signal using a sample of elderly controls, MCI and AD patients from ADNI. Only positive weights for the factor that explained most of the variance are illustrated.
In addition to the factor analysis, we calculated the percentage of each individual region included in a specific tau measure (e.g. a composite ROI or binary mask; see Table 4). Regions of which more than 50% were covered by a mask/composite ROI are highlighted in bold in Table 4. Key regions contributing to all approaches included mainly Braak stage III ROIs, i.e. amygdala, parahippocampal and fusiform cortex, as well as entorhinal cortex (Braak stage I) and inferior/middle temporal gyri (Braak stage IV). Another region that frequently showed supra-threshold voxels, high vulnerability to AD and that received a high positive weight in the factor analysis was the banks of the superior temporal sulcus (Braak stage V). Other regions that strongly contributed to the AD-vulnerable mask were isthmus cingulate (retrosplenial cortex) and precuneus. Parietal and frontal regions received high factor weights in the factor analysis, and also partially contributed to the AD-vulnerable mask and to supra-threshold voxels.
Discussion
In the current study we evaluated multiple approaches for in vivo quantification and staging of tau pathology measured by AV-1451 PET. In two independent cohorts of cognitively normal and impaired subjects we examined the quantity of tau tracer retention and its location. Braak region-based staging, whole-brain and regional tau measures all showed similar diagnostic accuracies when distinguishing MCI and AD patients from Aβ- cognitively normal elderly subjects (Table 3). Across the different approaches, key regions vulnerable to tau accumulation included entorhinal, parahippocampal, fusiform, amygdala, inferior/middle temporal, retrosplenial cortex, inferior parietal cortex, precuneus and banks of the superior temporal sulcus (Table 4). Our data suggest that global measures can capture tau PET signal in those brain regions and might be eligible biomarkers for classifying tau PET scans as abnormal. However, while all tau measures were related to Aβ and global cognition, whole-brain measures showed weak associations with memory and medial temporal lobe atrophy measures (Fig. 4). Medial temporal lobe structures are affected early in the neurodegenerative process and previous imaging studies suggest that entorhinal thickness and hippocampal volume are sensitive markers of early AD (e.g. Desikan et al., 2009; Jack et al., 1997). Thus it appears that while a more global approach performs well for staging and classification, regional tau measures are more sensitive to early neurodegeneration and memory decline.
There is emerging evidence from recent tau PET studies that regional tau deposition is closely linked to structural and functional deterioration in aging and AD (e.g. Ossenkoppele et al., 2016; Saint-Aubert et al., 2016; Sepulcre et al., 2016). Consistent with our findings, Cho et al. (2016) reported strongest correlations between memory scores and medial temporal tau, whereas global cognition was associated with tau in wide regions of the cortex across MCI and AD patients. Similar findings have been seen in cognitively normal adults and AD patients (Ossenkoppele et al., 2016; Schöll et al., 2016; but see also Brier et al., 2016 for opposite pattern of results). Furthermore, several tau PET studies have shown a close relationship between patterns of tau deposition and atrophy measures (Cho et al., 2016b; Sepulcre et al., 2016; Wang et al., 2016). Sepulcre et al. (2016) reported strongest local-to-local associations between in vivo tau accumulation and gray matter intensities in the anterior medial temporal lobe. Similarly our data revealed strongest correlations of hippocampal volume and entorhinal thickness with tau tracer uptake in BraakI/II ROIs across both samples and further supports that tau deposition closely mirrors neurodegeneration and functional decline.
To assess reliability of tau PET biomarkers we ran all analyses in two independent cohorts. Although most tau PET measures yielded similar discrimination based on AUC within each sample, accuracies were overall lower in ADNI compared to BACS/UCSF. Samples differed in demographic and clinical characteristics for both patients and controls. The ADNI sample was much smaller than BACS/UCSF, and in contrast to UCSF patients the majority of ADNI patients were only mildly cognitively impaired. While all ADNI patients were amnestic and mostly above 70 years of age, UCSF patients comprised a variety of AD clinical phenotypes of mostly early age-of-onset. Furthermore, almost 70% of ADNI AD patients were carriers of the APOE ∊;4 allele, whereas the proportion in UCSF AD patients was lower at around 50%. ADNI AD patients had relatively low neocortical tracer uptake (Fig. 1A; right), and voxel-wise as well as ROI-based analyses revealed highest tracer uptake in the medial temporal lobe extending to inferior temporal and posterior cingulate/retrosplenial cortex (Fig. 3A; right). In contrast, UCSF AD patients had prominent neocortical uptake across wide regions of the brain (Fig. 3A; left). Within UCSF AD patients, early-onset patients showed higher neocortical uptake (Supplementary Fig. S1). Together these findings are in line with previous observations by Ossenkoppele et al. (2016); overlapping data set) that greater AV-1451 uptake in neocortical regions is associated with younger age-of-onset and non-amnestic clinical presentations of AD patients, while greater medial temporal lobe vulnerability is seen in older patients with amnestic symptoms and carriers of the APOE ∊;4 allele. The different characteristics of AD patients are the likely explanation for the lower accuracies in ADNI compared with BACS/ UCSF.
ADNI control participants were younger than BACS subjects. Aβ+ controls in ADNI had similarly high tau measures as ADNI AD and MCI patients, and 50% of ADNI Aβ+ OC were classified as stage III/IV compared to only 30% of BACS Aβ+ elderly control participants. Although Aβ+ OC in BACS had on average higher tracer uptake than Aβ- OC, there was a large range of tau PET values within and overlap between both groups. One explanation for the relatively low tau values seen in some Aβ+ BACS participants could be differing Aβ positivity thresholds for PiB vs. Florbetapir. The cutoff for Aβ positivity applied to BACS (PiB DVR > 1.065), which is based on previous results from our lab (Mormino et al., 2012; Villeneuve et al., 2015), was lower compared to the cutoff used in ADNI (Florbetapir DVR > 1.1) as suggested by a comparative radiotracer study (Landau et al., 2013). This may have resulted in categorizing some BACS OC as Aβ+ at an earlier stage of Aβ accumulation compared to ADNI. On the other hand, the older age of BACS controls might partially explain the high medial temporal uptake in some Aβ- BACS participants (Crary et al., 2014; Schöll et al., 2016). Regardless of the exact reason, it seems that the two cohorts were different in two important ways: the ADNI cohort AD patients had less neocortical tau than the UCSF AD patients, and the ADNI Ap+ OC had more neocortical tau accumulation than BACS Ap+ OC. These cohort differences likely drive the different sensitivity, specificity, and accuracy of the varying thresholds we tested. Despite these differences, cutoffs were remarkably similar across cohorts.
It is worth noting that, while these cohort differences are important for the ultimate deployment of thresholds and for understanding the biology of the AD pathway, they are not crucial to the conclusions of this study. Our primary aim in comparing the performance of different metrics was not to “diagnose” AD, but rather to see how the different metrics perform in different situations. Thus, we chose a simple discrimination – separating Aβ- controls from Aβ+ patients – and uniformly compared the metrics. We compared the diagnostic performance of these different measures as an indication of the test characteristics; we do not propose that these results indicate diagnostic accuracy. More work with larger samples and validation with neuropathological data will be needed for this.
Only recently has tau PET been incorporated into a proposed biomarker classification system (Jack et al., 2016a). Classification of individuals as tau ‘positive’ or ‘negative’ is relevant for clinical diagnosis, for inclusion of subjects in therapeutic trials, or for studies on normal aging, and the optimal cutoff depends on the context of use. Two previous studies that investigated cut points for AV-1451 tau PET imaging (Jack et al., 2016b; Wang et al., 2016) used a similar a priori defined AD-signature ROI to derive SUVR values for classification of subjects. Wang et al. determined an SUVR of 1.19 (applying PVC) and Jack et al. an SUVR of 1.32 (without PVC) as optimal cut points to separate Aβ+ AD patients from Aβ- elderly controls. Using the same a priori ROI as Jack and colleagues, we derived an SUVR cut point of ∼1.4 with PVC and an SUVR of ∼1.2 without PVC. Interestingly, most of our approaches converged on a critical cutoff SUVR between 1.2–1.5, suggesting that values above that range might be considered as pathological. Similarly, the percentage of voxels above 1.4 (non-PV corrected) yielded good diagnostic accuracy in both cohorts and was correlated with clinical measures. Applying PVC to the data overall increased cut points (by ∼.1 SUVR units), a factor that has to be taken into account when cutoffs are applied. We chose to apply PVC because AV-1451 shows strong age-related off-target binding to basal ganglia and choroid plexus as well as binding to skull, meninges and tissue bleeding into neighbored cortical regions (see Baker et al., submitted for publication). However, PVC can also introduce errors which differ according to the correction method employed. We feel that partial volume corrected results should be compared with uncorrected results to evaluate introduction of errors. In our results, accuracies for staging of patients and controls were very similar for non-PVC and PVC data, suggesting that effects of PVC might be small at the group level. However, because off-target binding varies considerably across subjects and is related to age, it might strongly affect the data at the individual level. In addition to the choice of PVC, other factors such as reference region, smoothing filter or normalization to a standard space will impact the exact cut point, and so far no standard processing method for AV-1451 exists. Thus, at this point, thresholds for positivity are likely to be laboratory-dependent.
Our data suggest that whole-brain tau PET measures might be adequate biomarkers to detect AD-related tau pathology with high specificity, since AD patients usually show tau accumulation in wide areas of the neocortex (Braak stages IV-VI). Regional tau PET measures covering AD vulnerable regions might be more sensitive to detection of early tau pathology, which can be important for therapeutic intervention in clinical trials of preclinical AD or for studies of normal aging. However, a single value and binary classification scheme cannot cover the full spectrum of disease progression. Recent in vivo data (Cho et al., 2016a; Schöll et al., 2016; Schwarz et al., 2016) recapitulated the known ex vivo pattern of hierarchical tau spread described by Braak and Braak (1991). Thus, a topographical tau PET staging system might better track the gradual expansion of tau accumulation than a binary classification system. We assessed the feasibility of Braak ROI-based tau PET staging in two independent cohorts. Our 4-stage system assigned most young/middle-aged adults to stage 0, most healthy elderly subjects to stage I/II, most MCI patients to stage III/IV and most AD patients to stage V/VI (see Supplementary Fig. S2). Increasing Braak stage was related to increasing Aβ and worse cognition and tracer uptake in early Braak regions was related to early structural and cognitive markers of AD, which further supports the concept that the Braak staging system tracks disease progression. An alternative, similar staging system (MeTeR-scale), which uses a mesial temporal, temporoparietal and neocortical composite ROIs has been proposed by Villemagne and colleagues (Villemagne et al., 2016).
The transition from normal aging to preclinical AD is characterized by an increase of tau tangles within and spread out of the medial temporal lobe to limbic areas (Braak stage III-IV; see e.g. Petersen et al., 2006). Consistent with neuropathological data, more than 40% of MCI patients included in our study were categorized as Braak ROI-based stage III/IV (Knopman et al., 2003). Of all cognitively normal controls, 21% exceeded the threshold for stage III/IV, which is also congruent with neuropathological findings (Braak and Braak, 1997; Knopman et al., 2003). Notably, the topography of in vivo tau accumulation was remarkably similar between cognitively normal elderly subjects and impaired subjects assigned to stage III/IV, and was characterized by elevated tracer retention in the temporal lobe, posterior cingulate/retrosplenial cortex, and parietal cortex/precuneus (Supplementary Fig. S3). The same regions have been identified by other studies as being vulnerable to tau accumulation in aging and AD (Brier et al., 2016; Cho et al., 2016a; Delacourte et al., 1999; Schwarz et al., 2016), and to related functional and structural decline (Dickerson et al., 2009; Saint-Aubert et al., 2016; Sepulcre et al., 2016; Wang et al., 2016). These findings indicate that cognitively normal subjects assigned to a stage of III/IV might be in a transition phase of evolving AD, where tau pathology has not produced any clinically detectable cognitive changes yet.
It is also important to note that the peak difference between patients or control subjects assigned to Braak stage III/IV compared to I/II was located in the anterior temporal lobe, encompassing early Braak stage regions such as entorhinal cortex, amygdala and anterior hippocampus. This indicates that tau accumulation is relentlessly progressing in the course of the disease and confirms neuropathological data by Braak and Braak, who found fresh neurofibrillary tangles co-occurring with “ghost” tangles across all Braak stages (Braak and Braak, 1997). This further supports the argument that regions affected early by tau pathology such as entorhinal cortex should be incorporated into regional tau PET biomarkers (as done by Jack et al., 2016b). While the Braak staging approach encompasses the hierarchical pattern of tau spread with decreasing thresholds from late to early Braak ROIs, it places less importance on the amount of tau within each region and does not capture continued accumulation in early Braak regions. Thus, AD patients with prominent tau deposition confined to the medial temporal lobe might be classified as stage I/II, similar to controls with less uptake, which is one limitation of this approach. As a measure that incorporates both the amount of tau accumulation and its extent, a t-sum is a promising tau PET biomarker. A recent study has shown that average AV-1451 tracer uptake significantly varies across regions even in young individuals with expected minimal or no neurofibrillary tangles (Vemuri et al., 2017), which can be accounted for in a t-score relative to young controls. In our study, the sum of t-values across “abnormal” voxels was based on tracer uptake in a very small control group of young and middle-aged subjects, and future studies with larger sample sizes need to further test eligibility of such an approach.
To summarize, our study indicates that a number of different approaches to categorize individuals as positive or negative for tau accumulation produce similar results. The similar categorization performance of many of the whole brain measures is undoubtedly related to the finding that all these measures comprise uptake in the key regions vulnerable to tau accumulation largely included in BraakI-IV ROIs or the AD-signature ROI proposed by Jack et al. (2016b) (see also Wang et al., 2016). While this suggests that whole brain approaches might be similar in the separation of Aβ- aging from AD, the regional associations with memory performance and brain atrophy suggest that smaller groups of ROIs such as the BraakIII/IV ROIs, or even BraakI/II ROIs might be more sensitive to the very earliest stages of tau accumulation seen in the transition from Aβ- to Aβ+ normal aging or MCI. Alternately, uptake in late neocortical Braak stage regions might be more sensitive to the transition from MCI to dementia. Thus, the problem of categorization of subjects as tau-negative or positive seems to support many different potential metrics that have similar test performance. However, it seems likely that to define the very earliest stages of tau accumulation, a more fine-grained approach – such as Braak staging or measurement of tau accumulation in specific medial temporal lobe ROIs – may be necessary. The ultimate validation of any of these approaches will require longitudinal observation and neuropathological correlation.
Supplementary Material
Acknowledgments
This research was funded by the Helmholtz Postdoc Program [PD-306] (to A.M.), Tau Consortium (to G.D.R. and W.J.J.), National Institute on Aging grants [R01-AG045611] (to G.D.R.), R01AG034570 (to W.J.J.) P50-AG023501 (G.D.R. and Bruce Miller), P01-AG1972403 (to W.J.J. and Bruce Miller).
Avid Radiopharmaceuticals enabled use of the 18F-AV-1451 tracer in Berkeley and supplied 18F-AV-1451 to ADNI, but did not provide direct funding and were not involved in data analysis or interpretation.
Data collection and sharing for this project was funded by the Alzheimer's Disease Neuroimaging Initiative (ADNI) (National Institutes of Health Grant U01 AG024904) and DOD ADNI (Department of Defense award number W81XWH-12-2-0012). ADNI is funded by the National Institute on Aging, the National Institute of Biomedical Imaging and Bioengineering, and through generous contributions from the following: AbbVie, Alzheimer's Association; Alzheimer's Drug Discovery Foundation; Araclon Biotech; BioClinica, Inc.; Biogen; Bristol-Myers Squibb Company; CereSpir, Inc.; Eisai Inc.; Elan Pharmaceuticals, Inc.; Eli Lilly and Company; EuroImmun; F. Hoffmann-La Roche Ltd and its affiliated company Genentech, Inc.; Fujirebio; GE Healthcare; IXICO Ltd.; Janssen Alzheimer Immunotherapy Research & Development, LLC.; Johnson &Johnson Pharmaceutical Research &Development LLC.; Lumosity; Lundbeck; Merck & Co., Inc.; Meso Scale Diagnostics, LLC.; NeuroRx Research; Neurotrack Technologies; Novartis Pharmaceuticals Corporation; Pfizer Inc.; Piramal Imaging; Servier; Takeda Pharmaceutical Company; and Transition Therapeutics. The Canadian Institutes of Health Research is providing funds to support ADNI clinical sites in Canada. Private sector contributions are facilitated by the Foundation for the National Institutes of Health (www.fnih.org). The grantee organization is the Northern California Institute for Research and Education, and the study is coordinated by the Alzheimer's Disease Cooperative Study at the University of California, San Diego. ADNI data are disseminated by the Laboratory for Neuro Imaging at the University of Southern California.
Conflict of interest: Dr. Rabinovici receives research funding from Avid Radiopharmaceuticals, GE Healthcare and Piramal. He has received consulting fees or speaking honoraria from Eisai, Genentech, Lundbeck, Putnam, Merck, Roche. Dr Jagust has served as a consultant to Banner Alzheimer Institute, Genentech, Novartis, Bioclinica and Merck.
Footnotes
Appendix A. Supporting information: Supplementary data associated with this article can be found in the online version at doi:10.1016/j.neuroimage.2017.05.058.
References
- Aisen PS, Petersen RC, Donohue MC, Gamst A, Raman R, Thomas RG, Walter S, Trojanowski JQ, Shaw LM, Beckett LA, et al. Clinical core of the Alzheimer's disease neuroimaging initiative: progress and plans. Alzheimers Dement J Alzheimers Assoc. 2010;6:239–246. doi: 10.1016/j.jalz.2010.03.006. [DOI] [PMC free article] [PubMed] [Google Scholar]
- Albert MS, DeKosky ST, Dickson D, Dubois B, Feldman HH, Fox NC, Gamst A, Holtzman DM, Jagust WJ, Petersen RC, et al. The diagnosis of mild cognitive impairment due to Alzheimer's disease: recommendations from the National Institute on Aging-Alzheimer's Association workgroups on diagnostic guidelines for Alzheimer's disease. Alzheimers Dement J Alzheimers Assoc. 2011;7:270–279. doi: 10.1016/j.jalz.2011.03.008. [DOI] [PMC free article] [PubMed] [Google Scholar]
- Baker SL, Maass A, Jagust WJ. Considerations for Partial Volume Correcting [18F]-AV-1451 data. Data in Brief. doi: 10.1016/j.dib.2017.10.024. submitted for publication. [DOI] [PMC free article] [PubMed] [Google Scholar]
- Baker SL, Lockhart SN, Price JC, He M, Huesman RH, Schonhaut D, Faria J, Rabinovici G, Jagust WJ. Reference tissue-based kinetic evaluation of 18F-AV-1451 in aging and dementia. J Nucl Med Off Publ Soc Nucl Med. 2016 doi: 10.2967/jnumed.116.175273. [DOI] [PMC free article] [PubMed] [Google Scholar]
- Braak H, Braak E. Neuropathological stageing of Alzheimer-related changes. Acta Neuropathol (Berl) 1991;82:239–259. doi: 10.1007/BF00308809. [DOI] [PubMed] [Google Scholar]
- Braak H, Braak E. Frequency of stages of Alzheimer-related lesions in different age categories. Neurobiol Aging. 1997;18:351–357. doi: 10.1016/s0197-4580(97)00056-0. [DOI] [PubMed] [Google Scholar]
- Brier MR, Gordon B, Friedrichsen K, McCarthy J, Stern A, Christensen J, Owen C, Aldea P, Su Y, Hassenstab J, et al. Tau and Aβ imaging, CSF measures, and cognition in Alzheimer's disease. Sci Transl Med. 2016;8:338ra66. doi: 10.1126/scitranslmed.aaf2362. [DOI] [PMC free article] [PubMed] [Google Scholar]
- Chen K, Ayutyanont N, Langbaum JBS, Fleisher AS, Reschke C, Lee W, Liu X, Bandy D, Alexander GE, Thompson PM, et al. Characterizing Alzheimer's disease using a hypometabolic convergence index. NeuroImage. 2011;56:52–60. doi: 10.1016/j.neuroimage.2011.01.049. [DOI] [PMC free article] [PubMed] [Google Scholar]
- Chien DT, Bahri S, Szardenings AK, Walsh JC, Mu F, Su MY, Shankle WR, Elizarov A, Kolb HC. Early clinical PET imaging results with the novel PHF-tau radioligand [F-18]-T807. J Alzheimers Dis JAD. 2013;34:457–468. doi: 10.3233/JAD-122059. [DOI] [PubMed] [Google Scholar]
- Cho H, Choi JY, Hwang MS, Kim YJ, Lee HM, Lee HS, Lee JH, Ryu YH, Lee MS, Lyoo CH. In vivo cortical spreading pattern of tau and amyloid in the Alzheimer disease spectrum. Ann Neurol. 2016a;80:247–258. doi: 10.1002/ana.24711. [DOI] [PubMed] [Google Scholar]
- Cho H, Choi JY, Hwang MS, Lee JH, Kim YJ, Lee HM, Lyoo CH, Ryu YH, Lee MS. Tau PET in Alzheimer disease and mild cognitive impairment. Neurology. 2016b;87:375–383. doi: 10.1212/WNL.0000000000002892. [DOI] [PubMed] [Google Scholar]
- Crary JF, Trojanowski JQ, Schneider JA, Abisambra JF, Abner EL, Alafuzoff I, Arnold SE, Attems J, Beach TG, Bigio EH, et al. Primary age-related tauopathy (PART): a common pathology associated with human aging. Acta Neuropathol (Berl) 2014;128:755–766. doi: 10.1007/s00401-014-1349-0. [DOI] [PMC free article] [PubMed] [Google Scholar]
- Dani M, Brooks DJ, Edison P. Tau imaging in neurodegenerative diseases. Eur J Nucl Med Mol Imaging. 2016;43:1139–1150. doi: 10.1007/s00259-015-3231-2. [DOI] [PMC free article] [PubMed] [Google Scholar]
- Delacourte A, David JP, Sergeant N, Buée L, Wattez A, Vermersch P, Ghozali F, Fallet-Bianco C, Pasquier F, Lebert F, et al. The biochemical pathway of neurofibrillary degeneration in aging and Alzheimer's disease. Neurology. 1999;52:1158–1165. doi: 10.1212/wnl.52.6.1158. [DOI] [PubMed] [Google Scholar]
- Delis DC, Kramer JH, Kaplan E, Ober BA. California Verbal Learning Test. Second. The Psychological Corporation; San Antonio: 2000. [Google Scholar]
- Desikan RS, Cabral HJ, Hess CP, Dillon WP, Glastonbury CM, Weiner MW, Schmansky NJ, Greve DN, Salat DH, Buckner RL, et al. Automated MRI measures identify individuals with mild cognitive impairment and Alzheimer's disease. Brain J Neurol. 2009;132:2048–2057. doi: 10.1093/brain/awp123. [DOI] [PMC free article] [PubMed] [Google Scholar]
- Dickerson BC, Bakkour A, Salat DH, Feczko E, Pacheco J, Greve DN, Grodstein F, Wright CI, Blacker D, Rosas HD, et al. The cortical signature of Alzheimer's disease: regionally specific cortical thinning relates to symptom severity in very mild to mild AD dementia and is detectable in asymptomatic amyloid-positive individuals. Cereb Cortex N Y N. 2009;1991(19):497–510. doi: 10.1093/cercor/bhn113. [DOI] [PMC free article] [PubMed] [Google Scholar]
- Folstein MF, Folstein SE, McHugh PR. “Mini-mental state” A practical method for grading the cognitive state of patients for the clinician. J Psychiatr Res. 1975;12:189–198. doi: 10.1016/0022-3956(75)90026-6. [DOI] [PubMed] [Google Scholar]
- Herholz K, Salmon E, Perani D, Baron JC, Holthoff V, Frölich L, Schönknecht P, Ito K, Mielke R, Kalbe E, et al. Discrimination between Alzheimer Dementia and Controls by Automated Analysis of Multicenter FDG PET. NeuroImage. 2002;17:302–316. doi: 10.1006/nimg.2002.1208. [DOI] [PubMed] [Google Scholar]
- Ihaka R, Gentleman R. R: a Language for Data Analysis and Graphics. J Comput Graph Stat. 1996;5:299–314. [Google Scholar]
- Jack CR, Petersen RC, Xu YC, Waring SC, O'Brien PC, Tangalos EG, Smith GE, Ivnik RJ, Kokmen E. Medial temporal atrophy on MRI in normal aging and very mild Alzheimer's disease. Neurology. 1997;49:786–794. doi: 10.1212/wnl.49.3.786. [DOI] [PMC free article] [PubMed] [Google Scholar]
- Jack CR, Bennett DA, Blennow K, Carrillo MC, Feldman HH, Frisoni GB, Hampel H, Jagust WJ, Johnson KA, Knopman DS, et al. A/T/N: an unbiased descriptive classification scheme for Alzheimer disease biomarkers. Neurology. 2016a;87:539–547. doi: 10.1212/WNL.0000000000002923. [DOI] [PMC free article] [PubMed] [Google Scholar]
- Jack CR, Wiste HJ, Weigand SD, Therneau TM, Lowe VJ, Knopman DS, Gunter JL, Senjem ML, Jones DT, Kantarci K, et al. Defining imaging biomarker cut points for brain aging and Alzheimer's disease. Alzheimers Dement. 2016b doi: 10.1016/j.jalz.2016.08.005. [DOI] [PMC free article] [PubMed] [Google Scholar]
- Johnson KA, Schultz A, Betensky RA, Becker JA, Sepulcre J, Rentz D, Mormino E, Chhatwal J, Amariglio R, Papp K, et al. Tau positron emission tomographic imaging in aging and early Alzheimer disease. Ann Neurol. 2016;79:110–119. doi: 10.1002/ana.24546. [DOI] [PMC free article] [PubMed] [Google Scholar]
- Joshi A, Koeppe RA, Fessler JA. Reducing between scanner differences in multi-center PET studies. NeuroImage. 2009;46:154–159. doi: 10.1016/j.neuroimage.2009.01.057. [DOI] [PMC free article] [PubMed] [Google Scholar]
- Knopman DS, Parisi JE, Salviati A, Floriach-Robert M, Boeve BF, Ivnik RJ, Smith GE, Dickson DW, Johnson KA, Petersen LE, et al. Neuropathology of Cognitively Normal Elderly. J Neuropathol Exp Neurol. 2003;62:1087–1095. doi: 10.1093/jnen/62.11.1087. [DOI] [PubMed] [Google Scholar]
- Knowles D, Ghahramani Z. Nonparametric Bayesian sparse factor models with application to gene expression modeling. Ann Appl Stat. 2011;5:1534–1552. [Google Scholar]
- Landau SM, Marks SM, Mormino EC, Rabinovici GD, Oh H, O'Neil JP, Wilson RS, Jagust WJ. Association of lifetime cognitive engagement and low β-amyloid deposition. Arch Neurol. 2012;69:623–629. doi: 10.1001/archneurol.2011.2748. [DOI] [PMC free article] [PubMed] [Google Scholar]
- Landau SM, Breault C, Joshi AD, Pontecorvo M, Mathis CA, Jagust WJ, Mintun MA Alzheimer's Disease Neuroimaging Initiative. Amyloid-β imaging with Pittsburgh compound B and florbetapir: comparing radiotracers and quantification methods. J Nucl Med Off Publ Soc Nucl Med. 2013;54:70–77. doi: 10.2967/jnumed.112.109009. [DOI] [PMC free article] [PubMed] [Google Scholar]
- Logan J, Fowler JS, Volkow ND, Wang GJ, Ding YS, Alexoff DL. Distribution volume ratios without blood sampling from graphical analysis of PET data. J Cereb Blood Flow Metab Off J Int Soc Cereb Blood Flow Metab. 1996;16:834–840. doi: 10.1097/00004647-199609000-00008. [DOI] [PubMed] [Google Scholar]
- Lowe VJ, Curran G, Fang P, Liesinger AM, Josephs KA, Parisi JE, Kantarci K, Boeve BF, Pandey MK, Bruinsma T, et al. An autoradiographic evaluation of AV-1451 Tau PET in dementia. Acta Neuropathol Commun. 2016;4 doi: 10.1186/s40478-016-0315-6. [DOI] [PMC free article] [PubMed] [Google Scholar]
- Marquié M, Normandin MD, Vanderburg CR, Costantino IM, Bien EA, Rycyna LG, Klunk WE, Mathis CA, Ikonomovic MD, Debnath ML, et al. Validating novel tau positron emission tomography tracer [F-18]-AV-1451 (T807) on postmortem brain tissue. Ann Neurol. 2015;78:787–800. doi: 10.1002/ana.24517. [DOI] [PMC free article] [PubMed] [Google Scholar]
- McKhann GM, Knopman DS, Chertkow H, Hyman BT, Jack CR, Kawas CH, Klunk WE, Koroshetz WJ, Manly JJ, Mayeux R, et al. The diagnosis of dementia due to Alzheimer's disease: recommendations from the National Institute on Aging-Alzheimer's Association workgroups on diagnostic guidelines for Alzheimer's disease. Alzheimers Dement J Alzheimers Assoc. 2011;7:263–269. doi: 10.1016/j.jalz.2011.03.005. [DOI] [PMC free article] [PubMed] [Google Scholar]
- Metz CE. Basic principles of ROC analysis. Semin Nucl Med. 1978;8:283–298. doi: 10.1016/s0001-2998(78)80014-2. [DOI] [PubMed] [Google Scholar]
- Mormino EC, Brandel MG, Madison CM, Rabinovici GD, Marks S, Baker SL, Jagust WJ. Not quite PIB-positive, not quite PIB-negative: slight PIB elevations in elderly normal control subjects are biologically relevant. NeuroImage. 2012;59:1152–1160. doi: 10.1016/j.neuroimage.2011.07.098. [DOI] [PMC free article] [PubMed] [Google Scholar]
- Ossenkoppele R, Cohn-Sheehy BI, La Joie R, Vogel JW, Möller C, Lehmann M, van Berckel BNM, Seeley WW, Pijnenburg YA, Gorno-Tempini ML, et al. Atrophy patterns in early clinical stages across distinct phenotypes of Alzheimer's disease. Hum Brain Mapp. 2015;36:4421–4437. doi: 10.1002/hbm.22927. [DOI] [PMC free article] [PubMed] [Google Scholar]
- Ossenkoppele R, Schonhaut DR, Schöll M, Lockhart SN, Ayakta N, Baker SL, O'Neil JP, Janabi M, Lazaris A, Cantwell A, et al. Tau PET patterns mirror clinical and neuroanatomical variability in Alzheimer's disease. Brain. 2016 doi: 10.1093/brain/aww027. aww027. [DOI] [PMC free article] [PubMed] [Google Scholar]
- Petersen RC, Parisi JE, Dickson DW, Johnson KA, Knopman DS, Boeve BF, Jicha GA, Ivnik RJ, Smith GE, Tangalos EG, et al. Neuropathologic features of amnestic mild cognitive impairment. Arch Neurol. 2006;63:665–672. doi: 10.1001/archneur.63.5.665. [DOI] [PubMed] [Google Scholar]
- Petersen RC, Aisen PS, Beckett LA, Donohue MC, Gamst AC, Harvey DJ, Jack CR, Jagust WJ, Shaw LM, Toga AW, et al. Alzheimer's Disease Neuroimaging Initiative (ADNI): clinical characterization. Neurology. 2010;74:201–209. doi: 10.1212/WNL.0b013e3181cb3e25. [DOI] [PMC free article] [PubMed] [Google Scholar]
- Price JC, Klunk WE, Lopresti BJ, Lu X, Hoge JA, Ziolko SK, Holt DP, Meltzer CC, DeKosky ST, Mathis CA. Kinetic modeling of amyloid binding in humans using PET imaging and Pittsburgh compound-B. J Cereb Blood Flow Metab. 2005;25:1528–1547. doi: 10.1038/sj.jcbfm.9600146. [DOI] [PubMed] [Google Scholar]
- Rey A. L'examen Clinique en psychologie. Presses universitaires de France; Paris: 1964. [Google Scholar]
- Rousset OG, Ma Y, Evans AC. Correction for partial volume effects in PET: principle and validation. J Nucl Med Off Publ Soc Nucl Med. 1998;39:904–911. [PubMed] [Google Scholar]
- Saint-Aubert L, Almkvist O, Chiotis K, Almeida R, Wall A, Nordberg A. Regional tau deposition measured by [18F]THK5317 positron emission tomography is associated to cognition via glucose metabolism in Alzheimer's disease. Alzheimers Res Ther. 2016;8:38. doi: 10.1186/s13195-016-0204-z. [DOI] [PMC free article] [PubMed] [Google Scholar]
- Saint-Aubert L, Lemoine L, Chiotis K, Leuzy A, Rodriguez-Vieitez E, Nordberg A. Tau PET imaging: present and future directions. Mol Neurodegener. 2017;12:19. doi: 10.1186/s13024-017-0162-3. [DOI] [PMC free article] [PubMed] [Google Scholar]
- Schöll M, Lockhart SN, Schonhaut DR, O'Neil JP, Janabi M, Ossenkoppele R, Baker SL, Vogel JW, Faria J, Schwimmer HD, et al. PET imaging of Tau deposition in the aging human brain. Neuron. 2016;89:971–982. doi: 10.1016/j.neuron.2016.01.028. [DOI] [PMC free article] [PubMed] [Google Scholar]
- Schwarz AJ, Yu P, Miller BB, Shcherbinin S, Dickson J, Navitsky M, Joshi AD, Devous MD, Mintun MS. Regional profiles of the candidate tau PET ligand 18F-AV-1451 recapitulate key features of Braak histopathological stages. Brain J Neurol. 2016;139:1539–1550. doi: 10.1093/brain/aww023. [DOI] [PubMed] [Google Scholar]
- Sepulcre J, Schultz AP, Sabuncu M, Gomez-Isla T, Chhatwal J, Becker A, Sperling R, Johnson KA. In vivo Tau, amyloid, and gray matter profiles in the aging brain. J Neurosci. 2016;36:7364–7374. doi: 10.1523/JNEUROSCI.0639-16.2016. [DOI] [PMC free article] [PubMed] [Google Scholar]
- Shcherbinin S, Schwarz AJ, Joshi A, Navitsky M, Flitter M, Shankle WR, Devous MD, Mintun MA. Kinetics of the Tau PET Tracer 18F-AV-1451 (T807) in subjects with normal cognitive function, mild cognitive impairment, and Alzheimer disease. J Nucl Med Off Publ Soc Nucl Med. 2016;57:1535–1542. doi: 10.2967/jnumed.115.170027. [DOI] [PubMed] [Google Scholar]
- Siemers ER, Sundell KL, Carlson C, Case M, Sethuraman G, Liu-Seifert H, Dowsett SA, Pontecorvo MJ, Dean RA, Demattos R. Phase 3 solanezumab trials: secondary outcomes in mild Alzheimer's disease patients. Alzheimers Dement J Alzheimers Assoc. 2016;12:110–120. doi: 10.1016/j.jalz.2015.06.1893. [DOI] [PubMed] [Google Scholar]
- Vemuri P, Lowe VJ, Knopman DS, Senjem ML, Kemp BJ, Schwarz CG, Przybelski SA, Machulda MM, Petersen RC, Jack CR., Jr Tau-PET uptake: regional variation in average SUVR and impact of amyloid deposition. Alzheimers Dement Diagn Assess Dis Monit. 2017;6:21–30. doi: 10.1016/j.dadm.2016.12.010. [DOI] [PMC free article] [PubMed] [Google Scholar]
- Villemagne V, Doré V, Bourgeat P, Cummins T, Mulligan R, Salvado O, Masters C, Rowe C. Generating continuous and categorical measures from tau imaging studies with 18F-AV1451 and 18F-THK5351: the Tau MeTeR scale. J Nucl Med. 2016;57:128–128. [Google Scholar]
- Villemagne VL, Fodero-Tavoletti MT, Masters CL, Rowe CC. Tau imaging: early progress and future directions. Lancet Neurol. 2015;14:114–124. doi: 10.1016/S1474-4422(14)70252-2. [DOI] [PubMed] [Google Scholar]
- Villeneuve S, Madison C, Ayakta N, La Joie R, Cohn-Sheehy BI, Vogel J, Marks S, Arthur-Bentil SK, Reed B, DeCarli C, et al. Existing thresholds for PIB positivity are too high. Alzheimers Dement J Alzheimers Assoc. 2014;10:P4–P5. [Google Scholar]
- Villeneuve S, Rabinovici GD, Cohn-Sheehy BI, Madison C, Ayakta N, Ghosh PM, La Joie R, Arthur-Bentil SK, Vogel JW, Marks SM, et al. Existing Pittsburgh compound-B positron emission tomography thresholds are too high: statistical and pathological evaluation. Brain J Neurol. 2015;138:2020–2033. doi: 10.1093/brain/awv112. [DOI] [PMC free article] [PubMed] [Google Scholar]
- Wang L, Benzinger TL, Su Y, Christensen J, Friedrichsen K, Aldea P, McConathy J, Cairns NJ, Fagan AM, Morris JC, et al. Evaluation of Tau imaging in staging Alzheimer disease and revealing interactions between β-amyloid and tauopathy. JAMA Neurol. 2016;73:1070–1077. doi: 10.1001/jamaneurol.2016.2078. [DOI] [PMC free article] [PubMed] [Google Scholar]
- Wechsler D. Wechsler Memory Scale. Third. The Psychological Corporation; San Antonio: 1997. [Google Scholar]
- Wooten D, Guehl NJ, Verwer EE, Shoup TM, Yokell DL, Zubcevik N, Vasdev N, Zafonte RD, Johnson KA, Fakhri GE, et al. Pharmacokinetic evaluation of the tau PET radiotracer [18F]T807 ([18F]AV-1451) in human subjects. J Nucl Med jnumed. 2016;115:170910. doi: 10.2967/jnumed.115.170910. [DOI] [PMC free article] [PubMed] [Google Scholar]
Associated Data
This section collects any data citations, data availability statements, or supplementary materials included in this article.