

In the suprachiasmatic nucleus (SCN), the GABA transporters GAT1 and GAT3 are expressed in astrocytes. Inhibition of these GABA transporters increased a tonic GABA current and reduced the circadian period of Per1 expression in SCN neurons. GAT1 and GAT3 showed functional cooperativity: inhibition of one GAT increased the activity but not the expression of the other. Our data demonstrate that GABA transporters are important regulators of GABAA receptor-mediated currents and the circadian clock.
Keywords: GABA transporter 1, GABA transporter 3, suprachiasmatic nucleus, GABAA receptor-mediated currents
Abstract
GABA is a principal neurotransmitter in the hypothalamic suprachiasmatic nucleus (SCN) that contributes to intercellular communication between individual circadian oscillators within the SCN network and the stability and precision of the circadian rhythms. GABA transporters (GAT) regulate the extracellular GABA concentration and modulate GABAA receptor (GABAAR)-mediated currents. GABA transport inhibitors were applied to study how GABAAR-mediated currents depend on the expression and function of GAT. Nipecotic acid inhibits GABA transport and induced an inward tonic current in concentration-dependent manner during whole cell patch-clamp recordings from SCN neurons. Application of either the selective GABA transporter 1 (GAT1) inhibitors NNC-711 or SKF-89976A, or the GABA transporter 3 (GAT3) inhibitor SNAP-5114, produced only small changes of the baseline current. Coapplication of GAT1 and GAT3 inhibitors induced a significant GABAAR-mediated tonic current that was blocked by gabazine. GAT inhibitors decreased the amplitude and decay time constant and increased the rise time of spontaneous GABAAR-mediated postsynaptic currents. However, inhibition of GAT did not alter the expression of either GAT1 or GAT3 in the hypothalamus. Thus GAT1 and GAT3 functionally complement each other to regulate the extracellular GABA concentration and GABAAR-mediated synaptic and tonic currents in the SCN. Coapplication of SKF-89976A and SNAP-5114 (50 µM each) significantly reduced the circadian period of Per1 expression in the SCN by 1.4 h. Our studies demonstrate that GAT are important regulators of GABAAR-mediated currents and the circadian clock in the SCN.
NEW & NOTEWORTHY In the suprachiasmatic nucleus (SCN), the GABA transporters GAT1 and GAT3 are expressed in astrocytes. Inhibition of these GABA transporters increased a tonic GABA current and reduced the circadian period of Per1 expression in SCN neurons. GAT1 and GAT3 showed functional cooperativity: inhibition of one GAT increased the activity but not the expression of the other. Our data demonstrate that GABA transporters are important regulators of GABAA receptor-mediated currents and the circadian clock.
gaba plays an important functional role regulating the circadian clock located in the hypothalamic suprachiasmatic nucleus (SCN) (Moore and Speh 1993). GABA-activating GABAA (GABAARs) and GABAB receptors (GABABRs) influence light-induced phase shifts, synchronization of the dorsal and ventral SCN, and the sensitivity of the circadian clock to light-entraining signals (Albus et al. 2005; Aton et al. 2006; Moldavan and Allen 2013; Ralph and Menaker 1985; Wagner et al. 1997). The physiological properties of GABAAR-mediated currents are determined by the subunits comprising the receptors, the extracellular GABA concentration, the intracellular chloride concentration, and the membrane potential. In turn, the extracellular GABA concentration is dependent on magnitude of GABA release and GABA uptake (Glykys and Mody 2007a; Kozlov et al. 2006; Lee et al. 2010; Song et al. 2013). GABA uptake is regulated by four sodium-chloride-dependent cotransporters with a 1 GABA: 2 Na+:1 Cl− stoichiometry (Richerson and Wu 2003; Scimemi 2014). GABA transporter 1 (GAT1; rat: SLC6A1) and GABA transporter 3 (GAT3; rat: SLC6A11) are expressed and colocalized throughout the rat SCN (Moldavan et al. 2015) but did not show significant diurnal rhythm of expression (Moldavan et al. 2015). By electron microscopy, unlabeled neuronal cell bodies, axons, and axodendritic symmetric and asymmetric synapses are surrounded by glial processes immunoreactive for GAT1 or GAT3 (Moldavan et al. 2015). In adult animals, immunoreactivity for the GABA transporters (GAT) was not detected in either AVP- or VIP-immunoreactive neurons, in neuronal processes labeled with the neurofilament heavy chain, or in the synaptic cleft (Moldavan et al. 2015). These morphological data indicate that astrocytes expressing GAT may regulate the extracellular GABA concentration and thereby modulate the activity of neuronal networks in the SCN.
The functional properties of GAT in the SCN have not been studied systematically, and only fragmentary data are available. The GABA uptake inhibitors nipecotic acid (NA) and riluzole increased AVP release in the SCN (Isobe and Nishino 1997). This was not due to an increase of the extracellular GABA concentration, because bath application of GABA did not affect AVP release. In our recent studies, GABA accumulating during application of NA activated presynaptic GABABRs and inhibited glutamate release from retinohypothalamic tract axon terminals (Moldavan and Allen 2013). GAT1 and GAT3 synergistically regulate GABA uptake and GABAAR-mediated conductances (Jin et al. 2011; Keros and Hablitz 2005; Kersanté et al. 2013; Kirmse et al. 2009; Sharopov et al. 2014), but it is still unclear whether this is due to the changes in expression or in the functional activity of GAT, or both. Inhibition or knockout of GAT elevates the extracellular GABA concentration, which in turn activates extrasynaptic GABAARs and increases GABAAR-mediated tonic conductances (Chiu et al. 2005; Jensen et al. 2003; Jin et al. 2011; Keros and Hablitz 2005; Petrini et al. 2004; Sipilä et al. 2007; Song et al. 2013).
The aim of this study was to determine how the function and expression of GAT regulate tonic and synaptic GABAAR-mediated currents in the SCN. We found that simultaneous blockade of both transporter subtypes significantly increased the magnitude of GABAAR-mediated tonic current, decreased the amplitude and decay time constant of synaptic currents, and reduced the circadian period of Per1 expression in cultured brain slices. GAT1 and GAT3 functionally complemented each other to regulate GABA uptake: blocking one GAT subtype increased the activity of the other subtype so that baseline current, which depends on the extracellular GABA concentration, was not substantially altered.
METHODS
Animal entrainment and preparation of brain slices.
The Institutional Animal Care and Use Committee of Oregon Health & Science University approved all experimental procedures involving animals, and all efforts were made to minimize pain and the number of animals used. Male 4- to 6-wk-old Sprague-Dawley rats (Charles River Laboratories, Wilmington, MA) were housed in an environmental chamber (Percival Scientific, Perry, IA) maintained at 20–21°C on a 12:12-h light-dark (LD) cycle, with free access to food and water. Zeitgeber time (ZT) was used to define lights-on and dark phases during the LD cycle. By convention, ZT12 was defined as lights off. During the lights-on phase, rats were deeply anesthetized with isoflurane (Hospira, Lake Forest, IL); their brains were removed and submerged in an ice-cold Krebs solution consisting of (in mM) 82.7 NaCl, 2.4 KCl, 0.5 CaCl2, 6.8 MgCl2, 1.4 NaH2PO4, 23.8 NaHCO3, 23.7 dextrose (glucose), and 60 sucrose, saturated with 95% O2-5% CO2 (pH 7.3–7.4, 308–310 mosM). Coronal (250 µm thick) brain slices containing the SCN were cut with a vibrating-blade microtome (Leica VT1000S; Leica Biosystems, Nussloch, Germany). Slices were incubated for 1–1.5 h at 30°C before electrophysiological recordings started.
Whole cell patch-clamp recording.
Whole cell patch-clamp recordings were made at 28°C from 1.5 to 8 h after slice preparation (Moldavan and Allen 2010). The artificial cerebrospinal fluid (ACSF) used for the recordings consisted of (in mM) 132.5 NaCl, 2.5 KCl, 1.2 NaH2PO4, 2.4 CaCl2, 1.2 MgCl2, 11 glucose, and 22 NaHCO3, saturated with 95% O2-5% CO2 (pH 7.3–7.4, 300–305 mosM). Microelectrodes with tip resistances of 8–9 MΩ were pulled from borosilicate glass capillaries (World Precision Instruments, Sarasota, FL) and filled with a solution containing (in mM) 127.8 CsCl, 0.5 CaCl2, 10 HEPES, 5 EGTA, 10 CsOH·2H2O, 3 MgATP, 0.3 Tris-GTP, and 5 lidocaine N-ethyl chloride (QX-314). Equilibrium potential for Cl– was close to 0 mV. QX-314 was included in the patch pipette solution to block voltage-dependent Na+ channels. Intracellular Cs+ was used to block postsynaptic G protein-coupled K+ channels activated by GABABRs on SCN neurons (Jiang et al. 1995). To prevent activation of ionotropic glutamate receptors, 6-cyano-7-nitroquinoxaline-2,3-dione disodium (CNQX disodium salt; 20 µM) and d-(−)-2-amino-5-phosphonovalerate (d-AP5; 50 µM) were added to the ACSF. Neurons were voltage clamped at −60 mV. These recording conditions also prevented inhibition of postsynaptic voltage-gated Ca2+ channels when postsynaptic GABABRs were activated. Individual SCN neurons were visualized with infrared illumination and differential interference contrast optics using a Leica DMLFS microscope (Leica Biosystems) with video camera and display (Sony, Tokyo, Japan). Online data collection and analysis were performed using an EPC-7 patch-clamp amplifier (HEKA Electronik, Lambrecht/Pfalz, Germany), a Mac Mini computer (Apple), and Pulse or Patchmaster software (HEKA Electronik). The records were filtered at 3 kHz and digitized at 10 kHz. A small hyperpolarizing voltage step (−2 mV, 5 ms) was applied before each recording trace to monitor the series resistance, which was not compensated. Series resistance was calculated, and recordings with series resistance changes of >10% were excluded from the data analysis (Moldavan et al. 2006). Slow and fast capacitances were not compensated. The recordings were not corrected for liquid junction potential, which was estimated to be <5 mV.
Test agent application.
All test agents were bath applied by perfusion with ACSF containing the final concentration of the compound. A complete change of the external solution in the recording chamber took less than 30 s at a flow rate of 1.5–2 ml/min. A custom-made gravity-driven perfusion system allowed the application of GAT inhibitors to the SCN at high concentrations for 1 h or longer. The reservoir containing the GAT inhibitors dissolved in ACSF and bubbled with carbogen (5% CO2-95% O2) was connected to a bifurcated tube terminating in two glass capillaries glued together in parallel to each other. The capillaries had different diameters (large: OD 1.2 mm, ID, 0.5 mm; small: OD 0.33 mm, ID 0.19 mm). The tips of the capillaries were 2.5 mm apart. The solution flowing through capillaries did not alter the seal quality or produce recording artifacts. At the beginning of the GAT inhibitor application, ACSF was simultaneously applied through both capillaries. This allowed the ACSF in the chamber to be changed in ~30 s. The tube connected to the large capillary was then clamped, and the flow continued only through the small diameter capillary. The tip of small diameter capillary was located ~1 mm from SCN, and the flow from the tip completely covered the nucleus. This perfusion system has the advantage of allowing expensive inhibitors to be applied at high concentrations for long durations. (±)Nipecotic acid (3-piperidinecarboxylic acid; NA); 1-(4,4-diphenyl-3-butenyl)-3-piperidinecarboxylic acid hydrochloride (SKF-89976A hydrochloride), CNQX disodium salt, and QX-314 were purchased from Sigma (St Louis, MO). 1-[2-[Tris(4-methoxyphenyl)methoxy]ethyl]-(S)-3-piperidinecarboxylic acid [(S)-SNAP5114)], 1,2,5,6-tetrahydro-1-[2-[[(diphenylmethylene)amino]oxy]ethyl]-3-pyridinecarboxylic acid hydrochloride (NNC-711), 6-imino-3-(4-methoxyphenyl)-1(6H)-pyridazinebutanoic acid hydrobromide (SR-95531 hydrobromide, gabazine), d-AP5, and 1,2,5,6-tetrahydropyridine-4-yl-methylphosphinic acid (TPMPA) were purchased from Tocris Cookson (Ellisville, MO). Appropriate stocks were made and diluted with ACSF just before application. SKF-89976A, SNAP-5114. and CNQX were dissolved in DMSO. The final concentration of DMSO in ASCF was 0.1% at the highest concentrations of GAT inhibitors. (2S)-3-[[(1S)-1-(3,4-dichlorophenyl]amino-2-hydroxypropyl](phenylmethyl)phosphinic acid (CGP-55845) was dissolved in DMSO (the final concentration of DMSO in ASCF was 0.01%). DMSO (<1%) does not affect GABAAR-mediated currents (Jensen et al. 2003).
Recordings and data analysis.
IGOR Pro 5.03 (WaveMetrics, Lake Oswego, OR), KaleidaGraph (v3.6; Synergy Software, Reading, PA), MiniAnalysis software (Synaptosoft, Decatur, GA), Excel 11.6.6 (or 14.4.5; Microsoft, Redmond, WA), and FreeHand MX (Macromedia, San Francisco, CA) were used for curve fitting, data analysis, and graphic presentation. The baseline was monitored during the first 8–10 min after the membrane was ruptured to enter whole cell mode to allow the cell to be perfused by intracellular solution. After the baseline became stable, the control baseline level was recorded for 8 min and the holding current was measured during the last 120 s epoch. To determine the magnitude of the tonic current, the method introduced by (Nusser and Mody (2002) was used. Because the tonic current induced by blocking of GABA uptake by SKF-89976A and SNAP-5114 developed very slowly, these GABA transport inhibitors were applied for 25 min either alone or together, and the holding current was measured during a 120-s epoch at the end of each application. The total time of the recording could exceed 1 h. The tonic GABAAR-mediated current was defined as the current inhibited by 10 µM gabazine (Brickley et al. 2001). Current rundown was monitored by comparing the holding current after gabazine application to the initial current amplitude. The holding current was calculated by generating an all-points histogram from the 120-s epoch during control recordings and after application of GABA uptake inhibitors alone or together. A Gaussian distribution was fitted to the histogram, or single Gaussians were fitted to the positive side of the all-points histograms if the Gaussian was skewed to the left when high-frequency spontaneous GABAAR-mediated postsynaptic currents (sGPSC) were recorded. The term sGPSC was used instead of spontaneous inhibitory postsynaptic currents (sIPSC) because in the adult SCN, GABA acts as both an excitatory (depolarizing) and inhibitory (hyperpolarizing) neurotransmitter (De Jeu and Pennartz 2002; Irwin and Allen 2009; Wagner et al. 1997). The peak of the fitted Gaussian was used to determine the mean holding current required for maintaining the voltage of the cell at −60 mV (Ade et al. 2008). The differences (I∆) between the means of the fitted Gaussians in control and during application of GABA uptake inhibitors were calculated. The onset of tonic current was estimated at the time point of negative continuous change of baseline after GAT coapplication. The maximal effect was estimated at the time point when tonic current reached the steady state. The magnitude of the tonic current was measured with IGOR Pro. During the analysis of tonic and synaptic currents, the currents generated by test pulses were removed from the traces. Data are presented as means ± SE. A confidence level of 95% was used to determine statistical significance. P values are reported throughout the text. The concentration-response data were fit with a nonlinear regression model that took into consideration the fact that recordings were made from different slices and neurons. One-way ANOVA followed by Tukey’s honestly significant difference (HSD) post hoc test was applied for multiple comparisons. sGPSC were analyzed using MiniAnalysis software. The detection threshold for events was set at four times the root mean square (RMS) noise during coapplication of GAT inhibitors. About 100 individual sGPSC were recorded under each experimental condition for each cell. Peak amplitude, rise time (10 to 90% of the peak amplitude), decay time constant (tau), and RMS noise were calculated. RMS noise was calculated for each recorded neuron by measuring the fluctuations of holding current in 10 intervals, which did not include sGPSC (Mtchedlishvili and Kapur 2006). The parameters of sGPSC recorded under different conditions were analyzed using the Friedman test followed by the post hoc Wilcoxon signed-rank test with a Bonferroni correction resulting in a significance level set at P < 0.017.
Hypothalamic tissue collection and Western blot procedures.
Coronal brain slices (200 µm) were cut in ice-cold Krebs solution with a vibrating-blade microtome (Leica VT1000S) during the subjective day at ZT4 and then transferred into a 15-ml chamber with ACSF bubbled with carbogen and containing either the GAT1 inhibitors SKF-89976A (100 µM; stock diluted in DMSO) or NNC-711 (5 µM; stock diluted in water) or the GAT3 inhibitor SNAP-5114 [100 µM; stock diluted in DMSO or in ethanol (0.2% final)] and preincubated for 5–7 h at 30°C. To study the effect of each GAT inhibitor, brain slices were collected from three to six rats and randomly distributed between the chambers containing: control, vehicle (solvent used to dilute GAT inhibitor; second control), and a GAT inhibitor. After preincubation, hypothalamic tissue was dissected from brain slices, homogenized, and lysed in the protease inhibitors containing RIPA buffer. Similarly, slices were cut at ZT2–ZT4, and SCN tissue was punched from slices (n = 32 rats) after 5–6 h of preincubation in ACSF containing a GAT inhibitor. A Bradford assay (catalog no. 500-0006, Bio-Rad protein Assay Dye Reagent Concentrate, Life Science Research, Hercules, CA) was used to determine the total protein amount in the samples. It was calculated from a standard curve generated with serial BSA dilutions. Depending on the protein concentration in the lysate either 5 or 10 µg of total protein per 20-µl samples were loaded into the wells of a polyacrylamide gel. The proteins were SDS-PAGE separated at 125 V and electroblotted (40 V for 1 h) onto polyvinylidene difluoride membranes. For the enhanced chemiluminescence detection, the blots were blocked in 5% non-fat milk in TBST (Tris-buffered saline-Tween 20) and incubated with a rabbit anti-GAT1 (extracellular domain) polyclonal antibody (AGT-001; Alomone Laboratories, Jerusalem, Israel 1:500) overnight at 4°C in the same buffer with agitation. A donkey polyclonal anti-rabbit IgG-horseradish-conjugated secondary antibody (catalog no. sc-2313; Santa Cruz Biotechnology, Santa Cruz, CA; 1:5,000) was added for 1 h at room temperature. The loading control was mouse anti-glyceraldehyde-3-phosphate dehydrogenase (GAPDH) purified monoclonal antibody (MAB374; Millipore, Temecula, CA; 1:8,000). The bands were detected on the X-ray film following the incubation with a chemiluminescent substrate (catalog no. PI-34077; Thermo Scientific, Rockford, IL). GAT1 blots were scanned from X-ray film. For GAT3 detection, the blots were blocked and incubated overnight in Odyssey blocking buffer containing a rabbit anti-GAT3 polyclonal antibody (catalog no. AB1574, amino acids 607–627, COOH terminus; Millipore; 1:1,000). The secondary antibody was a goat anti-rabbit IRDye 680-conjugated IgG (catalog no. 926-32221; LI-COR Biosciences, Lincoln, NE; 1:4,000, channel 700 nm, red) with 1-h incubation time. GAT3 blots were processed with Odyssey infrared imaging system (Densitometer Odyssey; LI-COR Biosciences). The optimal exposure was chosen to avoid image saturation. For each sample the optical density of the GAT1 or GAT3 bands was quantified with ImageJ (National Institutes of Health), normalized to the corresponding loading control, averaged across all gels and shown on graphs as a ratio to control. Data are means ± SE. A t-test for unequal variances (two-tailed) and one-way ANOVA were applied. The applied procedures and controls for antibody specificity were described in detail previously (Moldavan et al. 2015).
Preparation of brain slice cultures and bioluminescence recording.
With the use of sterile techniques, brain slices (250 µM) containing SCN were prepared from 4- to 6-wk-old Per1:Luc rats from our colony and placed onto Millicell cell culture inserts (Yamazaki et al. 2000). The Per1:Luc transgenic rats express a luciferase reporter that is linked to the mouse Per1 promoter (Yamazaki et al. 2000). Inserts were placed in 35-mm culture dishes containing 1.2 ml of culture medium and sealed with vacuum grease. Culture medium consisted of DMEM supplemented with B27, 20 mM glucose, 10 mM HEPES, 4.2 mM NaHCO3, 25 μg/ml penicillin, 25 μg/ml streptomycin, and 0.1 mM beetle luciferin. Dishes were placed into a Lumicycle (Actimetrics, Wilmette, IL), and photons were counted for 75 s every 10 min. The bioluminescence of the SCN was monitored for at least 4 days, and then SKF-89976A and SNAP-5114 (SKF+SNAP; 50 µM each), SKF+SNAP (25 µM each), or the corresponding vehicle controls (0.1% or 0.05% DMSO) were added to the dishes. The activity was monitored for an additional 3 days. Data were imported into the Lumicycle Analysis program (Actimetrics), and baseline drift was removed by fitting a polynomial curve with an order one less than the number of cycles and subtracting from the raw data. The resulting curve was smoothed with a median filter. The circadian period was estimated using a damped sine curve. The period values were compared using a one-way ANOVA with repeated measures (SPSS Statistics, version 24; IBM, Armonk, New York).
RESULTS
Regulation of the GABAAR-mediated tonic current by GABA transporters.
The extracellular GABA concentration represents a balance between the rate of GABA release and the GABA uptake. We used GAT inhibitors to explore the role of GAT in regulating the GABAAR-mediated tonic and synaptic currents. NA, a transportable blocker of GABA uptake, induces heteroexchange GABA release and inhibits all types of GAT (Honmou et al. 1995; Richerson and Wu 2003). Application of NA (1–2 mM) induced a sustained inward tonic current and decreased the amplitude of sGPSC, perhaps due to desensitization of synaptic GABAARs by accumulating GABA (Fig. 1A). The effect of NA was reversible. The NA-activated tonic current was completely blocked by gabazine (10 µM; Fig. 1B). Increasing the NA concentrations progressively increased the tonic current amplitude and decreased the sGPSC amplitude (Fig. 1, C–E). With increasing NA concentrations, a large transient current preceded the sustained tonic current (Fig. 1F and Fig. 2A). sGPSC amplitude decreased during activation of the transient current (Fig. 1F, 1–4). A tonic current induced by coapplication of selective GAT1 and GAT3 inhibitors (SKF-89976A and SNAP-5114, 100 µM each) occluded the NA (40 mM)-activated current and was blocked by gabazine, showing that both these currents were mediated by GABAARs (Fig. 1G). The peak amplitude of the transient current induced by NA (0.1–50 mM) was concentration dependent with an EC50 of 3.6 ± 0.6 mM and a Hill coefficient of 1.12 ± 0.18 (Fig. 2B and Fig. 3A). The maximal transient current amplitude was 533 ± 104 pA at 40 mM NA (n = 6). The sustained tonic current reached the maximum amplitude at 2 mM and remained in the same range up to 50 mM NA (mean amplitude 133.6 ± 13.0 pA, n = 16; Fig. 2C). The transient current induced by GABA (1 µM–3 mM) also demonstrated concentration dependence (Fig. 3A). The maximal transient current amplitude was 951 ± 134 pA at 1.5 mM GABA (n = 10) with an EC50 of 120.3 ± 18.9 µM and a Hill coefficient of 1.47 ± 0.34. The amplitudes of NA- and GABA-activated transient currents were compared to estimate the extracellular GABA concentration induced by a given NA concentration. With the amplitude of NA current known, the corresponding GABA concentration, which induced a current with the same amplitude, was estimated from the concentration-response curve for GABA (Fig. 3B, linear scale). At saturating concentrations, the maximal NA-activated current amplitude was equal to the current induced by 160 µM GABA. In this range, up to the maximal NA-activated current (I[NA]max), the transient GABAAR-mediated currents induced by NA showed a nonlinear concentration dependence. Thus the GABA efflux increased faster at low compared with high NA concentrations, causing a nonlinear accumulation of extracellular GABA. In contrast to NA, transient currents of the same magnitude induced by GABA showed a linear concentration dependence in the same range of current amplitudes.
Fig. 1.

Inward current induced by nipecotic acid (NA). A–G: examples of NA-activated currents recorded in whole cell mode from an SCN neuron voltage-clamped at −60 mV. A: NA induced an inward tonic current and reduced the amplitude of synaptic currents. B: gabazine (Gbz; 10 μM) reversely inhibited the GABAAR-mediated tonic current induced by NA. C–E: increase of the tonic current and decrease of sGPSC amplitude during application of NA in concentrations of 1 (C), 2 (D), and 5 mM (E) (successively: control, NA application, and washout). F: transient current during 50 mM NA application (extended scale). Inset: recordings 1–4 demonstrate a reduction of the sGPSC amplitude during activation of the transient current. G: the NA (40 mM)-activated inward current (left) was occluded by the tonic current induced by coapplication of SKF-89976A and SNAP-5114 (SKF+SNAP, 100 µM each; right).
Fig. 2.
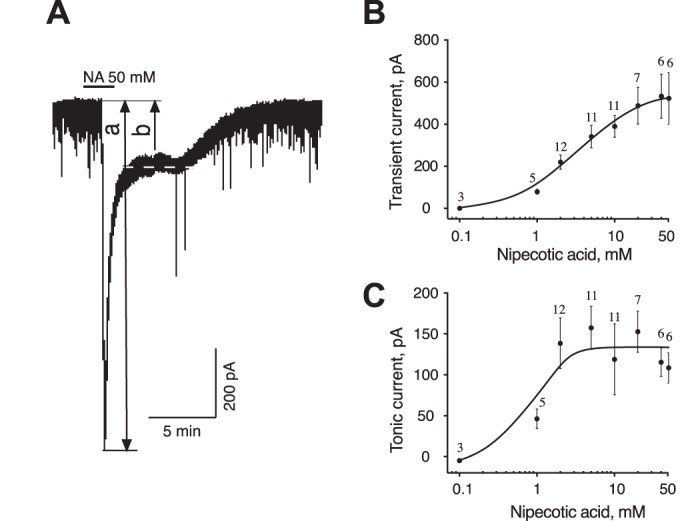
Concentration dependence of two components of NA-activated current. A: NA (50 mM) activated a transient current (a) followed by a sustained tonic current (b). Dashed line indicates the holding current during the sustained component. B and C: concentration dependence of the NA-activated transient (B) and sustained tonic (C) currents. Numbers on graphs indicate the quantity of neurons recorded for each concentration.
Fig. 3.
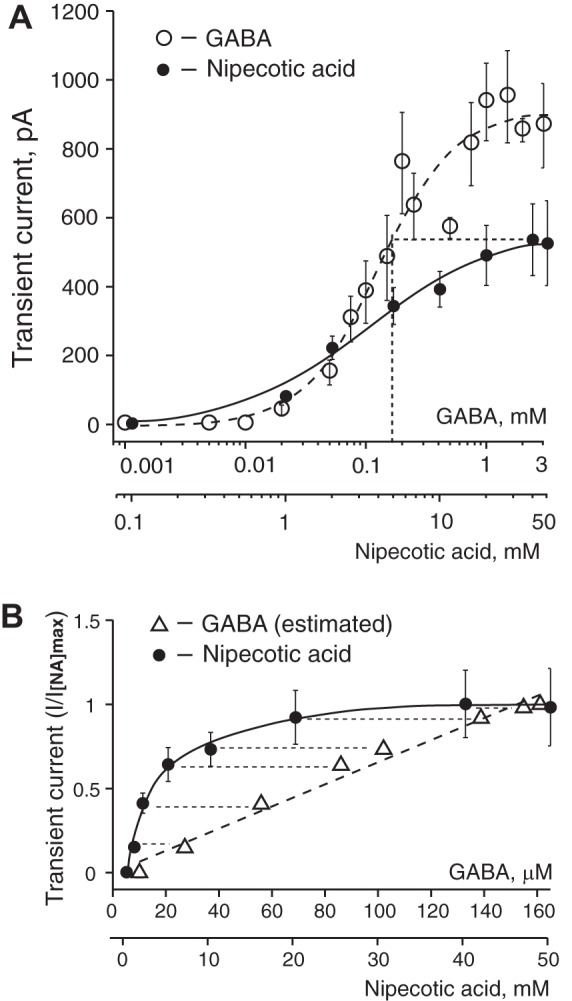
Concentration dependence of transient currents induced by GABA and NA, and relationship between NA-activated currents and estimated extracellular GABA concentrations. A: concentration dependence of transient currents induced by GABA and NA. The transient current at a saturating NA concentration has the same magnitude as the current induced by 160 µM GABA (shown on x-axis by dotted vertical line). Concentrations of GABA and NA are shown on a log scale. Data are means ± SE. The number of neurons (n) recorded for each GABA concentration was n = 3 (1–10 µM), n = 5 (20 µM), n = 11 (50 µM), n = 7 (75 µM), n = 12 (100 µM), n = 7 (150 µM), n = 7 (200 µM), n = 15 (250 µM), n = 8 (500 µM), n = 10 (750 µM), n = 11 (1 mM), n = 10 (1.5 mM), n = 5 (2 mM), and n = 8 (3 mM). The NA concentration-response data are the same as in Fig. 2B. B: transient GABAAR-mediated currents with the same amplitude demonstrated different dependence on the GABA or NA concentrations in the range up to the maximal current induced by NA (I[NA]max) and are shown as I/I[NA]max. Over the indicated range of amplitudes, the transient currents induced by GABA and NA showed linear and nonlinear concentration dependence, respectively. Each data point on the graph matches GABA or NA concentrations that induced the same transient current amplitude. Concentrations of GABA that induced current the same amplitude as NA were estimated from the concentration-response curve for GABA. Currents with the same amplitude are connected with thin dashed lines. Concentrations of GABA and NA are shown on a linear scale.
Concentration dependence of GABAAR-mediated tonic currents from GAT inhibitors SKF-89976A and SNAP-5114.
Continuous (25–70 min) application of the selective GAT inhibitors NNC-711 (5 µM), SKF-89976A (100–200 µM), or SNAP-5114 (100 µM) induced only minor changes of the baseline current. However, coapplication of GAT1 and GAT3 inhibitors activated a large tonic current. These data are consistent with a model in which GAT1 and GAT3 perform complementary roles: when one transporter subtype is inhibited, the other compensates by increasing GABA uptake (Jin et al. 2011; Keros and Hablitz 2005; Kersanté et al. 2013; Kirmse et al. 2009). To estimate the effective concentrations of GAT inhibitors, we recorded the GABAAR-mediated tonic current when the complementary transporter was blocked. To study the effect of each GAT inhibitor, the inhibitor for the other GAT subtype was first added to ACSF (see below). At the end of each recording, the tonic current was blocked by gabazine (10 µM).
To study the concentration dependence of GABAAR-mediated tonic current from SKF-89976A, we performed recordings on unidentified neurons in the cerebral cortex (ZT21–ZT4), where GAT1 is more highly expressed than in the hypothalamus including the SCN (Moldavan et al. 2015). The ACSF that was used for perfusion and dilution of SKF-89976A contained SNAP-5114 (20 µM) to inhibit GAT3. SNAP-5114 inhibits human GAT3 with IC50 = 5 µM (Borden et al. 1994b). Data for rat GAT3 are not available. We estimate that at this concentration, 80% of GABA transport through GAT3 will be blocked and only 5% through GAT1. SNAP-5114 by itself induced only a small tonic current of −6.0 ± 2.4 pA (n = 23). A range of SKF-89976A concentrations were then applied (1–200 µM). The tonic current activated by SKF-89976A (IΔ) was calculated by subtraction of current induced by SNAP-5114 from that activated by joint SNAP+SKF application (see methods). We calculated an EC50 for SKF-89976A of 32.6 ± 11.5.1 µM (Hill coefficient 1.62 ± 0.88; Fig. 4A).
Fig. 4.
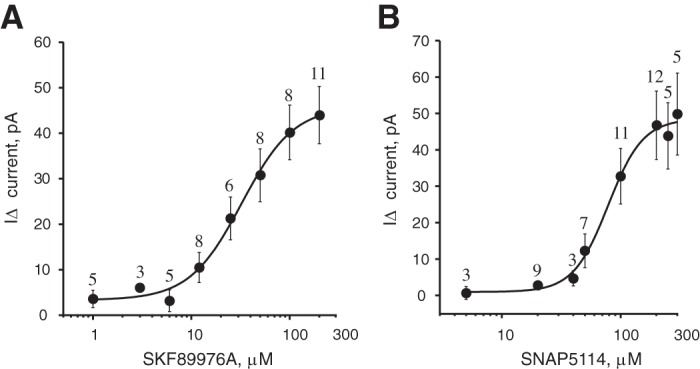
Concentration dependence of GABAAR-mediated tonic current on the GAT1 and GAT3 inhibitors. A: concentration dependence of the inward tonic current activated by the GAT1 inhibitor SKF-89976A (I∆ = I(SKF+SNAP) − ISNAP, recording solution contained 20 µM SNAP-5114; whole cell recording from cerebral cortex; EC50 = 32.6 ± 11.5 µM, n = 26 cells). B: concentration-response curve for GAT3 inhibitor SNAP-5114 (I∆ = I(SNAP+SKF) − ISKF, recording solution contained 10 µM SKF-89976A; recording from SCN; EC50 = 79.0 ± 19.4 µM, n = 39 cells). On the y-axis, I∆ (inward tonic current, in pA) is shown as positive numbers (means ± SE).
The concentration dependence of the tonic current induced by SNAP-5114 application was determined in the SCN (ZT19–ZT2), where GAT3 is abundantly expressed (Moldavan et al. 2015). The ACSF contained SKF-89976A (10 µM) to inhibit GAT1. SKF-89976A inhibits GABA uptake by rat GAT1 with IC50 = 0.64–1 µM (Bernstein and Quick 1999; Borden et al. 1994b) and reduced GABA uptake and GAT current >90% at 10 µM concentration (Bernstein and Quick 1999; Takahashi et al. 1995; Wu et al. 2007). SKF-89976A alone produced a tonic current of −4.2 ± 1.5 pA (n = 34). SNAP-5114 was applied in increasing concentrations (5–300 µM). The current induced by SNAP-5114 application (I∆) was obtained by subtraction of current activated by SKF-89976A alone from that induced by joint SKF+SNAP application. EC50 for SNAP-5114 was calculated to be 79.0 ± 19.4 µM (Hill coefficient 2.82 ± 1.89; Fig. 4B).
Application of GAT inhibitors demonstrated complementary GAT1 and GAT3 activity.
GAT1 and GAT3 protein expression overlap in the SCN, which makes possible a functional interaction between these transporters (Moldavan et al. 2015). To better understand this interplay, we sequentially applied SKF-89976A and SNAP-5114. The GAT inhibitors were applied in concentrations that exceeded the EC50 to induce GABAAR-mediated tonic current (see above). CGP55845 (3 µM), TPMPA (30 µM; a selective GABACR antagonist), and CNQX (20 µM) were added to the recording solution to pharmacologically isolate GABAAR-mediated currents. Application of strychnine (1−10 µM) did not affect the holding current in the SCN (our recordings, not shown), demonstrating that glycine receptors were not involved. Similar lack of strychnine effect on holding current was reported during recording from hypothalamic supraoptic nucleus (Park et al. 2006). We chose the late subjective night for application of GAT inhibitors, because the lowest GABA content was reported at circadian time (CT) 20 (Ikeda et al. 1997), and we assumed that GAT activity at this time should be maximal, as well as the effect of inhibitors.
In the first set of experiments (ZT20−ZT2), SKF-89976A (100 µM) was applied before SNAP-5114 (100 µM). Recordings were conducted in the following sequence: control (8–10 min), application of SKF-89976A (25 min), followed by SKF+SNAP (100 µM each, 25 min) and then gabazine (10 µM, 3 min). The current returned to baseline level after gabazine application, demonstrating that the holding current changes were not caused by rundown. The amplitude of the tonic current in each condition was calculated by measuring the difference (I∆) between the current during the last 120 s of GAT inhibitor applied alone or together, and the last 120 s of current before inhibitor application. SKF-89976A alone induced a tonic current I∆ = −3.7 ± 2.4 pA: inward current increased from −18.7 ± 2.3 to −22.4 ± 3.5 pA and was not significantly different from control (P = 0.83, n = 12, one-way ANOVA). After SNAP-5114 was added to the solution containing SKF-89976A, the inward current increased to −87.1 ± 8.3 pA (I∆ = −68.4 ± 6.9 pA, n = 10) and was significantly different from the baseline current and the current during SKF-89976A application (F2,31 = 58.1; Fcrit = 3.3, P < 0.001, one-way ANOVA with Tukey’s HSD post hoc test; Fig. 5, A and C). The holding current returned to the baseline level after gabazine application. The tonic current was activated with a 4.8 ± 0.8-min delay after subsequent SNAP-5114 application and reached the maximal amplitude in 20.7 ± 0.8 min (n = 10; Fig. 5, D and E). During SKF-89976A application RMS noise did not change (2.0 ± 0.1 vs. 2.1 ± 0.2 pA in control; P = 0.99, n = 12, one-way ANOVA). Subsequent SNAP-5114 application significantly increased RMS noise to 3.1 ± 0.3 pA (F2,31 = 8.1; Fcrit = 3.3, one-way ANOVA, P < 0.01).
Fig. 5.

Parameters of the tonic current recorded from SCN neurons depended on the sequence of application of GAT1 and GAT3 inhibitors. A: GAT1 inhibitor SKF-89976A (SKF; 100 µM) was applied before GAT3 inhibitor SNAP-5114 (SNAP; 100 µM). Horizontal lines over the recording mark the time of drug application. SKF alone produced minor changes from the baseline. Simultaneous inhibition of both GAT1 and GAT3 induced a strong GABAAR-mediated inward tonic current inhibited by gabazine (Gbz; 10 µM). At right, Gaussian fits to all-points histograms derived from the last 120 s of the recording periods (control, SKF, and SKF+SNAP). The changes of the magnitude of the tonic current are denoted by dashed lines, and the differences between the Gaussian means are shown. B: SNAP was applied before SKF. SNAP produced minor changes from the baseline. Subsequent application of SKF activated a significant inward tonic current. C: tonic current (pA) during application of SKF (n = 12) and SNAP (n = 10) alone and significant changes of tonic current amplitude during application of GAT inhibitors in sequence: SNAP+SKF (n = 9) and SKF+SNAP (n = 10), 100 µM each. D: onset time of the tonic current during sequential application of GAT inhibitors. E: the time required to achieve the maximal tonic response during sequential application of GAT inhibitors. Data were analyzed by one-way ANOVA. **P < 0.01; ***P < 0.001, NS, nonsignificant changes. Thus, when the complementary transporter was blocked, inhibition of GAT1 induced the tonic current much faster (the onset time and time to maximal effect were shorter) than GAT3. The rest of the notations are the same as in Fig. 3.
In the second set of experiments (ZT21–ZT24), SNAP-5114 (100 µM) was applied before SKF-89976A (100 µM). Recordings were conducted in the following sequence: control, application of SNAP5114, followed by SNAP+SKF and then gabazine. SNAP-5114 alone induced a nonsignificant increase of the holding current from −15.6 ± 2.8 pA in control to −18.6 ± 2.7 pA (I∆ = −3.0 ± 1.2 pA; P = 0.93, n = 10, one-way ANOVA). After subsequent SKF-89976A application, the inward current increased to −93.1 ± 10.5 pA (I∆ = −77.5 ± 9.6 pA, n = 9) and was significantly different from baseline current and the current during SNAP-5114-only application (F2,26 = 50.2; Fcrit = 3.4, P < 0.001, one-way ANOVA; Fig. 5, B and C). The holding current returned to the baseline level after gabazine application. The tonic current appeared with 1.2 ± 0.1-min delay following the addition of SKF-89976A and reached the maximal amplitude in 11.3 ± 2.9 min (n = 9; Fig. 5, D and E). During SNAP-5114 application, RMS noise did not change (1.9 ± 0.1 vs. 1.9 ± 0.1 pA in control; P = 0.997, n = 10, one-way ANOVA). Subsequent SKF-89976A application significantly increased RMS noise to 3.6 ± 0.3pA (F2,25 = 24.2; Fcrit = 3.4, one-way ANOVA, P < 0.001). Thus coapplication of GAT1 and GAT3 inhibitors induced a significant GABAAR-mediated tonic current and increased RMS noise.
These data indicate that the activity of GAT1 and GAT3 are complementary and can compensate for the inhibition of each other. The difference between tonic currents (I∆) induced by SKF-89976A or SNAP-5114 applied alone was not significant (P = 0.99, one-way ANOVA; Fig. 5C). The amplitude of the tonic current during coapplication of SKF-89976A and SNAP-5114 was not dependent on the sequence of their application and was not significantly different in either experiment (P = 0.44, one-way ANOVA). It is of interest that the tonic current activation caused by the GAT inhibitors was very slow, presumably reflecting the slow buildup of the extracellular GABA concentration. The slow onset of the tonic current was not due to the rate of bath perfusion, because neurons responded much faster to bath-applied gabazine (10 µM: 10.4 ± 0.9 s, n = 13), NA (10 mM: 31.9 ± 1.7 s, n = 11), or GABA (250 µM: 26.6 ± 1.8 s, n = 14). The onset of the tonic current and the time required to reach the maximum amplitude were critically dependent on the sequence of GAT inhibitor application. The tonic current turned on faster (F2,29 = 32.9, Fcrit = 3.3, P < 0.001, one-way ANOVA; Fig. 5D) and reached a maximum amplitude sooner (F1,17 = 10.7, Fcrit = 4.5, P < 0.004; Fig. 5E) when the GAT1 inhibitor was preceded by GAT3 inhibition, compared with experiments when GAT3 inhibition preceded GAT1 inhibition.
Thus the complementary functions of the transporters ensure the stability of the extracellular GABA concentration. The value of the onset and the rise time to the maximal amplitude of the tonic current depended on the sequence of transporter inhibition and reflect the functional properties of transporters, which are closely linked to their expression and location.
Effect of GAT inhibitors on sGPSC recorded from SCN neurons.
Pharmacologically isolated GABAAR-mediated sGPSC were recorded. The activation of GABABRs did not affect the postsynaptic membrane conductance in our recording configuration (see methods). Also, GABABR-mediated slow IPSCs or slow IPSPs were not detected in the SCN (Chen and van den Pol 1998; Kim and Dudek 1992). Gabazine (10 µM) completely blocked sGPSC in SCN, and no evidence of glycine sIPSC was found (1–10 µM strychnine did not affect sIPSC; data not shown).
The peak amplitude, rise time (10–90%), and decay time constant (tau) of sGPSC were analyzed in the two sets of experiments described above during SKF-89976A (100 µM) and SNAP-5114 (100 µM) application. The sGPSC parameters were compared before and after GAT inhibitor application, and Friedman’s test with Wilcoxon post hoc analysis and Bonferroni corrections was applied to determine significant changes.
GAT1 inhibition by SKF-89976A alone did not produce statistically significant changes in the peak amplitude, rise time, or decay time constant (Fig. 6, A, D, G, J). The mean sGPSC amplitude was 48.8 ± 9.4 pA in control and 40.8 ± 3,7 pA during SKF-89976A application (P = 0.18, n = 12). The rise time was 3.3 ± 0.3 ms in control and 3.1 ± 0.3 ms during SKF-89976A (P = 0.18, n = 12). The decay time constant was 18.0 ± 0.9 ms in control and 16.8 ± 1.0 ms during SKF-89976A (P = 0.084, n = 12). Subsequent SNAP application significantly altered all three sGPSC parameters. The sGPSC amplitude decreased 53.0% from 48.9 ± 10.8 pA in control to 23.0 ± 3.3 pA during SKF+SNAP application (P < 0.005 for control and P < 0.005 for SKF-89976A, n = 10). The rise time increased 45.9% from 3.4 ± 0.3 ms in control to 5.0 ± 0.4 ms during SKF+SNAP (P < 0.005 for control and P < 0.005 for SKF-89976A, n = 10). The decay time constant decreased 35.6% from 17.6 ± 0.9 ms in control to 11.3 ± 0.9 ms during SKF+SNAP (P < 0.007 for control and P < 0.005 for SKF-89976A, n = 10).
Fig. 6.

Effect of GAT1 and GAT3 inhibitors on sGPSC recorded in the SCN. A–L: changes in sGPSC parameters during single or joint SKF-89976A (SKF; 100 µM) and SNAP-5114 (SNAP; 100 µM) or nipecotic acid (NA; 2 mM) application. A, D, G, J: control, SKF (n = 12), and SKF+SNAP (n = 10). B, E, H, K: control, SNAP (n = 10), and SNAP+SKF (n = 9). C, F, I, L: control and NA (n = 12). A–C: sGPSC recordings (each trace represents the average of 10 sGPSC recorded at each condition). D–F: amplitude. G–I: rise time (10–90%). J–L: decay time constant (tau). The sGPSC parameter changes between conditions are shown on the line graphs, which represent mean data for each recorded neuron (SE, which ranged from 4 to 6% of the mean, is not shown to make image clearer).
GAT3 inhibition by SNAP5114 alone did not significantly alter the sGPSC parameters (Fig. 6, B, E, H, K). The sGPSC amplitude was 40.8 ± 5.2 pA in control and 41.7 ± 9.6 pA during SNAP-5114 application (P = 0.17, n = 10). The rise time was 3.2 ± 0.3 ms in control and 3.3 ± 0.4 ms during SNAP-5114 (P = 0.36, n = 10). The decay time constant was 18.7 ± 1.3 ms in control and 19.7 ± 1.1 ms during SNAP-5114 (P = 0.31, n = 10). Subsequent SKF-89976A application significantly changed sGPSC parameters. The sGPSC amplitude decreased 46.4% from 40.9 ± 5.8 pA in control to 21.9 ± 4.2 pA during SNAP+SKF application (P < 0.015 for control and P < 0.008 for SNAP-5114, n = 9). The rise time increased 59.1% from 3.1 ± 0.3 ms in control to 5.0 ± 0.3 ms during SNAP+SKF (P < 0.011 for control and P < 0.007 for SNAP, n = 9). The decay time constant decreased 47.5% from 18.7 ± 1.4 ms in control to 9.8 ± 0.9 ms during SNAP+SKF (P < 0.011 for control and P < 0.008 for SNAP-5114, n = 9).
NA (2 mM), which induced a near-maximal GABAAR-mediated tonic current, produced more variable changes in the sGPSC parameters (Fig. 6, C, F, I, L). The mean amplitude of sGPSC was not significantly altered (62.6 ± 9.7 pA in control and 45.9 ± 7.3 pA during NA application, P = 0.19, n = 12). The rise time increased 82.6% from 2.7 ± 0.2 ms in control to 5.0 ± 0.4 ms during NA (P < 0.001, n = 12). The mean decay time constant was also not altered (15.1 ± 1.0 ms in control and 14.3 ± 0.7 ms during NA, P = 0.26, n = 12).
GABA uptake inhibition did not change the overall expression of GAT.
The electrophysiological data demonstrated that the inhibition of one GAT subtype activated the other transporter, which compensated for the GABA uptake deficiency. We hypothesized that this compensation could occur because of either an increased expression of the complementary transporter, or an increase of its activity, or both. We then performed experiments to determine if application of an inhibitor for one transporter subtype would affect the expression of one or both transporters.
Coronal brain slices were preincubated in ACSF containing one of the GAT inhibitors, which were dissolved in the ACSF to the final concentrations right before an experiment. GAT protein expression was compared between control samples preincubated in ACSF (control), in ACSF with GAT inhibitor, or in ACSF containing vehicle (only DMSO or ethanol in the concentration, which was used to dissolve the GAT inhibitor). The expression of GAT proteins was determined by Western blot (see methods). Application of GAT1 inhibitors SKF-89976A or NNC-711 did not change the expression of GAT1 or GAT3 in the hypothalamus (Fig. 7). The GAT3 inhibitor SNAP-5114 also did not significantly change the GAT1 or GAT3 expression (Fig. 8). Neither ethanol nor DMSO significantly affected the expression of the GAT proteins. In a separate set of experiments where the SCN was dissected, application of SNAP-5114 also did not significantly change the expression of GAT3 (Fig. 9).
Fig. 7.

GAT1 inhibitors SKF-89976A and NNC-711 did not affect the expression of GAT1 and GAT3 in the hypothalamus. Brain slices were incubated for 5–7 h in ACSF containing SKF-89976A (SKF; 100 µM) dissolved in DMSO (0.1% final) or NNC-711 (NNC; 5 µM) dissolved in water. The brain tissue was then processed for Western blot analysis. A and B: effect of SKF; n = 6 triplicates: control, DMSO (vehicle), and SKF. C and D: effect of NNC-711; n = 8 duplicates: control and NNC-711. Bands above graphs show GAT1 (A and C) or GAT3 (B and D) expression and loading control (GAPDH). +Control, positive controls (cerebral cortex for GAT1 and thalamus for GAT3). The optical density of bands was quantified with ImageJ for each gel, normalized to the loading control, and shown as a ratio to control on bar graphs (means ± SE; one-way ANOVA, Tukey HSD post hoc test or t-test; NS, nonsignificant changes). GAT1 inhibitors did not change the expression of either GAT [A: F2,15 = 0.73 (Fcrit = 3.68), P = 0.50; B: F2,15 = 0.56 (Fcrit = 3.68), P = 0.59; C: F1,14 = 8E-05 (Fcrit = 4.60), P = 0.99; D: F1,14 = 1.43 (Fcrit = 4.60), P = 0.25]. DMSO did not significantly affect the expression of the GAT proteins.
Fig. 8.

GAT3 inhibitor SNAP-5114 did not affect the expression of GAT1 and GAT3 in the hypothalamus. GAT expression in hypothalamic tissue is shown after brain slices were preincubated in ACSF containing SNAP-5114 (SNAP; 100µM) dissolved in DMSO, 0.1% final (A and B), or in ethanol, 0.2% final (C and D). A and C: GAT1 expression. B and D: GAT3 expression. The samples were analyzed in triplicate: control, vehicle (DMSO or ethanol), and GAT inhibitor (A: n = 6 triplicates; B: n = 9 triplicates; C: n = 6 triplicates; D: n = 12 triplicates). Bands above graphs show SNAP did not change the expression of either GAT [A: F2,15 = 0.06 (Fcrit = 3.68), P = 0.94; B: F2,24 = 0.32 (Fcrit = 3.40), P = 0.73; C: F2,15 = 1.77 (Fcrit = 3.68), P = 0.20; D: F2,33 = 0.78 (Fcrit = 3.29), P = 0.47 (one-way ANOVA; NS, nonsignificant changes)]. The solvents did not significantly affect the GAT proteins expression, except for one case with ethanol (*P < 0.05). The rest of the notations are the same as in Fig. 7.
Fig. 9.
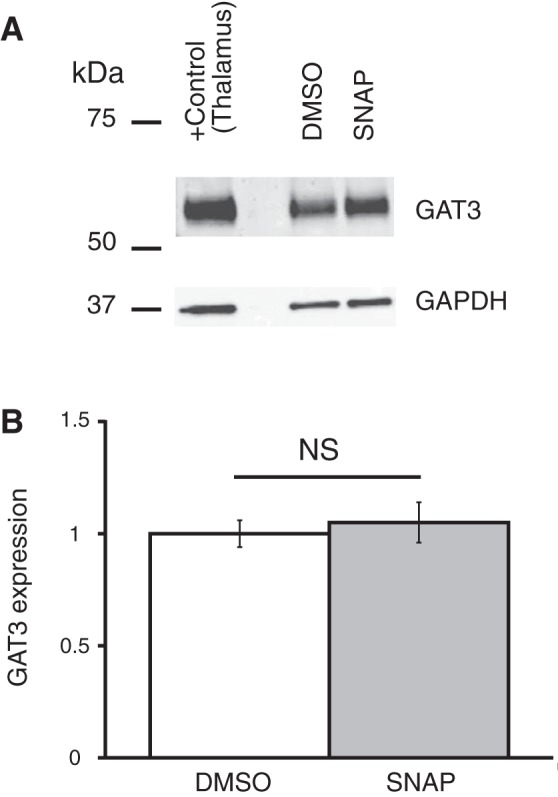
GAT3 inhibitor SNAP-5114 did not affect the expression of GAT3 in SCN. GAT3 expression in the SCN is shown after brain slices were preincubated in ACSF containing SNAP-5114 (SNAP; 100 µM) dissolved in DMSO, 1% final [n = 4 duplicates: vehicle (DMSO) and SNAP]. A: bands from Western blot. B: SNAP did not change the expression of GAT3 in the SCN [F1,6 = 0.21 (Fcrit = 5.99), P = 0.66]. The rest of the notations are the same as in Fig. 7.
Inhibition of GAT1 and GAT3 alters the circadian period of Per1 expression in the SCN.
To determine the role that the GAT play in regulating the activity of the circadian clock, we prepared brain slice cultures from Per1:Luc rats and applied the GAT inhibitors. Control experiments consisted of the application of DMSO in a concentration equivalent to that present in the solution containing GAT inhibitors. The bioluminescence of the SCN slices was monitored for at least 4 days, and then the cultures were placed in media containing either SKF+SNAP (50 µM each), SKF+SNAP (25 µM each), or DMSO (0.1% or 0.05%). The activity was monitored for an additional 3 days. In the presence of SKF+SNAP (50 µM each), the circadian period was significantly reduced by 1.36 h (24.94 ± 0.47 h pretreatment vs. 23.59 ± 0.35 h in SKF+SNAP, n = 7, P < 0.021, paired t-test; Fig. 10, A and B). In contrast, the circadian period was not altered by SKF+SNAP (25 µM each) (24.94 ± 0.17 h pretreatment vs. 24.58 ± 0.24 h in SKF+SNAP, n = 5, P = 0.362, paired t-test; Fig. 10B). Neither 0.1% nor 0.05% DMSO had an effect on the circadian period (25.10 ± 0.40 h pretreatment vs. 25.1 ± 0.35 h in DMSO 0.1%, n = 3, P = 1.0, paired t-test; and 24.80 ± 0.15 h pretreatment vs. 24.72 ± 0.29 h in DMSO 0.05%, n = 6, P = 0.49 paired t-test).
Fig. 10.

Inhibition of GAT1 and GAT3 alters the circadian period of Per1 expression. A: representative bioluminescent records from the SCN of Per1:Luc cultured brain slices before and after application of SKF-89976A and SNAP-5114 (SKF+SNAP, 50 µM each; gray trace) or vehicle (DMSO, 0.1% final; black trace). The gray bar indicates the duration of application of the test agents. B: histogram of the circadian periods (means ± SE) measured before, during treatment with DMSO (0.1%), or during coapplication (SKF+SNAP, 50 µM each). *P < 0.021, paired t-test. Numbers in bars indicate number of neurons recorded.
DISCUSSION
GABA released from axon terminals acts on synaptic GABAARs to produce postsynaptic currents that have a rapid onset and rapid offset and that desensitize in the continued presence of GABA (Glykys and Mody 2007a; Mody and Pearce 2004). Once released, GABA diffuses from the synaptic cleft, where it acts on extrasynaptic GABAARs, and is taken up from the extracellular space by specific sodium-chloride-dependent GAT (Attwell et al. 1993; Cavelier et al. 2005; Richerson and Wu 2003), which in the SCN were detected exclusively in astrocytes (Moldavan et al. 2015). The extrasynaptic GABAARs, which have high affinity for GABA and show little or no desensitization, mediate a tonic current (Mody 2001; Mody and Pearce 2004). The GABAAR-mediated tonic current has been proposed to serve as a signal for general network activity (Cope et al. 2005; Glykys and Mody 2007b; Möhler 2006). The amplitude of the tonic current is dependent on the amount of GABA released and the rate of GABA uptake. In a LD cycle, GABA content peaks in early night (ZT13–ZT16) (Aguilar-Roblero et al. 1993), but in constant dim light, the GABA concentration peaks earlier, during subjective day (CT 6) (Ikeda et al. 1997), similar to the peak of GABA content observed in the hypothalamus (ZT1–ZT5) (Cattabeni et al. 1978). In the SCN, GAT are located in astrocytes (Moldavan et al. 2015) and, as shown above, regulate the magnitude of the GABAAR-mediated tonic and synaptic currents. Our data demonstrate that a reduction in GABA uptake increases the extracellular GABA concentration and could alter circadian clock function by increasing the tonic current and altering synaptic GABAAR-mediated currents. We hypothesize that the increased GABA content during the subjective day could reflect decreased GAT activity. Thus the decrease of GAT activity can compensate for the level of moderate synaptic GABAergic activity during the day, which peaks at the end of the light phase and the early night (ZT11–ZT15) (Itri et al. 2004). Deletion of Bmal1 in astrocytes reduces GABA uptake and disrupts circadian activity an effect that can be rescued by a GABAA receptor antagonist (Barca-Mayo et al. 2017). Together, these data support the hypothesis that astrocytes are an important regulator of the activity in the SCN neural network.
The accumulation of extracellular GABA during coapplication of SNAP-5114 and SKF-89976A (50 µM each) significantly reduced the circadian period by 1.4 h. These data are consistent with a role for extrasynaptic GABAARs in regulating the activity of the SCN neural network and the timing of the circadian clock, and show an important role of GAT in maintaining extracellular GABA concentration to ensure smooth functioning of circadian clock (Ehlen and Paul 2009; Hummer et al. 2015). Computer simulations of GABAergic neurotransmission in the SCN suggest different roles for synaptic and tonic GABA signaling (DeWoskin et al. 2015). In this model, the synaptic currents do not contribute to synchronization of the circadian clocks of individual SCN neurons. In contrast, the tonic GABA current regulates the excitability of the SCN neurons, shifts the timing of molecular rhythms, and alters the synchrony between individual cellular oscillators. A long-duration increase of the tonic current phase shifts SCN neurons. The shape of the phase-response curve is dependent on whether GABA is acting as an excitatory or inhibitory neurotransmitter (DeWoskin et al. 2015). In Syrian hamsters, activation of extrasynaptic GABAARs, which mediate the tonic GABA current, phase-delayed the circadian clock in the early night but not in the late night or during the day (Walton et al. 2017). The authors suggested that a balance between the expression of synaptic and extrasynaptic GABAARs contributed to the rhythm in GABA signaling. Activation of both of them phase-shifted the circadian clock only during the day, suggesting that synaptic GABAARs are important for circadian clock function during the day (Walton et al. 2017). Our recordings revealed a significant role for astrocytic GAT1 and GAT3 in synergistic regulation of synaptic and tonic GABAAR-mediated currents and the phase shifts of Per1 expression in the SCN by ambient GABA, the concentration of which was increased during GAT inhibition.
In the SCN, GABA accumulating during application of GAT inhibitors activated extrasynaptic GABAARs and induced a tonic current that was completely blocked by gabazine. Inhibition of either GAT1 or GAT3 alone produced only small GABAAR-mediated tonic currents. In contrast, inhibition of both GAT1 and GAT3 induced a significant tonic current. These data indicate that GAT1 and GAT3 activity complement each other to take up GABA or can substitute for each other when one of the transporters has been blocked. The expression and localization of GAT1 and GAT3 in astrocyte processes surrounding perikarya and axodendritic synapses are a sound basis for cooperation of the transporters and serve to “protect” SCN neurons from excessive GABA influence (Moldavan et al. 2015). Our recordings from SCN in brain slices demonstrated that the saturation and half-maximal effective concentrations (EC50) for bath-applied GABA were much higher than in dissociated SCN cell culture (1.5 mM and EC50 = 120.3 µM vs. 100 µM and EC50 = 5.3 µM, respectively) (Kawahara et al. 1993). This could be explained by the higher density of astrocytes expressing GAT and, therefore, a much stronger GABA uptake in the brain slice, than in the cell culture (Moldavan et al. 2015). SKF-89976A and SNAP-5114 inhibited GABAAR-mediated tonic current with an IC50 of 32.6 and 79.0 µM, respectively. The specified EC50 value was much higher than that estimated during measurements of [3H]GABA uptake, when these GAT inhibitors were applied (Bernstein and Quick 1999; Borden et al. 1994a, 1994b). To resolve this issue, the following arguments can be proposed. By recording GABAAR-mediated tonic current, we provided an indirect measurement of GAT inhibitors actions on GABA uptake. GABAAR-mediated tonic current is activated by extrasynaptic GABA accumulating during blockade of GAT and not by a direct effect of GAT inhibitors on GABAARs (Isaacson et al. 1993, shown for GAT1). The following factors can influence the tonic current during application of GAT inhibitors to the brain slices. 1) The tonic current is dependent on the extracellular GABA concentration and the subunit composition of extrasynaptic GABA receptors, which defines their affinity to GABA. 2) The tonic current could be limited by desensitization of extrasynaptic GABAARs. 3) Activation of presynaptic GABABRs by accumulating GABA during application of GAT inhibitors may inhibit GABA release, decreasing spillover and, therefore, decreasing tonic current. 4) The cloned transporters may have different properties compared with natural transporters in slices, and their function may depend on the animal species. 5) The intracellular/extracellular expression of GAT in the cell culture could be different than in hypothalamic slices containing SCN. GAT1 and GAT3 are able to complement each other’s activity because of their overlapping expression in the SCN and functional interchangeability (Moldavan et al. 2015). However, other compensator mechanisms, which depend on the expression rate of the transporters, may also contribute. We used Western blot analysis to determine if blocking one subtype of transporter changed its own expression or increased the expression of the other subtype. Inhibition of one GAT subtype did not change either the expression of the complementary GAT or the expression of the targeted GAT. Our data indicate that compensation occurs because of an increase in the functional activity of the complementary GAT, and not an increase in its expression. An additional possibility is that compensation may occur due to a change of the ratio of surface vs. cytoplasmic expression of the complementary GAT (Brickley and Mody 2012; Chiu et al. 2002; Deken et al. 2003). This mechanism is suggested by the observation that an increase of extracellular GABA concentration upregulates GABA transport by GAT1 and slows transporter internalization (Bernstein and Quick 1999).
NA, a nonselective GAT inhibitor, induces GABA release due to heteroexchange: the influx of one molecule of NA induces the release of one molecule of GABA and eventually blocks GABA transport (Honmou et al. 1995; Richerson and Wu 2003). This leads to a rapid efflux of GABA, which produces a concentration-dependent GABAAR-mediated transient current followed by a tonic current. The amplitude of the sustained tonic current at saturating NA concentrations was about twice those during coapplication of selective GAT1 and GAT3 inhibitors (~130 and ~70 pA, respectively). Unlike NA, during coapplication of selective GAT inhibitors, ambient GABA slowly accumulates, mainly because of synaptic release and, to a lesser extent, nonvesicular release (Kersanté et al. 2013), and produces a slowly activating tonic current that may take up to 20 min to reach a steady state. The onset of the tonic current and the time to the maximal response were shorter when GAT3 was inhibited before GAT1 and longer if the transporters were inhibited in the opposite sequence. The slow onset of the tonic current reflects the time course of diffusion of synaptically released GABA in the extracellular matrix due to diffusion-limiting factors and the accumulation of extracellular GABA required to activate the extrasynaptic GABAARs (Nicholson and Syková 1998; Zoli and Agnati 1996). It is unlikely that the slow onset of the tonic current was due to slow penetration of GAT1 inhibitor into the slice, because SKF-89976A quickly inhibited GABA transport in isolated horizontal cells of the catfish retina during brief GABA applications (Takahashi et al. 1995) and affected the responses to brief iontophoretic pulses of GABA with a 1-min onset period in hippocampal slices (Isaacson et al. 1993). The slow activation of the tonic current induced by selective GAT inhibitors is not due to technical issues, because bath-applied GABA or NA rapidly activated GABAARs and bath-applied gabazine produced rapid inhibition of GABAARs. The concentration-dependent saturation of the amplitude of tonic current induced by coapplication of selective GAT inhibitors may reflect the natural limitations of GABA release and the number and rate of desensitization of extrasynaptic GABAARs (Bright et al. 2011; Lagrange et al. 2007). GAT inhibitor application significantly increased the RMS noise, which reflects an activation extrasynaptic GABAARs (Mtchedlishvili and Kapur 2006).
Inhibition of GABA uptake also affected the sGPSC. The increased extrasynaptic GABA during inhibition of GAT decreased the amplitude and the decay time constant and increased the rise time of sGPSC in SCN neurons. The decreased sGPSC amplitude was likely caused by an elevation of the synaptic GABA concentration and subsequent desensitization, internalization, and occupancy of synaptic GABAARs (Chaumont et al. 2013; Overstreet et al. 2000; Tehrani and Barnes 1991). The largest sGPSC parameter changes were observed during coapplication of GAT inhibitors, indicating a synergistic regulation of GABA uptake at perisynaptic sites. Our data are in good correspondence with findings that GAT inhibitors decreased the amplitude of IPSCs in hippocampus (Isaacson et al. 1993; Overstreet et al. 2000). In contrast to SCN, the inhibition of GABA uptake prolonged the decay time of spontaneous and evoked IPSCs in other brain regions (Isaacson et al. 1993; Jin et al. 2011; Keros and Hablitz 2005).
Thus our recordings reveal the important role of GAT1 and GAT3 transporters in synergistic modulation of synaptic and tonic GABAARs-mediated currents and the phase shift of the circadian Per1 gene expression in the SCN when the ambient concentration of GABA was increased during inhibition of GAT.
GRANTS
This work was supported by National Institute of Neurological Disorders and Stroke Grant NS036607 (to C. N. Allen).
DISCLOSURES
No conflicts of interest, financial or otherwise, are declared by the authors.
AUTHOR CONTRIBUTIONS
M.G.M. and C.N.A. conceived and designed research; M.G.M. and O.C. performed experiments; M.G.M. and O.C. analyzed data; M.G.M. and C.N.A. interpreted results of experiments; M.G.M. and C.N.A. prepared figures; M.G.M. drafted manuscript; M.G.M., O.C., and C.N.A. edited and revised manuscript; M.G.M., O.C., and C.N.A. approved final version of manuscript.
ACKNOWLEDGMENTS
The Per1:Luc rats were a kind gift from Dr. Hajime Tei and Dr. Erik Herzog. Dr. Lauren Hablitz provided expert guidance during the analysis of the luciferase experiments.
REFERENCES
- Ade KK, Janssen MJ, Ortinski PI, Vicini S. Differential tonic GABA conductances in striatal medium spiny neurons. J Neurosci 28: 1185–1197, 2008. doi: 10.1523/JNEUROSCI.3908-07.2008. [DOI] [PMC free article] [PubMed] [Google Scholar]
- Aguilar-Roblero R, Verduzco-Carbajal L, Rodríguez C, Mendez-Franco J, Morán J, de la Mora MP. Circadian rhythmicity in the GABAergic system in the suprachiasmatic nuclei of the rat. Neurosci Lett 157: 199–202, 1993. doi: 10.1016/0304-3940(93)90736-5. [DOI] [PubMed] [Google Scholar]
- Albus H, Vansteensel MJ, Michel S, Block GD, Meijer JH. A GABAergic mechanism is necessary for coupling dissociable ventral and dorsal regional oscillators within the circadian clock. Curr Biol 15: 886–893, 2005. doi: 10.1016/j.cub.2005.03.051. [DOI] [PubMed] [Google Scholar]
- Aton SJ, Huettner JE, Straume M, Herzog ED. GABA and Gi/o differentially control circadian rhythms and synchrony in clock neurons. Proc Natl Acad Sci USA 103: 19188–19193, 2006. doi: 10.1073/pnas.0607466103. [DOI] [PMC free article] [PubMed] [Google Scholar]
- Attwell D, Barbour B, Szatkowski M. Nonvesicular release of neurotransmitter. Neuron 11: 401–407, 1993. doi: 10.1016/0896-6273(93)90145-H. [DOI] [PubMed] [Google Scholar]
- Barca-Mayo O, Pons-Espinal M, Follert P, Armirotti A, Berdondini L, De Pietri Tonelli D. Astrocyte deletion of Bmal1 alters daily locomotor activity and cognitive functions via GABA signalling. Nat Commun 8: 14336, 2017. doi: 10.1038/ncomms14336. [DOI] [PMC free article] [PubMed] [Google Scholar]
- Bernstein EM, Quick MW. Regulation of γ-aminobutyric acid (GABA) transporters by extracellular GABA. J Biol Chem 274: 889–895, 1999. doi: 10.1074/jbc.274.2.889. [DOI] [PubMed] [Google Scholar]
- Borden LA, Dhar TG, Smith KE, Branchek TA, Gluchowski C, Weinshank RL. Cloning of the human homologue of the GABA transporter GAT-3 and identification of a novel inhibitor with selectivity for this site. Receptors Channels 2: 207–213, 1994a. [PubMed] [Google Scholar]
- Borden LA, Murali Dhar TG, Smith KE, Weinshank RL, Branchek TA, Gluchowski C. Tiagabine, SK&F 89976-A, CI-966, and NNC-711 are selective for the cloned GABA transporter GAT-1. Eur J Pharmacol 269: 219–224, 1994b. doi: 10.1016/0922-4106(94)90089-2. [DOI] [PubMed] [Google Scholar]
- Brickley SG, Mody I. Extrasynaptic GABAA receptors: their function in the CNS and implications for disease. Neuron 73: 23–34, 2012. doi: 10.1016/j.neuron.2011.12.012. [DOI] [PMC free article] [PubMed] [Google Scholar]
- Brickley SG, Revilla V, Cull-Candy SG, Wisden W, Farrant M. Adaptive regulation of neuronal excitability by a voltage-independent potassium conductance. Nature 409: 88–92, 2001. doi: 10.1038/35051086. [DOI] [PubMed] [Google Scholar]
- Bright DP, Renzi M, Bartram J, McGee TP, MacKenzie G, Hosie AM, Farrant M, Brickley SG. Profound desensitization by ambient GABA limits activation of δ-containing GABAA receptors during spillover. J Neurosci 31: 753–763, 2011. doi: 10.1523/JNEUROSCI.2996-10.2011. [DOI] [PMC free article] [PubMed] [Google Scholar]
- Cattabeni F, Maggi A, Monduzzi M, De Angelis L, Racagni G. GABA: circadian fluctuations in rat hypothalamus. J Neurochem 31: 565–567, 1978. doi: 10.1111/j.1471-4159.1978.tb02676.x. [DOI] [PubMed] [Google Scholar]
- Cavelier P, Hamann M, Rossi D, Mobbs P, Attwell D. Tonic excitation and inhibition of neurons: ambient transmitter sources and computational consequences. Prog Biophys Mol Biol 87: 3–16, 2005. doi: 10.1016/j.pbiomolbio.2004.06.001. [DOI] [PMC free article] [PubMed] [Google Scholar]
- Chaumont S, André C, Perrais D, Boué-Grabot E, Taly A, Garret M. Agonist-dependent endocytosis of γ-aminobutyric acid type A (GABAA) receptors revealed by a γ2(R43Q) epilepsy mutation. J Biol Chem 288: 28254–28265, 2013. doi: 10.1074/jbc.M113.470807. [DOI] [PMC free article] [PubMed] [Google Scholar]
- Chen G, van den Pol AN. Presynaptic GABAB autoreceptor modulation of P/Q-type calcium channels and GABA release in rat suprachiasmatic nucleus neurons. J Neurosci 18: 1913–1922, 1998. [DOI] [PMC free article] [PubMed] [Google Scholar]
- Chiu CS, Brickley S, Jensen K, Southwell A, Mckinney S, Cull-Candy S, Mody I, Lester HA. GABA transporter deficiency causes tremor, ataxia, nervousness, and increased GABA-induced tonic conductance in cerebellum. J Neurosci 25: 3234–3245, 2005. doi: 10.1523/JNEUROSCI.3364-04.2005. [DOI] [PMC free article] [PubMed] [Google Scholar]
- Chiu CS, Jensen K, Sokolova I, Wang D, Li M, Deshpande P, Davidson N, Mody I, Quick MW, Quake SR, Lester HA. Number, density, and surface/cytoplasmic distribution of GABA transporters at presynaptic structures of knock-in mice carrying GABA transporter subtype 1-green fluorescent protein fusions. J Neurosci 22: 10251–10266, 2002. [DOI] [PMC free article] [PubMed] [Google Scholar]
- Cope DW, Hughes SW, Crunelli V. GABAA receptor-mediated tonic inhibition in thalamic neurons. J Neurosci 25: 11553–11563, 2005. doi: 10.1523/JNEUROSCI.3362-05.2005. [DOI] [PMC free article] [PubMed] [Google Scholar]
- De Jeu M, Pennartz C. Circadian modulation of GABA function in the rat suprachiasmatic nucleus: excitatory effects during the night phase. J Neurophysiol 87: 834–844, 2002. doi: 10.1152/jn.00241.2001. [DOI] [PubMed] [Google Scholar]
- Deken SL, Wang D, Quick MW. Plasma membrane GABA transporters reside on distinct vesicles and undergo rapid regulated recycling. J Neurosci 23: 1563–1568, 2003. [DOI] [PMC free article] [PubMed] [Google Scholar]
- DeWoskin D, Myung J, Belle MD, Piggins HD, Takumi T, Forger DB. Distinct roles for GABA across multiple timescales in mammalian circadian timekeeping. Proc Natl Acad Sci USA 112: E3911–E3919, 2015. doi: 10.1073/pnas.1420753112. [DOI] [PMC free article] [PubMed] [Google Scholar]
- Ehlen JC, Paul KN. Regulation of light’s action in the mammalian circadian clock: role of the extrasynaptic GABAA receptor. Am J Physiol Regul Integr Comp Physiol 296: R1606–R1612, 2009. doi: 10.1152/ajpregu.90878.2008. [DOI] [PMC free article] [PubMed] [Google Scholar]
- Glykys J, Mody I. Activation of GABAA receptors: views from outside the synaptic cleft. Neuron 56: 763–770, 2007a. doi: 10.1016/j.neuron.2007.11.002. [DOI] [PubMed] [Google Scholar]
- Glykys J, Mody I. The main source of ambient GABA responsible for tonic inhibition in the mouse hippocampus. J Physiol 582: 1163–1178, 2007b. doi: 10.1113/jphysiol.2007.134460. [DOI] [PMC free article] [PubMed] [Google Scholar]
- Honmou O, Kocsis JD, Richerson GB. Gabapentin potentiates the conductance increase induced by nipecotic acid in CA1 pyramidal neurons in vitro. Epilepsy Res 20: 193–202, 1995. doi: 10.1016/0920-1211(94)00076-9. [DOI] [PubMed] [Google Scholar]
- Hummer DL, Ehlen JC, Larkin TE 2nd, McNeill JK 4th, Pamplin JR 2nd, Walker CA, Walker PV 2nd, Dhanraj DR, Albers HE. Sustained activation of GABAA receptors in the suprachiasmatic nucleus mediates light-induced phase delays of the circadian clock: a novel function of ionotropic receptors. Eur J Neurosci 42: 1830–1838, 2015. doi: 10.1111/ejn.12918. [DOI] [PMC free article] [PubMed] [Google Scholar]
- Ikeda M, Azuma S, Inoué S. Vitamin B12 enhances GABA content but reduces glutamate content in the rat suprachiasmatic nucleus. Am J Physiol Regul Integr Comp Physiol 273: R359–R363, 1997. [DOI] [PubMed] [Google Scholar]
- Irwin RP, Allen CN. GABAergic signaling induces divergent neuronal Ca2+ responses in the suprachiasmatic nucleus network. Eur J Neurosci 30: 1462–1475, 2009. doi: 10.1111/j.1460-9568.2009.06944.x. [DOI] [PMC free article] [PubMed] [Google Scholar]
- Isaacson JS, Solís JM, Nicoll RA. Local and diffuse synaptic actions of GABA in the hippocampus. Neuron 10: 165–175, 1993. doi: 10.1016/0896-6273(93)90308-E. [DOI] [PubMed] [Google Scholar]
- Isobe Y, Nishino H. GABAergic control of Arg-vasopressin release from suprachiasmatic nucleus slice culture. Brain Res 755: 213–220, 1997. doi: 10.1016/S0006-8993(97)00099-1. [DOI] [PubMed] [Google Scholar]
- Itri J, Michel S, Waschek JA, Colwell CS. Circadian rhythm in inhibitory synaptic transmission in the mouse suprachiasmatic nucleus. J Neurophysiol 92: 311–319, 2004. doi: 10.1152/jn.01078.2003. [DOI] [PMC free article] [PubMed] [Google Scholar]
- Jensen K, Chiu CS, Sokolova I, Lester HA, Mody I. GABA transporter-1 (GAT1)-deficient mice: differential tonic activation of GABAA versus GABAB receptors in the hippocampus. J Neurophysiol 90: 2690–2701, 2003. doi: 10.1152/jn.00240.2003. [DOI] [PubMed] [Google Scholar]
- Jiang ZG, Allen CN, North RA. Presynaptic inhibition by baclofen of retinohypothalamic excitatory synaptic transmission in rat suprachiasmatic nucleus. Neuroscience 64: 813–819, 1995. doi: 10.1016/0306-4522(94)00429-9. [DOI] [PubMed] [Google Scholar]
- Jin XT, Paré JF, Smith Y. Differential localization and function of GABA transporters, GAT-1 and GAT-3, in the rat globus pallidus. Eur J Neurosci 33: 1504–1518, 2011. doi: 10.1111/j.1460-9568.2011.07636.x. [DOI] [PMC free article] [PubMed] [Google Scholar]
- Kawahara F, Saito H, Katsuki H. Pharmacological characteristics of GABAA responses in postnatal suprachiasmatic neurons in culture. Neurosci Lett 160: 45–48, 1993. doi: 10.1016/0304-3940(93)90913-6. [DOI] [PubMed] [Google Scholar]
- Keros S, Hablitz JJ. Subtype-specific GABA transporter antagonists synergistically modulate phasic and tonic GABAA conductances in rat neocortex. J Neurophysiol 94: 2073–2085, 2005. doi: 10.1152/jn.00520.2005. [DOI] [PubMed] [Google Scholar]
- Kersanté F, Rowley SC, Pavlov I, Gutièrrez-Mecinas M, Semyanov A, Reul JM, Walker MC, Linthorst AC. A functional role for both γ-aminobutyric acid (GABA) transporter-1 and GABA transporter-3 in the modulation of extracellular GABA and GABAergic tonic conductances in the rat hippocampus. J Physiol 591: 2429–2441, 2013. doi: 10.1113/jphysiol.2012.246298. [DOI] [PMC free article] [PubMed] [Google Scholar]
- Kim YI, Dudek FE. Intracellular electrophysiological study of suprachiasmatic nucleus neurons in rodents: inhibitory synaptic mechanisms. J Physiol 458: 247–260, 1992. doi: 10.1113/jphysiol.1992.sp019416. [DOI] [PMC free article] [PubMed] [Google Scholar]
- Kirmse K, Kirischuk S, Grantyn R. Role of GABA transporter 3 in GABAergic synaptic transmission at striatal output neurons. Synapse 63: 921–929, 2009. doi: 10.1002/syn.20675. [DOI] [PubMed] [Google Scholar]
- Kozlov AS, Angulo MC, Audinat E, Charpak S. Target cell-specific modulation of neuronal activity by astrocytes. Proc Natl Acad Sci USA 103: 10058–10063, 2006. doi: 10.1073/pnas.0603741103. [DOI] [PMC free article] [PubMed] [Google Scholar]
- Lagrange AH, Botzolakis EJ, Macdonald RL. Enhanced macroscopic desensitization shapes the response of alpha4 subtype-containing GABAA receptors to synaptic and extrasynaptic GABA. J Physiol 578: 655–676, 2007. doi: 10.1113/jphysiol.2006.122135. [DOI] [PMC free article] [PubMed] [Google Scholar]
- Lee S, Yoon BE, Berglund K, Oh SJ, Park H, Shin HS, Augustine GJ, Lee CJ. Channel-mediated tonic GABA release from glia. Science 330: 790–796, 2010. doi: 10.1126/science.1184334. [DOI] [PubMed] [Google Scholar]
- Mody I. Distinguishing between GABAA receptors responsible for tonic and phasic conductances. Neurochem Res 26: 907–913, 2001. doi: 10.1023/A:1012376215967. [DOI] [PubMed] [Google Scholar]
- Mody I, Pearce RA. Diversity of inhibitory neurotransmission through GABAA receptors. Trends Neurosci 27: 569–575, 2004. doi: 10.1016/j.tins.2004.07.002. [DOI] [PubMed] [Google Scholar]
- Möhler H. GABAA receptor diversity and pharmacology. Cell Tissue Res 326: 505–516, 2006. doi: 10.1007/s00441-006-0284-3. [DOI] [PubMed] [Google Scholar]
- Moldavan M, Cravetchi O, Williams M, Irwin RP, Aicher SA, Allen CN. Localization and expression of GABA transporters in the suprachiasmatic nucleus. Eur J Neurosci 42: 3018–3032, 2015. doi: 10.1111/ejn.13083. [DOI] [PMC free article] [PubMed] [Google Scholar]
- Moldavan MG, Allen CN. Retinohypothalamic tract synapses in the rat suprachiasmatic nucleus demonstrate short-term synaptic plasticity. J Neurophysiol 103: 2390–2399, 2010. doi: 10.1152/jn.00695.2009. [DOI] [PMC free article] [PubMed] [Google Scholar]
- Moldavan MG, Allen CN. GABAB receptor-mediated frequency-dependent and circadian changes in synaptic plasticity modulate retinal input to the suprachiasmatic nucleus. J Physiol 591: 2475–2490, 2013. doi: 10.1113/jphysiol.2012.248047. [DOI] [PMC free article] [PubMed] [Google Scholar]
- Moldavan MG, Irwin RP, Allen CN. Presynaptic GABAB receptors regulate retinohypothalamic tract synaptic transmission by inhibiting voltage-gated Ca2+ channels. J Neurophysiol 95: 3727–3741, 2006. doi: 10.1152/jn.00909.2005. [DOI] [PubMed] [Google Scholar]
- Moore RY, Speh JC. GABA is the principal neurotransmitter of the circadian system. Neurosci Lett 150: 112–116, 1993. doi: 10.1016/0304-3940(93)90120-A. [DOI] [PubMed] [Google Scholar]
- Mtchedlishvili Z, Kapur J. High-affinity, slowly desensitizing GABAA receptors mediate tonic inhibition in hippocampal dentate granule cells. Mol Pharmacol 69: 564–575, 2006. doi: 10.1124/mol.105.016683. [DOI] [PubMed] [Google Scholar]
- Nicholson C, Syková E. Extracellular space structure revealed by diffusion analysis. Trends Neurosci 21: 207–215, 1998. doi: 10.1016/S0166-2236(98)01261-2. [DOI] [PubMed] [Google Scholar]
- Nusser Z, Mody I. Selective modulation of tonic and phasic inhibitions in dentate gyrus granule cells. J Neurophysiol 87: 2624–2628, 2002. [DOI] [PubMed] [Google Scholar]
- Overstreet LS, Jones MV, Westbrook GL. Slow desensitization regulates the availability of synaptic GABAA receptors. J Neurosci 20: 7914–7921, 2000. [DOI] [PMC free article] [PubMed] [Google Scholar]
- Park JB, Skalska S, Stern JE. Characterization of a novel tonic γ-aminobutyric acidA receptor-mediated inhibition in magnocellular neurosecretory neurons and its modulation by glia. Endocrinology 147: 3746–3760, 2006. doi: 10.1210/en.2006-0218. [DOI] [PubMed] [Google Scholar]
- Petrini EM, Marchionni I, Zacchi P, Sieghart W, Cherubini E. Clustering of extrasynaptic GABAA receptors modulates tonic inhibition in cultured hippocampal neurons. J Biol Chem 279: 45833–45843, 2004. doi: 10.1074/jbc.M407229200. [DOI] [PubMed] [Google Scholar]
- Ralph MR, Menaker M. Bicuculline blocks circadian phase delays but not advances. Brain Res 325: 362–365, 1985. doi: 10.1016/0006-8993(85)90341-5. [DOI] [PubMed] [Google Scholar]
- Richerson GB, Wu Y. Dynamic equilibrium of neurotransmitter transporters: not just for reuptake anymore. J Neurophysiol 90: 1363–1374, 2003. doi: 10.1152/jn.00317.2003. [DOI] [PubMed] [Google Scholar]
- Scimemi A. Structure, function, and plasticity of GABA transporters. Front Cell Neurosci 8: 161, 2014. doi: 10.3389/fncel.2014.00161. [DOI] [PMC free article] [PubMed] [Google Scholar]
- Sharopov S, Chen R, Sun H, Kolbaev SN, Kirischuk S, Luhmann HJ, Kilb W. Inhibition of different GABA transporter systems is required to attenuate epileptiform activity in the CA3 region of the immature rat hippocampus. Epilepsy Res 108: 182–189, 2014. doi: 10.1016/j.eplepsyres.2013.11.019. [DOI] [PubMed] [Google Scholar]
- Sipilä ST, Voipio J, Kaila K. GAT-1 acts to limit a tonic GABAA current in rat CA3 pyramidal neurons at birth. Eur J Neurosci 25: 717–722, 2007. doi: 10.1111/j.1460-9568.2007.05342.x. [DOI] [PubMed] [Google Scholar]
- Song I, Volynski K, Brenner T, Ushkaryov Y, Walker M, Semyanov A. Different transporter systems regulate extracellular GABA from vesicular and non-vesicular sources. Front Cell Neurosci 7: 23, 2013. doi: 10.3389/fncel.2013.00023. [DOI] [PMC free article] [PubMed] [Google Scholar]
- Takahashi K, Miyoshi S, Kaneko A, Copenhagen DR. Actions of nipecotic acid and SKF89976A on GABA transporter in cone-driven horizontal cells dissociated from the catfish retina. Jpn J Physiol 45: 457–473, 1995. doi: 10.2170/jjphysiol.45.457. [DOI] [PubMed] [Google Scholar]
- Tehrani MH, Barnes EM Jr. Agonist-dependent internalization of γ-aminobutyric acidA/benzodiazepine receptors in chick cortical neurons. J Neurochem 57: 1307–1312, 1991. doi: 10.1111/j.1471-4159.1991.tb08295.x. [DOI] [PubMed] [Google Scholar]
- Wagner S, Castel M, Gainer H, Yarom Y. GABA in the mammalian suprachiasmatic nucleus and its role in diurnal rhythmicity. Nature 387: 598–603, 1997. doi: 10.1038/42468. [DOI] [PubMed] [Google Scholar]
- Walton JC, McNeill JK 4th, Oliver KA, Albers HE. Temporal regulation of GABAA receptor subunit expression: role in synaptic and extrasynaptic communication in the suprachiasmatic nucleus. eNeuro 4: ENEURO.0352-16.2017, 2017. doi: 10.1523/ENEURO.0352-16.2017. [DOI] [PMC free article] [PubMed] [Google Scholar]
- Wu Y, Wang W, Díez-Sampedro A, Richerson GB. Nonvesicular inhibitory neurotransmission via reversal of the GABA transporter GAT-1. Neuron 56: 851–865, 2007. doi: 10.1016/j.neuron.2007.10.021. [DOI] [PMC free article] [PubMed] [Google Scholar]
- Yamazaki S, Numano R, Abe M, Hida A, Takahashi R, Ueda M, Block GD, Sakaki Y, Menaker M, Tei H. Resetting central and peripheral circadian oscillators in transgenic rats. Science 288: 682–685, 2000. doi: 10.1126/science.288.5466.682. [DOI] [PubMed] [Google Scholar]
- Zoli M, Agnati LF. Wiring and volume transmission in the central nervous system: the concept of closed and open synapses. Prog Neurobiol 49: 363–380, 1996. doi: 10.1016/0301-0082(96)00020-2. [DOI] [PubMed] [Google Scholar]