

Abstract
In Saccharomyces cerevisiae ethanol dissimilation is initiated by its oxidation and activation to cytosolic acetyl-CoA. The associated consumption of ATP strongly limits yields of biomass and acetyl-CoA-derived products. Here, we explore the implementation of an ATP-independent pathway for acetyl-CoA synthesis from ethanol that, in theory, enables biomass yield on ethanol that is up to 40% higher. To this end, all native yeast acetaldehyde dehydrogenases (ALDs) were replaced by heterologous acetylating acetaldehyde dehydrogenase (A-ALD). Engineered Ald− strains expressing different A-ALDs did not immediately grow on ethanol, but serial transfer in ethanol-grown batch cultures yielded growth rates of up to 70% of the wild-type value. Mutations in ACS1 were identified in all independently evolved strains and deletion of ACS1 enabled slow growth of non-evolved Ald− A-ALD strains on ethanol. Acquired mutations in A-ALD genes improved affinity—Vmax/Km for acetaldehyde. One of five evolved strains showed a significant 5% increase of its biomass yield in ethanol-limited chemostat cultures. Increased production of acetaldehyde and other by-products was identified as possible cause for lower than theoretically predicted biomass yields. This study proves that the native yeast pathway for conversion of ethanol to acetyl-CoA can be replaced by an engineered pathway with the potential to improve biomass and product yields.
Keywords: yeast, evolutionary engineering, intracellular metabolites, precursor supply, energetics, acetyl-CoA
This manuscript investigates a metabolic engineering strategy to improve the use of ethanol as a feedstock for production of bio-based fuels and chemicals with yeast.
INTRODUCTION
Introduction and optimization of heterologous pathways in industrial microorganisms by means of synthetic biology, provides viable biotechnological alternatives for petrochemistry-based production. Products from engineered microorganisms range from pharmaceuticals and pharmaceutical precursors (e.g. taxadiene and artemisinic acid) to bulk chemicals (e.g. lactate and 1, 3-propanediol) and biofuels (e.g. ethanol, isobutanol and farnesene) (Aristidou and Penttila 2000; Lee et al. 2012).
The robustness of Saccharomyces cerevisiae in industrial fermentation processes, combined with rapid developments in yeast synthetic biology, has increased its popularity as a versatile metabolic engineering and industrial production platform (Hong and Nielsen 2012). Engineered yeast strains are already capable of producing a wide range of compounds from glucose (Nevoigt 2008). Moreover, metabolic engineering has expanded its substrate range to include pentose sugars and cellobiose derived from lignocellulosic biomass (van Maris et al. 2007; Wisselink et al. 2007, 2009; Eriksen et al. 2013).
Transport and storage of lignocellulosic feedstocks are more challenging than that of sucrose, starch and starch-based sugars. The low packing density of lignocellulosic biomass, its high water content and disadvantageous rheological properties, causes high transport costs and spoilage risks (Miao et al. 2012). If lignocellulosic biomass is fermented to ethanol close to the agricultural source, this yields a compound with high energy and physical density that is, moreover, stable, pumpable, does not contain inhibitors and is essentially free of water. Ethanol might then be transported and used as a substrate for the production of wide range of fuels and chemicals in microbial processes.
In addition to efficient conversion of the lignocellulosic feedstocks to ethanol, this approach requires efficient conversion of ethanol into the desired products. S. cerevisiae can convert ethanol to a wide range of (heterologous) products of industrial interest and is naturally tolerant to high ethanol concentrations. Moreover, since ethanol is non-fermentable, ethanol-grown S. cerevisiae generally produce less by-products than sugar-grown cultures (Nielsen et al. 2013). Ethanol metabolism by S. cerevisiae is initiated by its conversion to cytosolic acetyl-CoA, which is an important precursor for a wide range of industrially relevant products. This conversion involves the concerted activity of alcohol dehydrogenase (ADH, encoded by ADH1, 2, 3, 4 and 5), acetaldehyde dehydrogenase (ALD, encoded by ALD2, 3, 4, 5 and 6) and acetyl-CoA synthetase (ACS, encoded by ACS1 and 2). Conversion of acetate to acetyl-CoA in the latter reaction involves hydrolysis of ATP to AMP and pyrophosphate, and subsequent hydrolysis of pyrophosphate makes this equivalent to hydrolysis of 2 ATP to 2 ADP and 2 Pi. This high ATP cost for acetate activation not only limits the maximum biomass yield of S. cerevisiae on ethanol but a low ATP yield from substrate dissimilation also constrains yields of products whose biosynthesis requires ATP (de Kok et al. 2012a).
Optimization of the ATP stoichiometry of cytosolic acetyl-CoA synthesis in S. cerevisiae has been intensively studied in sugar-grown cultures. Under such conditions, cytosolic acetyl-CoA is formed via the ‘pyruvate-dehydrogenase bypass’, which involves pyruvate decarboxylase (Pdc1, 5 and 6), ALD and ACS (Pronk, Steensma and van Dijken 1996). Synthesis of many cytosolic acetyl-CoA-derived compounds from glucose, including flavonoids, lipids, n-butanol, isoprenoids, artemisinic acid and fatty acids by engineered S. cerevisiae strains, has already been demonstrated (Dyer et al. 2002; Veen and Lang 2004; Shiba et al. 2007; Steen et al. 2008; Koopman et al. 2012; Chen et al. 2013; Paddon et al. 2013; Tang, Feng and Chen 2013).
Previous studies have explored strategies to increase availability of cytosolic acetyl-CoA in glucose-grown cultures, both by improving the capacity of the native yeast pathway and by expressing heterologous pathways (Shiba et al. 2007; Chen et al. 2013; Kocharin, Siewers and Nielsen 2013; Tang et al. 2013). Amongst these strategies, replacement of the native pathway for cytosolic acetyl-CoA formation with ATP-independent acetylating acetaldehyde dehydrogenase (A-ALD), pyruvate-formate lyase (PFL) or a heterologous cytosolic pyruvate dehydrogenase (PDH) complex resulted in viable yeast strains (Kozak et al. 2014a,b). Since PFL and PDH both convert pyruvate to acetyl-CoA, of these three strategies only the A-ALD-dependent pathway has, theoretically, the potential to improve the ATP efficiency of the conversion of ethanol to acetyl-CoA.
Expression of five different heterologous A-ALDs has been shown to complement the growth defect of acs1Δ acs2Δ strains on glucose (Kozak et al. 2014a). Specific growth rates on glucose of the engineered strains reached up to 79% of that of the reference strain. However, the biomass yield on glucose of the best performing A-ALD-dependent strain was 14% lower than that of the reference strain, probably due to toxic effects of elevated concentrations of acetaldehyde. However, even without the toxic effect of acetaldehyde, the benefit of the 2 ATP saved in the process of cytosolic acetyl-CoA synthesis would be difficult to demonstrate during respiratory growth of S. cerevisiae on glucose. In respiratory, glucose-grown cultures, ca. 16 ATP are formed per molecule of glucose converted to CO2 (assuming a P/O ratio of 1; Verduyn 1991) and cytosolic acetyl-CoA is only required for biosynthesis of compounds such as lipids, lysine and sterols, corresponding to a requirement of 1.04 mmol acetyl-CoA per g biomass (Flikweert et al. 1999a). Therefore, the expected increase of the biomass yield on glucose of A-ALD-dependent strains, relative to wild-type yeast, is predicted to be only 0.5%, which falls within the experimental variation of biomass yield measurements. In contrast, when ethanol serves as the sole carbon source, it is first converted to cytosolic acetyl-CoA, leading to a potential saving of two moles of ATP for every mole of ethanol that is metabolized through A-ALD instead of ALD/ACS.
This study aims to investigate the potential of A-ALD-dependent cytosolic acetyl-CoA synthesis to replace the native pathway for growth on ethanol and, thereby, to increase biomass yields on ethanol of S. cerevisiae. If successful, such a replacement would strongly increase the attractiveness of ethanol as a feedstock for the production of acetyl-CoA-derived products by yeast and other eukaryotic cell factories. To identify potential bottlenecks in this metabolic engineering strategy, a set of strains that were previously engineered for A-ALD-dependent growth on glucose (Kozak et al. 2014a) was tested for growth on ethanol as the sole carbon source. Laboratory evolution was then applied to enable and improve growth of the engineered strains on ethanol. Subsequently, the resulting strains were characterized physiologically and the genetic basis for their improved growth was studied by reverse engineering of mutations identified by whole-genome sequencing.
METHODS
Strains and maintenance
The S. cerevisiae strains used in this study (Table 1) share the CEN.PK genetic background (Entian and Kotter 2007; Nijkamp et al. 2012a). Stock cultures were grown in aerobic shake flasks on synthetic medium (Verduyn et al. 1992) containing 20 g L−1 glucose or 20 g L−1 ethanol as a carbon source. Auxotrophic requirements were complemented with synthetic yeast drop-out medium supplements (Sigma-Aldrich, St. Louis, MO, USA) or by growth in YP medium (10 g L−1 Bacto yeast extract, 20 g L−1 Bacto peptone). Carbon sources were either 20 g L−1 glucose, 20 g L−1 ethanol and/or 11.3 g L−1 sodium acetate trihydrate. For sporulation, diploid strains were pre-grown in medium containing 10 g L−1 Bacto yeast extract, 20 g L−1 Bacto peptone and 10 g L−1 potassium acetate and subsequently transferred to sporulation medium (20 g L−1 potassium acetate, pH 7.0) (Bahalul, Kaneti and Kashi 2010). Frozen stocks of S. cerevisiae and E. coli were prepared by addition of glycerol (30% v/v) to the growing shake-flask cultures and stored in 1 mL aliquots at −80°C.
Table 1.
Saccharomyces cerevisiae strains used in this study.
| Name | Relevant genotype | Origin |
|---|---|---|
| CEN.PK113-7D | MATa MAL2-8C SUC2 | P. Kötter |
| CEN.PK113-5D | MATa MAL2-8C SUC2 ura3-52 | P. Kötter |
| CEN.PK102-12A | MATa MAL2-8C SUC2 ura3-52 leu2-3,112 his3-Δ1 | P. Kötter |
| IMK354 | MATa MAL2-8C SUC2 ura3-52 leu2-3,112 his3-Δ1 | (Kozak et al. 2014a) |
| ald2-ald3::loxP-LEU2 (Kluyveromyces lactis)-loxP | ||
| ald4::loxP-HIS5 (Schizosaccharomyces pombe)-loxP | ||
| ald5::loxP-KanMX4-loxP ald6::loxP-hphNT1-loxP | ||
| IMK533 | MATa/MATα MAL2-8C/MAL2-8C SUC2/SUC2 ura3-52/ura3-52 leu2-3,112/leu2-3,112 his3-Δ1/his3-Δ1 ald2-ald3::loxP-LEU2 (K. lactis)-loxP/ald2-ald3::loxP-LEU2 (K. lactis)-loxP ald4::loxP-HIS5 (S. pombe)-loxP/ald4::loxP-HIS5 (S. pombe)-loxP ald5::loxP-KanMX4-loxP/ald5::loxP-KanMX4-loxP ald6::loxP-hphNT1-loxP/ald6::loxP-hphNT1-loxP | This study |
| IMK545 | MATa/MATα MAL2-8C/MAL2-8C SUC2/SUC2 ura3-52/ura3-52 leu2-3,112/leu2-3,112 his3-Δ1/his3-Δ1 ald2-ald3::loxP-LEU2 (K. lactis)-loxP/ald2-ald3::loxP-LEU2 (K. lactis)-loxP ald4::loxP-HIS5 (S. pombe)-loxP/ald4::loxP-HIS5 (S. pombe)-loxP ald5::loxP-KanMX4-loxP/ald5::loxP-KanMX4-loxP ald6::loxP-hphNT1-loxP/ald6::loxP-hphNT1-loxP ACS2/acs2::loxP-natNT2-loxP | This study |
| IMK546 | MATa/MATα MAL2-8C/MAL2-8C SUC2/SUC2 ura3-52/ura3-52 leu2-3,112/leu2-3,112 his3-Δ1/his3-Δ1 ald2-ald3::loxP-LEU2 (K. lactis)-loxP/ald2-ald3::loxP-LEU2 (K. lactis)-loxP ald4::loxP-HIS5 (S. pombe)-loxP/ald4::loxP-HIS5 (S. pombe)-loxP ald5::loxP-KanMX4-loxP/ald5::loxP-KanMX4-loxP ald6::loxP-hphNT1-loxP/ald6::loxP-hphNT1-loxP ACS2/acs2::loxP-natNT2-loxP ACS1/acs1::amdS | This study |
| IMK578 | MATa MAL2-8C SUC2 ura3-52 leu2-3,112 his3-Δ1 | This study |
| ald2-ald3::loxP-LEU2 (K. lactis)-loxP | ||
| ald4::loxP-HIS5 (S. pombe)-loxP ald5::loxP-KanMX4-loxP ald6::loxP-hphNT1-loxP ACS1/acs1::amdS | ||
| IMZ284 | IMK354 pUDE047 (URA3 dmpF Pseudomonas sp.) | (Kozak et al. 2014a) |
| IMZ286 | IMK354 pUD043 [URA3 mhpF E. coli (not codon-optimized)] | (Kozak et al. 2014a) |
| IMZ289 | IMK354 pUDE150 (URA3 adhE S. aureus) | (Kozak et al. 2014a) |
| IMZ290 | IMK354 pUDE151 (URA3 eutE E. coli) | (Kozak et al. 2014a) |
| IMZ291 | IMK354 pUDE152 (URA3 lin1129 L. innocua) | (Kozak et al. 2014a) |
| IMZ304 | IMZ290 acs2::loxP-natNT2-loxP | (Kozak et al. 2014a) |
| IMZ305 | IMZ304 acs1::amdS | (Kozak et al. 2014a) |
| IMS456 | IMZ284 evolved on ethanol, single colony isolate from evolution line 1 | This study |
| IMS457 | IMZ284 evolved on ethanol, single colony isolate from evolution line 2 | This study |
| IMS458 | IMZ291 evolved on ethanol, single colony isolate from evolution line 2 | This study |
| IMS459 | IMZ305 evolved on ethanol, single colony isolate from evolution line 1 | This study |
| IMS460 | IMZ305 evolved on ethanol, single colony isolate from evolution line 2 | This study |
| IMS477 | IMS457 after removal of pUD357 | This study |
| IMZ510 | IMK578 pUDE047 (URA3 dmpF Pseudomonas sp.) | This study |
| IMZ511 | IMK578 pUDE151 (URA3 eutE E. coli) | This study |
| IMZ512 | IMK578 pUDE152 (URA3 lin1129 L. innocua) | This study |
| IMZ513 | IMK578 pUDE356 (URA3 dmpFT137S) | This study |
| IMZ514 | IMK578 pUDE360 (URA3 eutE Q4_E7del) | This study |
| IMZ528 | IMK578 pUDE357 (URA3 dmpFI196L) | This study |
| IMZ529 | IMK578 pUDE359 (URA3 eutEV013D) | This study |
Molecular biology techniques and plasmids
PCR amplification with Phusion® Hot Start II High Fidelity Polymerase (Thermo Scientific, Waltham, MA, USA) was performed according to the manufacturer's manual using HPLC- or PAGE-purified, custom-synthesized oligonucleotide primers (BaseClear BV, Leiden, the Netherlands). Diagnostic PCR was done with DreamTaq (Thermo Scientific) and desalted primers (BaseClear BV). DNA fragments obtained in PCR reaction were purified using the GenElut PCR Clean-Up Kit (Sigma-Aldrich). Alternatively, when more than one PCR product was obtained, DNA fragments obtained by PCR were loaded on gels containing 1% or 2% (w/v) agarose (Thermo Scientific) and 1xTAE or 1xTBE buffer (Thermo Scientific), respectively, excised and purified (Zymoclean, D2004, Zymo Research, Irvine, CA, USA). Yeast plasmids were isolated according to Kuijpers et al. (2013). Plasmids pUDE356, pUDE357, pUDE358, pUDE359 and pUDE360 were isolated from strains IMS456, IMS457, IMS458, IMS459 and IMS460, respectively. All plasmids used in this study are listed in Table 2. Yeast genomic DNA was isolated using a YeaStar Genomic DNA kit (Zymo Research).
Table 2.
Plasmids used in this study.
| Name | Characteristics | Origin |
|---|---|---|
| YCp50-HO | CEN6ARSH6 URA3 Expression of HO for mating-type switch | (Russell et al. 1986) |
| pUG-natNT2 | Template for loxP-natNT2-loxP cassette | (de Kok et al. 2012b) |
| pUDE158 | Plasmid with amdS | (Solis-Escalante et al. 2013) |
| pUDE043 | 2μ URA3 PTDH3-mhpF (E. coli) (not codon-optimized) -TCYC1 | (Guadalupe Medina et al. 2010) |
| pUDE047 | 2μURA3 PTDH3-dmpF (Pseudomonas sp.) -TCYC1 | (Pronk et al. 2011) |
| pUDE150 | 2μ URA3 PTDH3-adhE (S. aureus) -TCYC1 | (Kozak et al. 2014a) |
| pUDE151 | 2μ URA3 PTDH3-eutE (E. coli) -TCYC1 | (Kozak et al. 2014a) |
| pUDE152 | 2μ URA3, PTDH3-lin1129 (L. innocua) -TCYC1 | (Kozak et al. 2014a) |
| pUDE356 | 2μ URA3 PTDH3-dmpFT137S (Pseudomonas sp.) -TCYC1 | This study |
| Plasmid isolated from IMS456 | ||
| pUDE357 | 2μ URA3 PTDH3-dmpFI196L (Pseudomonas sp.) -TCYC1 | This study |
| Plasmid isolated from IMS457 | ||
| pUDE358 | 2μ URA3 PTDH3-lin1129 (L. innocua) -TCYC1 | This study |
| Plasmid isolated from IMS458 | ||
| pUDE359 | 2μ URA3 PTDH3-eutEV013D(E. coli) -TCYC1 | This study |
| Plasmid isolated from IMS459 | ||
| pUDE360 | 2μ URA3 PTDH3-eutE Q4_E7del (E. coli) -TCYC1 | This study |
| Plasmid isolated from IMS460 |
Strain construction
Saccharomyces cerevisiae strains were transformed according to Gietz and Woods (2002). Knockout cassettes were obtained by PCR using primers listed in Table S1 (Supporting Information) with the templates pUDE158 (Solis-Escalante et al. 2013) or pUG-natNT2 (de Kok et al. 2012b). When the dominant marker natNT2 was used, transformants were selected on YP agar plates (2% (w/v) agar) with 100 mg L−1 nourseothricin. To select for strains containing the acetamidase marker (AmdS), agar plates with synthetic medium were used in which ammonium sulfate was replaced by 0.6 g L−1 acetamide as nitrogen source and 6.6 g L−1 potassium sulfate to compensate for sulfate. The Ald− strain IMK354, obtained as described previously (Kozak et al. 2014a), was transformed with YCp50-HO plasmid (Table 2), which resulted in diploid strain IMK533. Plasmid YCp50-HO (Russell et al. 1986) was removed by plating strain IMK533 on synthetic medium agar plates supplemented with 0.15 g L−1 uracil and 1 g L−1 5′-flouroorotic acid (Boeke, LaCroute and Fink 1984). Subsequently, one of the two alleles of both ACS1 and ACS2 were deleted, yielding strains IMK545 and IMK546, respectively (Table 1). The Ald−acs1Δ haploid strain IMK578 was obtained from the diploid IMK546 by sporulation and dissection, performed as described previously (Guadalupe-Medina et al. 2014). The genotype and ploidy of IMK578 were confirmed by PCR using diagnostic primers (Table S1, Supporting Information). IMS457 was cured from plasmid pUDE357 by plating on synthetic medium agar plates with 20 g L−1 glucose and 11.3 g L−1 sodium acetate trihydrate supplemented with 0.15 g L−1 uracil and 1 g L−1 5′-fluoroorotic acid (Boeke, LaCroute and Fink 1984), yielding strain IMS477. Transformation of IMK578 with plasmids pUDE047, pUDE151, pUDE152, pUDE356, pUDE357, pUDE359 and pUDE360 resulted in strains IMZ510, IMZ511, IMZ512, IMZ513, IMZ528, IMZ514 and IMZ529, respectively. Presence of the plasmids was confirmed by PCR using diagnostic primers (Table S1, Supporting Information).
Media and cultivation
Shake-flask cultures were grown at 30°C in 500 mL flasks containing 100 mL synthetic medium (Verduyn et al. 1992) with 20 g L−1 glucose or 20 g L−1 ethanol in an Innova incubator shaker (New Brunswick Scientific, Edison, NJ, USA) set at 200 rpm. Growth studies were performed on synthetic media (Verduyn et al. 1992) supplemented with 20 g L−1 ethanol as a sole carbon source or with 20 g L−1 ethanol and 0.68 g L−1 sodium acetate trihydrate as two carbon sources. Additionally, synthetic media in which ammonium sulfate was replaced with 6.7 g L−1 alanine and 6.6 g L−1 potassium sulfate, and with 20 g L−1 ethanol, were also used in the growth studies. Optical density at 660 nm was measured in regular time intervals with a Libra S11 spectrophotometer (Biochrom, Cambrige, UK). Ethanol-limited chemostat cultivation was carried out at 30°C in aerobic 2-L laboratory bioreactors (Applikon, Schiedam, the Netherlands) with a working volume of 1 L. The ingoing synthetic medium (Verduyn et al. 1992) contained 6 g L−1 ethanol. Culture pH was maintained at 5.0 by automatic addition of 2 M KOH. Antifoam Pluronic PE 6100 (BASF, Ludwigshafen, Germany) was used at final concentration of 0.15 g L−1. Bioreactors were sparged with 500 mL min−1 air and stirred at 800 rpm to ensure aerobic conditions. Chemostat cultivation was preceded by a batch phase under the same conditions. When a rapid decrease in CO2 production indicated ethanol depletion in the batch cultures, continuous cultivation at a dilution rate of 0.05 h−1 was initiated. Chemostat cultures were assumed to be in steady state when, after at least five volume changes, the carbon dioxide production rate changed by less than by 2% over two volume changes. Steady state samples were taken between 12 and 15 volume changes after inoculation.
Laboratory evolution
Laboratory evolution of strains IMZ284, IMZ286, IMZ289, IMZ290, IMZ291, IMZ305 was performed by serial transfer in shake-flask cultures on 100 mL of synthetic medium (Verduyn et al. 1992) containing 20 g L−1 ethanol. For each strain, at least two independent evolution experiments were performed. When growth was observed and OD at 660 nm of at least eightwas reached, 1–2 mL aliquot of the culture was transferred to a new flask until the specific growth rate of at least 0.06 h−1 was obtained. This corresponds to an average 5–6 generations per shake flask. Upon reaching this target, single colony isolates were obtained by restreaking three times on synthetic medium agar plates (Verduyn et al. 1992) containing 20 g L−1 ethanol. Three colonies from each evolution experiment were then tested for growth on 20 g L−1 ethanol. From each of the two independent evolution lines of strain IMZ284 one colony was selected, yielding strains IMS456 and IMS457, after 72 and 99 serial transfers in shake flasks, respectively. Also, from the two evolution lines of IMZ305 single colonies were stocked as strains IMS459 and IMS460, after 71 and 63 serial transfers in shake flasks, respectively. From the evolution of strain IMZ291, a single colony was stocked as strain IMS458, after 83 serial transfers in shake flasks.
Analytical methods
Dry weight measurements were performed as described by de Kok et al. (2011). Before analysis, the off-gas of the chemostat cultures was cooled in a condenser (2°C) and dried with a Perma Pure Dryer (Perma Pure LLC, Toms River, NJ, USA). CO2 and O2 concentrations in the off-gas were measured with NGA 2000 Rosemount gas analyzer (Rosemount Analytical Inc, Orrivlle, OH, USA). Ethanol concentrations were corrected for evaporation as described previously (Guadalupe Medina et al. 2010). Samples for residual ethanol determination were taken with the stainless-steel bead method for rapid quenching of metabolites (Mashego et al. 2003). HPLC analysis of the supernatant and residual nutrients was performed as described previously (de Kok et al. 2011).
Determination of intracellular metabolite concentrations
Chemostat cultures were sampled for determination of intracellular metabolite concentrations according to the cold methanol quenching method using specially designed rapid sampling setup (Lange et al. 2001). Approximately 1.2 mL of broth was sampled into 5 mL of 80% aqueous methanol (v/v) solution pre-cooled to −40°C. Subsequently, samples were washed with cold methanol followed by extraction of intracellular metabolites with boiling ethanol as described by Canelas et al. (2008). The concentrations of glucose, glucose-6-phosphate, fructose-6-phosphate, 2-phosphoglycerate, 3-phosphoglycerate, glyceraldehyde 3-phosphate, dihydroxyacetone phosphate, pyruvate, ribose-5-phosphate, ribulose-5-phosphate, xylulose-5-phosphate, sedoheptulose-7-phosphate, citrate, isocitrate, fumarate, malate, α-ketoglutarate and trehalose were determined as methoxime-trimethylsilyl derivatives by GC-MS (Cipollina et al. 2009). The concentrations of succinate, fructose-1,6-bisphosphate, 6-phosphogluconate, trehalose-6-phosphate, glucose-1-phosphate, glycerol-3-phosphate, phosphoenolpyruvate, UDP-glucose and mannitol-6-phosphate were determined by anion-exchange LC-MS/MS (Seifar et al. 2013). Concentrations of AMP, ADP, ATP, FAD, FMN, GMP, GDP, GTP, NAD+, NADH, NADPH, CoA and acetyl-CoA were determined by ion-pair reverse-phase LC-MS/MS (Van Dam et al. 2002). For all analytical platforms, uniformly 13C-labelled cell extracts were used as internal standards (Wu et al. 2005).
Acetaldehyde determination
Samples for analysis of acetaldehyde concentrations in culture broth were obtained with a rapid sampling setup (Lange et al. 2001) and processed as described by Bekers, Heijnen and van Gulik (2015). To analyze acetaldehyde content in the outlet gas of bioreactors, the off-gas was washed in two bottles, connected in series, each containing 500 mL of derivatization solution (0.9 g L−1 2,4—dinitrophenylhydrazine and 1% (v/v) phosphoric acid in acetonitrile). The concentration of acetaldehyde-2,4-dinitrophenylhydrazine (ADPH) was analyzed by HPLC as described previously (Kozak et al. 2014a). The duration of gas flushing before sampling was adjusted to reach an ADPH concentration in the first bottle that was well above the detection limit. Overloading of the derivatization capacity of the first bottle was monitored by analyzing the ADPH concentration in the second bottle.
Determination of enzymic activity of A-ALD
Culture samples (corresponding to ca. 62.5 mg dry weight) were harvested from exponentially growing shake-flask cultures on 20 g L−1 glucose or 20 g L−1 ethanol, washed, stored and prepared for sonication as described previously (Postma et al. 1989). Cell extracts were prepared by sonication (4 bursts of 30 s with 30 s intervals at 0°C) with an amplitude setting of 7–8 μm on a Soniprep 150 sonicator (Beun de Ronde BV, Abcoude, The Netherlands). After removal of cells and debris by centrifugation (4°C, 20 min at 47 000 g), the cell extract (supernatant) was used for enzyme assays. A-ALD activity in the acetyl-CoA-forming direction was measured as described previously (Kozak et al. 2014a). For determination of the KM and Vmax, the acetaldehyde concentration was varied, leaving the other compounds constant. A-ALD activity in the acetaldehyde-forming direction was assayed as described previously (Guadalupe Medina et al. 2010). Enzyme activities were expressed as μmol substrate converted per minute per mg protein. Reaction rates were proportional to the amount of cell extract added. Protein concentrations in cell extracts were determined with the Lowry method (Lowry et al. 1951).
Whole-genome and plasmid sequencing and sequence analysis
DNA samples, including genomic DNA of the strains IMK354, IMS456, IMS457, IMS458, IMS459 and IMS460, and the plasmids present in those strains pUDE356, pUDE357, pUDE358, pUDE359 and pUDE360, respectively, were prepared as described previously (de Kok et al. 2012b). For sequencing of genomic DNA, libraries of 350-bp inserts were constructed and paired-end sequenced (100 bp reads) using an Illumina HISeq 2000 sequencer (Baseclear BV, Leiden, the Netherlands). A minimum data quantity of 950 Mb was generated per strain, representing a minimum 80-fold coverage. The sequence reads of the genomic DNA were mapped onto the CEN.PK113-7D genome (Nijkamp et al. 2012a) using the Burrows–Wheeler Alignment tool (BWA) and further processed using SAMtools (Li and Durbin 2009; Li and Durbin 2010). In the case of plasmid sequencing, the previously deposited sequences (Kozak et al. 2014a) pUDE047 (Pronk, van Maris and Guadalupe Medina 2011) (for pUDE356 and pUDE357), pUDE152 (for pUDE358) and pUDE151 (for pUDE359 and pUDE360) were used as a reference. Single-nucleotide variations were extracted from the mapping using the SAMtools varFilter. Default settings were used, except that the maximum read depth was set to 400X (−D400). To minimize false positive mutation calls, custom Perl scripts were used for further mutation filtering as follows. (i) Mutation calls containing ambiguous bases in mapping consensus were filtered out. (ii) Only the single-nucleotide variations with a quality of at least 20 were kept (variant quality is defined as the Phred-scaled probability that the mutation call is incorrect (Ewing and Green 1998; Ewing et al. 1998). (iii) Mutations with a depth of coverage <10X were discarded. And (iv) updated information on the genome of S. cerevisiae CEN.PK113-7D, which was used as a high-quality reference genome in the first comparison with laboratory-evolved strains, were included in the analysis (Gonzalez-Ramos et al. 2013). Subsequently, mutations that were also found in IMK354, the last common parental strain for all evolution lines, were subtracted from the list of mutations found for in strains IMS456-IMS460, in order to exclude changes which were present before laboratory evolution experiments. Raw sequencing data of genomic DNA of strains IMK354, IMS456, IMS457, IMS458, IMS459 and IMS460, and of the corresponding plasmids pUDE356, pUDE357, pUDE358, pUDE359 and pUDE360 have been deposited as sequence read archives under bioproject PRJNA286073ID (Table 3). The copy number variation was analyzed using Magnolya (Nijkamp et al. 2012b).
Table 3.
Data structure of the deposited sequencing data of the A-ALD-dependent Ald− evolved strains IMS456, IMS457, IMS458, IMS459 and IMS460 at NCBI (http://www.ncbi.nlm.nih.gov/).
| BioProject (alias) | Strain | Biosample | Experiment | Run |
|---|---|---|---|---|
| SRP059225 (PRJNA286073) | ||||
| IMK354 | SAMN03766749/SRS957601 | SRX1054833 | SRR2058020 | |
| IMS456 | SAMN03764509/SRS956298 | SRX1052287 | SRR2054896 | |
| IMS457 | SAMN03764510/SRS956299 | SRX1052288 | SRR2054920 | |
| IMS458 | SAMN03764514/SRS956304 | SRX1052300 | SRR2054924 | |
| IMS459 | SAMN03764515/SRS956306 | SRX1052303 | SRR2054925 | |
| IMS460 | SAMN03764516/SRS956307 | SRX1052304 | SRR2054927 |
RESULTS
Theoretical prediction of the biomass yield on ethanol of an A-ALD-dependent strain
A theoretical stoichiometric analysis was performed to quantitatively predict the impact on biomass yield of rerouting ethanol metabolism through A-ALD instead of ALD/ACS. Verduyn (1991) described assimilation of S. cerevisiae biomass from ethanol, in ethanol-limited chemostat cultures grown at a dilution rate of 0.1 h−1, with the following net reaction:
 |
(1) |
Based on experimental data, Verduyn et al. (1992) estimated that at a specific growth rate of 0.1 h−1 assimilation and maintenance of 100 g biomass required 13264 mmol ATP. Part of this required ATP can be derived from oxidation of the FADH and NADH formed in assimilation, which, assuming a P/O ratio of 1, would yield 7089 mmol of ATP. The remaining 6175 mmol ATP are then derived from complete dissimilation of ethanol. When ethanol dissimilation occurs via the native ACS pathway and TCA-cycle, it yields 2 CO2, 5 NADH and 1 FADH, as well as 1 ATP from substrate-level phosphorylation in the succinyl-CoA thiokinase reaction. Taking into account the cost of 2 ATP for ACS and assuming a P/O ratio of one for oxidation of NADH and FADH, the final ATP yield of ethanol dissimilation via the ACS pathway equals 5 mol ATP per mol ethanol. The remaining amount of ATP required for biosynthesis can then be generated by dissimilating 1235 mmol ethanol (6175 divided by 5). According to this stoichiometry, synthesis of 100 g of biomass via the endogenous ACS-dependent pathway in S. cerevisiae requires 3819 mmol of ethanol (176 g), resulting in a yield of 0.57 g biomass g ethanol−1.
When ALD and ACS are replaced by A-ALD, 2 ATP are saved for each ethanol converted to acetyl-CoA. Assuming the same biomass composition and ATP requirements for biosynthesis, this reduces the ATP requirement for the synthesis of 100 g of biomass by 5168 mmol (from 13264 to 8096 mmol). Reoxidation of NADH and FADH formed in assimilation yields 7089 mmol ATP. The remaining 1007 mmol ATP can be obtained from respiratory dissimilation of 144 mmol ethanol which, in A-ALD-dependent strains, should yield 7 mol ATP per mol ethanol. Solely based on ATP stoichiometry, this analysis predicts a biomass yield of 0.80 g biomass g ethanol−1 for A-ALD-dependent S. cerevisiae, with a total ethanol requirement of 2728 mmol (126 g) for formation of 100 g biomass.
In addition to a changing ATP stoichiometry, replacing ALD/ACS with NAD+-dependent A-ALD is likely to affect NADPH generation. In their analysis resulting in Equation 1 (Verduyn 1991), assumed that the NADPH required for assimilation was obtained through balanced activity of the NADP+/NAD+-dependent ALDs and/or NADP+/NAD+-dependent isocitrate dehydrogenase (Bruinenberg, van Dijken and Scheffers 1983). However, A-ALD-dependent strains lack NADP+-dependent ALD activity. From a previous stoichiometric flux analysis comparing growth on ethanol and acetate, it was shown that during growth on acetate, when there is no flux through ALD, the flux through isocitrate dehydrogenase has the potential to provide all the required NADPH (Daran-Lapujade et al. 2004). In that scenario, changes in NADPH generation do not impact the predicted biomass yield on ethanol of A-ALD-dependent S. cerevisiae of 0.80 g biomass g ethanol−1. If, despite these predictions, a part of the NADPH is generated through combined action of the glyoxylate cycle, gluconeogenesis and the pentose phosphate pathway this will result in a lower biomass yield on ethanol. In the extreme scenario in which all NADPH is formed through the pentose phosphate pathway this decreases the predicted biomass yield for A-ALD-dependent S. cerevisiae to 0.74 g per g ethanol.
In summary, this theoretical stoichiometric analysis predicts a potential 30%–40% higher biomass yield on ethanol (0.74–0.80 g biomass g ethanol−1) in engineered A-ALD-dependent S. cerevisiae than the 0.57 g biomass g ethanol−1 of wild-type Ald+ Acs+ strains.
Laboratory evolution of Ald− A-ALD-dependent strains enables growth on ethanol
To investigate whether expression of A-ALD can functionally replace ALD/ACS during growth of S. cerevisiae on ethanol, strains without endogenous Ald− were transformed with expression vectors for five heterologous A-ALDs. Expression of each of these five A-ALDs supports near-wild-type growth rates of Ald−S. cerevisiae strains on glucose (Kozak et al. 2014a). In contrast, no growth was initially observed in shake-flask cultures on synthetic medium with 20 g L−1 ethanol for A-ALD-dependent strains IMZ284 (Ald−, expressing Pseudomonas sp. dmpF), IMZ286 (Ald−, expressing E. coli mhpF), IMZ289 (Ald−, expressing S. aureus adhE), IMZ290 (Ald−, expressing E. coli eutE), IMZ291 (Ald−, expressing L. innocua lin1129) and IMZ305 (Ald− Acs−, expressing E. coli eutE). Only after ca. 4 weeks, strains IMZ284 (Ald−dmpF), IMZ290 (Ald−eutE) and IMZ291 (Ald−lin1129) showed observable growth, which is in line with the appearance of strains containing growth enabling mutations. Strains IMZ286 (Ald−mhpF) and IMZ289 (Ald−adhE) did not show growth after eight weeks of incubation and were not studied further. Interestingly, strain IMZ305 (Ald− Acs−eutE), which also carried a double deletion of ACS1 and ACS2, grew within the first two weeks.
When after 4 weeks growth was observed, laboratory evolution experiments were performed by serial transfer of strains IMZ284, IMZ290, IMZ291 and IMZ305 in ethanol-grown shake-flask cultures. Laboratory evolution was continued until after 72 and 99, 52 and 58, 56 and 83, 63 and 71 transfers in case of the two evolution lines of strains IMZ284, IMZ290, IMZ291 and IMZ305, respectively, the cultures, which initially grew at specific growth rates lower than 0.03 h−1, reached specific growth rates of 0.06–0.11 h−1. Three single colony isolates were then obtained from each evolution line, and the isolates from each evolution line with the highest maximum specific growth rate on ethanol—IMS456 and IMS457 (evolved IMZ284), IMS458 (evolved IMZ291), IMS459 and IMS460 (evolved IMZ305) were selected for further study. Specific growth rates of these single colony isolates on ethanol, measured in shake-flask cultures, ranged between 0.07 and 0.11 h−1 (Fig. 1). The single colony isolates of evolved IMZ290 were not further investigated, since they contained the same A-ALD as IMZ305 and grew slower.
Figure 1.
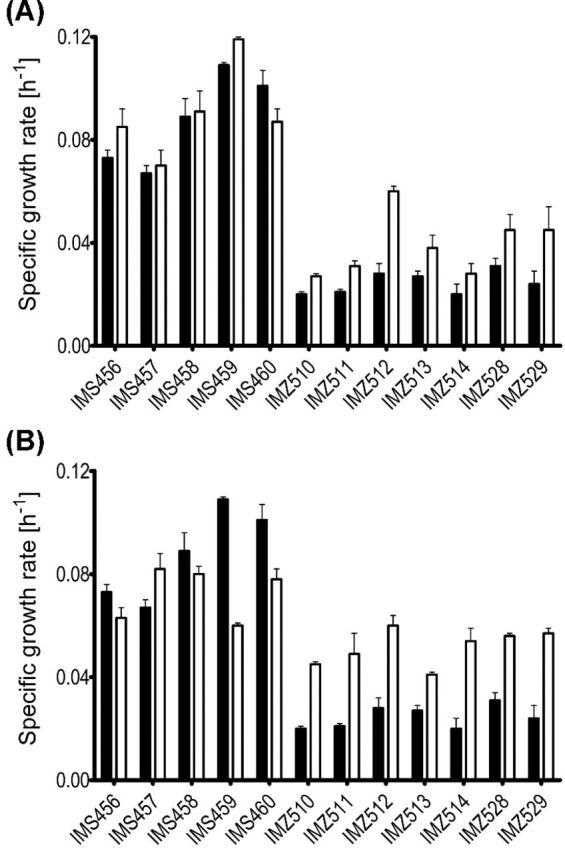
Maximum specific growth rates in synthetic medium shake-flask cultures with 20 g L−1 ethanol as the sole carbon source (black bars) and the comparison with maximum specific growth rates on synthetic medium with 20 g L−1 ethanol and 0.68 g L−1 sodium acetate trihydrate (white bars, panel A); or synthetic medium with 20 g L−1 ethanol as a main carbon source and 6.7 g L−1 alanine as the nitrogen source (white bars, panel B) of the A-ALD-dependent evolved strains: IMS456 (evolved Ald−dmpFT137S), IMS457 (evolved Ald−dmpFI196L), IMS458 (evolved Ald−lin1129), IMS459 (evolved Ald− Acs−eutEV013D) and IMS460 (evolved Ald− Acs−eutE Q4_E7del); the A-ALDs dependent reverse engineered strains: IMZ510 (Ald−acs1Δ dmpF), IMZ511 (Ald−acs1Δ eutE), IMZ512 (Ald−acs1Δ lin1129), IMZ513 (Ald−acs1Δ dmpFT137S), IMZ514 (Ald−acs1Δ eutE Q4_E7del), IMZ528 (Ald−acs1Δ dmpFI196L) and IMZ529 (Ald−acs1Δ eutEV013D). For the evolved strains, partial genotype was indicated in the brackets; additional mutations identified in those strains are described in the text. Averages and mean deviations were obtained from duplicate experiments.
Whole-genome sequencing reveals point mutations and copy number variations
To identify chromosomal mutations responsible for the improved growth rates on ethanol of the laboratory-evolved A-ALD-expressing strains, whole-genome sequencing was performed on isolates IMS456, IMS457, IMS458, IMS459 and IMS460 and on strain IMZ354 (Ald−), the common ancestor of all evolved strains.
Individual evolved strains contained 3–9 unique mutations within open reading frames, including single nucleotide variations (SNVs) and insertions and deletions (INDELs) (Table 4). Notably, ERG5, RIM11 and ACS1 contained different unique mutations in multiple evolution lines. For ERG5, which encodes a desaturase involved in ergosterol biosynthesis (Skaggs et al. 1996), amino acid changes A298V and V403A were identified in strains IMS456 and IMS460, respectively. In the case of RIM11, which encodes a protein kinase participating in signal transduction during entry into meiosis (Su and Mitchell 1993) point mutations resulting in amino acid changes, R124M and M230I were found in strains IMS456 and IMS457, respectively. Strikingly, all evolved strains contained mutations in ACS1, which encodes the glucose repressible, high-affinity ACS isoenzyme of S. cerevisiae (van den Berg et al. 1996; de Jong-Gubbels et al. 1997), except for strains IMS459 and IMS460, in which ACS1 was already deleted prior to laboratory evolution. In strains IMS457 and IMS458, point mutations of ACS1 led to amino acid changes R211L and D355E, respectively, while in strain IMS456 the second codon of ACS1 had become a stop codon, suggesting mutation of Acs1 is essential for growth of A-ALD-dependent strains on ethanol.
Table 4.
Results of the sequencing analysis of the genomic DNA of the A-ALD-dependent Ald− evolved strains IMS456, IMS457, IMS458, IMS459 and IMS460. Detailed description of the mutated genes is presented in Table S2 (Supporting Information).
| IMS456 | IMS457 | IMS458 | IMS459 | IMS460 | |||||
|---|---|---|---|---|---|---|---|---|---|
| Mutated | Amino acid | Mutated | Amino acid | Mutated | Amino acid | Mutated | Amino acid | Mutated | Amino acid |
| gene | change | gene | change | gene | change | gene | change | gene | change |
| ACS1 | S2* | ACS1 | R211L | ACS1 | D355E | ATP3 | S224P | ERG5 | V403A |
| ERG5 | A298V | ARB1 | L393G | HRD3 | Q810K | CUP9 | R219H | IDP2 | A74S |
| MDL2 | T429K | CBK1 | T448K | PRP16 | K49E | MTC2 | S280P | PAM17 | Y169* |
| RDS2 | D368N | FIG4 | E72* | RBD2 | W77C | SOD2 | Q205E | ||
| RIM11 | R124M | FRE1 | N141Y | SSM4 | A484T | ||||
| RPS1B | L120S | HRB1 | (A75T)a | UBR2 | *1283Yb | ||||
| TPD3 | D88Y | MMT1 | D382Y | ||||||
| YRM1 | N535D | RIM11 | M230I | ||||||
The nucleotide change is indicated, since this SNP is localized in an intron.
In the reference (CEN/PK) sequence, there is a mutation compared to S288C that introduces an early stop coding, likely resulting in a shorter protein. The mutation in IMS459 eliminates this stop codon.
In addition to SNVs and INDELs, a 24-kb region of chromosome III was duplicated in strains IMS458 and IMS459, and triplicated in strain IMS456. ADY2, which encodes an acetic acid importer localized in the plasma-membrane (Paiva et al. 2004), was among the 14 genes on this region (Table S3, Supporting Information).
Since mutations in the A-ALD expression vectors might have also contributed to improved growth on ethanol of the evolved strains, plasmids from strains IMS456, IMS457, IMS458, IMS459 and IMS460 (Table 2) were sequenced together with genomic DNA. Plasmids pUDE356 and pUDE357, from strains IMS456 and IMS457, respectively, contained point mutations in dmpF that caused T137S and I196L changes, respectively. Gene eutE present on pUDE359 from strain IMS459 showed a mutation leading to a V013D amino acid change, while pUDE360 (strain IMS460) carried an in-frame deletion in the ORF of eutE that resulted in loss of four amino acids (Q4 D5 I6 E7) near the EutE N-terminus. Only pUDE358, from strain IMS458, did not contain mutations in its A-ALD gene (lin1129).
Mutation of ACS1 is required for ethanol growth of A-ALD-dependent strains
All evolved strains that originally expressed a functional ACS1, showed mutations in this gene. A posteriori, the fact that strain IMZ305 (Ald− Acs−eutE), in which ACS1 had been deleted prior to laboratory evolution, already grew somewhere within the first two weeks of the evolution, was probably also the result of this deletion. In order to investigate whether acs1 mutations enable growth of A-ALD-dependent strains on ethanol, the Ald−acs1Δ strain IMK578 was transformed with plasmids carrying non-evolved A-ALD genes—pUDE047, pUDE151 and pUDE152. In contrast to non-evolved A-ALD-expressing Ald− strains, the resulting strains IMZ510 (Ald−acs1Δ dmpF), IMZ511 (Ald−acs1Δ eutE) and IMZ512 (Ald−acs1Δ lin1129) showed immediate growth on agar plates with ethanol as sole carbon source. In shake-flask cultures on ethanol synthetic medium, they grew at specific growth rates of 0.02–0.03 h−1 (Fig. 1). In line with these observations, reexamination of the growth of IMZ305 (Ald− Acs−eutE) showed that also this strain indeed grew on ethanol at <0.03 h−1.
Although deletion of ACS1 was shown to be essential for growth of A-ALD-dependent strains on ethanol, the maximum specific growth rates of the reverse engineered strains were below 50% of the growth rates of the evolved strains. To confirm that growth of the evolved strains was still dependent on the introduced A-ALDs, two experiments were performed. First, it was confirmed that the reverse engineered strain IMK578 (Ald−acs1Δ) was unable to grow on ethanol as the sole carbon source on either agar plates or in liquid cultures (data not shown). Subsequently, it was attempted to remove the A-ALD expression plasmid from all evolved Ald− A-ALD strains. Plasmid removal was only successful for strain IMS457, and the resulting strain IMS477 was unable to grow on ethanol as the sole carbon source. These experiments suggested that expression of A-ALD, in combination with the mutation of ACS1, is essential for growth of Ald− strains on ethanol.
Mutations in eutE and dmpF acquired during laboratory evolution improve affinity for acetaldehyde
To further analyze the evolved dmpF and eutE alleles, the kinetic properties of the encoded A-ALDs were measured in cell extracts of evolved strains, pre-grown on ethanol. Although no mutations were found in lin1129, the corresponding evolved strain IMS458 was also included. Non-evolved strains IMZ284 (Ald−dmpF), IMZ290 (Ald−eutE) and IMZ291 (Ald−lin1129), used as references, were pre-grown on glucose as they cannot grow on ethanol. The measurement of the enzymatic activities of acetyl-CoA formation (Table 5) showed an increased Vmax for all mutated variants of DmpF and EutE. Furthermore, for both proteins, variants with a lower KM for acetaldehyde were identified. Vmax/KM ratios of DmpF from evolved strains IMS456 and IMS457 were 26- and 15-fold higher, respectively, than that of DmpF from the non-evolved strain IMZ284 (Ald−dmpF). In case of EutE from the evolved strains IMS459 and IMS460, the Vmax/KM ratios were 1.6- and 1.8-fold higher, respectively, in comparison to the non-evolved strain IMZ290 (Ald−eutE). Consistent with the absence of mutations in lin1129, no significant change in Vmax or KM was observed for Lin1129 in cell extracts of evolved strains (Table 5).
Table 5.
The activities, Vmax and KM with acetaldehyde or acetyl-CoA as a substrate of different A-ALDs measured in the non-evolved strains IMZ284 (Ald−dmpF), IMZ290 (Ald−eutE), IMZ291 (Ald−lin1129) pre-grown on synthetic medium 20 g L−1 glucose and in the A-ALD-dependent Ald− evolved strains IMS456, IMS457, IMS458, IMS459 and IMS460 pre-grown on synthetic medium with 20 g L−1 ethanol. Different alleles of the A-ALD of the non-evolved and evolved strains are indicated in the table. Additional mutations identified in the evolved strains are described in the text. Averages and mean deviations were obtained from duplicate experiments. The detection limit of the enzyme assays was 2 nmol min−1 mg protein−1.
| Strain | IMZ284 | IMS456 | IMS457 | IMZ290 | IMS459 | IMS460 | IMZ291 | IMS458 |
|---|---|---|---|---|---|---|---|---|
| Plasmid | pUDE047 | pUDE356 | pUDE357 | pUDE151 | pUDE359 | pUDE360 | pUDE152 | pUDE358 |
| A-ALD | dmpF | dmpFT137S | dmpFI196L | eutE | eutEV013D | eutEQ4_E7del | lin1129 | lin1129 |
| Acetaldehyde as a substrate | ||||||||
| Activity μmol mg protein−1 min−1 | 0.31 ± 0.06 | 7.75 ± 0.37 | 4.88 ± 0.20 | 7.95 ± 0.33 | 10.23 ± 0.27 | 13.04 ± 0.80 | 6.57 ± 0.6 | 6.69 ± 0.15 |
| KM mmol L−1 | 22.35 ± 4.12 | 16.10 ± 1.32 | 20.26 ± 3.16 | 1.49 ± 0.08 | 1.15 ± 0.06 | 1.35 ± 0.21 | 3.90 ± 0.01 | 3.48 ± 0.35 |
| Vmax μmol mg protein−1 min−1 | 1.01 ± 0.19 | 20.67 ± 1.64 | 14.96 ± 2.28 | 9.34 ± 0.34 | 11.47 ± 0.17 | 15.17 ± 0.81 | 9.06 ± 0.01 | 9.23 ± 0.62 |
| Vmax KM−1 (10−3) | 0.05 ± 0.01 | 1.28 ± 0.15 | 0.74 ± 0.16 | 6.27 ± 0.42 | 9.95 ± 0.52 | 11.32 ± 1.87 | 2.32 ± 0.01 | 2.65 ± 0.32 |
| Acetyl-CoA as a substrate | ||||||||
| Activity μmol mg protein−1 min−1 | 0.04 ± 0.01 | 0.19 ± 0.00 | 0.20 ± 0.00 | 2.01 ± 0.04 | 1.38 ± 0.05 | 1.88 ± 0.12 | 1.15 ± 0.13 | 0.61 ± 0.03 |
All three tested A-ALDs also catalyze NADH-dependent reduction of acetyl-CoA to acetaldehyde (Kozak et al. 2014a). Cell extracts of evolved dmpF-expressing strains yielded a ca. 5-fold higher rate of acetyl-CoA reduction than the corresponding non-evolved strain, while this activity was not increased in either of the evolved eutE-expressing strains (Table 5). Lower acetyl-CoA reducing activities in cell extracts of evolved EutE and Lin1129 strains relative to the corresponding non-evolved strains was likely to be due to different activities of ADH in cell extracts of ethanol and glucose pre-grown cultures (Table 5). The activity of ADH can result in increased rates of NADH oxidation when acetaldehyde formed in the reductive A-ALD activity assays is further reduced to ethanol. Despite deletion of ALD2, 3, 4, 5 and 6, potential reappearance of acetaldehyde dehydrogenase activity in the evolved strains provides an alternative hypothesis for the obtained growth on ethanol. Therefore, the enzymatic activity of acetaldehyde dehydrogenase in the last common ancestor of all evolved strains IMZ354 (Ald−) as well as in the evolved strains IMS456, IMS457, IMS458, IMS459 and IMS460 were measured. Only in case of two strains IMS456 expressing DmpFT137S and IMS457 expressing DmpFI196L, a low acetaldehyde dehydrogenase activity of 3.7 ± 0.3 and 1.4 ± 0.1 nmol min−1 mg protein−1, respectively, was observed (detection limit of 1 nmol min−1 mg protein−1). This activity was increasing with increased levels of acetaldehyde in the reaction mixture and could be also measured with A-ALD specific assay of acetyl-CoA formation, when CoA was omitted from the reaction mix. However, it was not detected in the cell free extract of strain IMS477 (Ald−ACS1S2*, evolved), which does not contain DmpF, suggesting, that the ALD activity was originating from DmpF.
To investigate whether the identified mutations of A-ALD genes contributed to the improved growth of the evolved strains on ethanol, plasmids isolated from the evolved strains were introduced into IMK578 (Ald−acs1Δ), resulting in strains IMZ513 (Ald−acs1Δ Δ dmpFT137S), IMZ528 (Ald−acs1Δ dmpFI196L), IMZ514 (Ald−acs1Δ eutE Q4_E7del) and IMZ529 (Ald−acs1Δ eutEV013D). All these strains showed immediate growth on agar plates and in shake-flask cultures on ethanol (Fig. 1). No differences in maximum specific growth rate were observed between Ald−acs1Δ strains expressing either the original or the mutated alleles of the heterologous A-ALD genes (Fig. 1), indicating that, in addition to mutations in ACS1 and, potentially also A-ALD, at least one other mutation is required to achieve the growth rates observed in the evolved cultures.
Supplementation with acetate or alanine stimulates growth of Ald− A-ALD strains on ethanol
The key role of acs1 mutations, combined with the observation of increased copy number of ADY2 in three evolution lines, suggests that acetate availability was important for growth of A-ALD-dependent strains on ethanol. To investigate this hypothesis, growth rates on ethanol of the evolved strains, as well as of the reverse engineered Ald−acs1Δ strains carrying either the original or evolved A-ALD plasmids, were tested in the presence and absence of acetate (Fig. 1, panel A). Only two of the five evolved strains (IMS456 and IMS459) showed a slightly increased growth rate on ethanol upon acetate addition. In contrast, acetate addition increased the maximum specific growth rates on ethanol of all reverse engineered Ald−acs1Δ strains by 23%–81%. To verify that acetate stimulated growth on ethanol rather than supported growth by itself, growth of non-evolved strains IMZ284 (Ald−dmpF), IMZ290 (Ald−eutE), IMZ291 (Ald−lin1129) and IMZ305 (Ald− Acs−eutE) was tested under identical conditions. Of these strains, only strain IMZ305 grew within two weeks at an estimated growth rate below 0.01 h−1.
When S. cerevisiae grows on alanine as the nitrogen source, uptake of this amino acid is followed by its transamination, which yields pyruvate. Supplementation with alanine increased the specific growth rate on ethanol of only one of the evolved strains—IMS457 (Fig. 1, panel B). In contrast, growth rates on ethanol of all reverse engineered Ald−acs1Δ strains increased by 61%–235% when alanine was used as a nitrogen source (Fig. 1, panel B). The non-evolved strains IMZ284 (Ald−dmpF), IMZ290 (Ald−eutE), IMZ291 (Ald−lin1129) and IMZ305 (Ald− Acs−eutE) did not grow on alanine-supplemented ethanol synthetic medium after two weeks of incubation.
Physiology of evolved Ald− A-ALD-dependent strains in ethanol-limited chemostat cultures
The quantitative impact of rerouting ethanol dissimilation via A-ALD on yeast physiology and biomass yields was investigated in aerobic, ethanol-limited chemostat cultures of the evolved Ald− A-ALD-dependent strains IMS456, IMS457, IMS458, IMS459 and IMS460 and the reference strain CEN.PK113-7D (Ald+ Acs+). Based on the lowest maximum specific growth rate of the evolved strains, the dilution rate for these experiments was set at 0.05 h−1. For four of the five evolved A-ALD-dependent Ald− strains, biomass yields on ethanol were equal to or lower than that of the reference strain (Table 6). The fifth evolved strain, IMS456, showed a biomass yield of 0.60 g per g ethanol−1, which was 5.4% higher than that of the reference strain (0.57 g biomass g ethanol−1). Despite the deletion of all ALD genes, chemostat cultures of all five evolved strains showed ca. 2-fold higher extracellular acetate concentrations than the reference strain (Table 6).
Table 6.
Comparison of biomass yields, extracellular acetate concentrations and residual ethanol concentrations in S. cerevisiae cultures of the reference strain CEN.PK113-7D and of five evolved, A-ALD-dependent strains: IMS456, IMS457, IMS458, IMS459 and IMS460, in aerobic ethanol-limited chemostat cultures, grown at a dilution rate of 0.05 h−1 and at pH 5. Averages and standard deviations represent data from three replicate cultures for each strain. Persistent oscillations of strains IMS459 and IMS460 prevented the establishment of steady states; data for these strains represent time-averaged measurements.
| Strain | Relevant genotypea | Biomass yield (g biomass g ethanol−1) | Acetate (mM) | Residual ethanol (mM) |
|---|---|---|---|---|
| CEN.PK113-7D | Ald+Acs+ | 0.57 ± 0.01 | 0.51 ± 0.03 | Not detected |
| 1 copy of ADY2 | ||||
| IMS456 | Ald−ACS1S2* dmpFT137S | 0.60 ± 0.00 | 0.90 ± 0.06 | 28.19 ± 3.81 |
| 3 copies of ADY2 | ||||
| IMS457 | Ald−ACS1RR211L dmpFI196L | 0.56 ± 0.01 | 1.39 ± 0.07 | 18.40 ± 4.93 |
| 1 copy of ADY2 | ||||
| IMS458 | Ald−ACS1D355E lin1129 | 0.54 ± 0.01 | 1.09 ± 0.05 | 7.66 ± 0.30 |
| 2 copies of ADY2 | ||||
| IMS459 | Ald− Acs−eutEV013D | 0.53 ± 0.04 | 1.06 ± 0.22 | 2.84 ± 0.39 |
| 2 copies of ADY2 | ||||
| IMS460 | Ald− Acs−eutEQ4_E7del | 0.56 ± 0.01 | 1.09 ± 0.13 | 2.18 ± 1.68 |
| 1 copy of ADY2 |
Additional mutations identified in the evolved strains are indicated in Table 3.
In view of the higher biomass yield of strain IMS456, its physiology was compared to the reference strain CEN.PK113-7D in more detail (Table 7). A lower ethanol consumption rate (1.72 versus 1.81 mmol g biomass−1 h−1 at an identical specific growth rate) was directly used to calculate the increased biomass yield on ethanol. The biomass-specific CO2 production rates (qCO2), O2 consumption rates (qO2) and the resulting respiratory quotients (RQ) supported the conclusion that replacement of ALD/ACS with A-ALD led to higher biomass yield on ethanol. Complete respiratory dissimilation of ethanol leads to a RQ of 0.67, whereas assimilation of biomass according to Equation 1, and subsequent reoxidation of biosynthetically generated NADH and FADH would yield a RQ of 0.33. The significantly lower RQ of the evolved strain IMS456 (0.42 ± 0.02) relative to that of the reference strain (0.48 ± 0.00) (Table 7) is in line with the prediction that less ethanol has to be completely dissimilated via the TCA cycle since less ATP is required for assimilation.
Table 7.
Physiology of S. cerevisiae strain CEN.PK113-7D and evolved strain IMS456 in aerobic ethanol-limited chemostat cultures, grown at a dilution rate of 0.05 h−1 and at pH 5. Averages and standard deviations were obtained from three independent replicate cultures for each strain. The detection limit for ethanol was 0.02 g L−1.
| Units | CEN.PK113-7D | IMS456 | |
|---|---|---|---|
| Dilution rate | h−1 | 0.048 ± 0.001 | 0.048 ± 0.001 |
| Biomass yield | g biomass g ethanol−1 | 0.57 ± 0.01 | 0.60 ± 0.00 |
| qethanol | mmol g biomass−1 h−1 | −1.81 ± 0.04 | −1.72 ± 0.03 |
| qO2 | mmol g biomass−1 h−1 | −3.38 ± 0.14 | −2.77 ± 0.12 |
| qCO2 | mmol g biomass−1 h−1 | 1.62 ± 0.06 | 1.15 ± 0.01 |
| Respiratory quotient | molCO2 molO2−1 | 0.48 ± 0.00 | 0.42 ± 0.02 |
| qglycerol | mmol g biomass−1 h−1 | 0.029 ± 0.001 | 0.046 ± 0.007 |
| qacetate | mmol g biomass−1 h−1 | 0.007 ± 0.001 | 0.015 ± 0.001 |
| qsuccinate | mmol g biomass−1 h−1 | 0.002 ± 0.002 | 0.005 ± 0.000 |
| qacetaldehyde | mmol g biomass−1 h−1 | 0.001 ± 0.0002 | 0.007 ± 0.0002 |
| Residual ethanol | g L−1 | Not detected | 1.30 ± 0.18 |
| Carbon recovery | % | 100 ± 4 | 96 ± 1 |
The potential benefit of A-ALD on the biomass yield on ethanol was partially masked by increased production of glycerol, acetate, succinate and acetaldehyde (Table 7). Together, formation of these metabolites accounted for over 7% of the ethanol consumption in the evolved strain IMS456, as compared to just below 4% in the reference strain. Despite the ethanol-limited cultivation conditions, the residual ethanol concentration increased from below the detection limit of 0.02 g L−1 in the reference strain to 1.30 g L−1 for strain IMS456 (Table 7). This high residual ethanol concentration indicates that the affinity for ethanol (μmax/Ks; Button 1993) of strain IMS456 was significantly lower than that of the reference strain. Increased ethanol concentrations, in comparison to the reference strain, were also observed in cultures of the other evolved Ald− A-ALD strains (Table 6). To further investigate the impact of the genetic interventions and subsequent evolutionary engineering on central metabolism, intracellular metabolite concentrations were analyzed in aerobic, ethanol-limited cultures of the evolved strain IMS456 and compared with those in chemostat cultures of the reference strain CEN.PK113-7D (Acs+ Ald+). Despite the complete replacement of the native pathway for synthesis of cytosolic acetyl-CoA, intracellular acetyl-CoA concentrations in the evolved strain (0.83 ± 0.17 μmol g dry weight−1) and reference strain (0.85 ± 0.27 μmol g dry weight−1) were not significantly different. 15 of 40 other analyzed intracellular metabolites showed at least 2-fold difference between the two strains (Table 8; Table S4, Supporting Information). In the upper part of glycolysis and pentose phosphate pathway, strain IMS456 showed higher intracellular concentrations of glucose (3.5-fold), fructose-1,6-bisphosphate (7-fold) and 6-phosphogluconate (2.5-fold) than the reference strain. In contrast, concentrations of intermediates of the lower part of glycolysis (2-phosphoglycerate, 3-phosphoglycerate, phosphoenolpyruvate and pyruvate) were 5- to 8-fold lower in the A-ALD-dependent strain than in the reference strain. Of the TCA cycle intermediates, strain IMS456 showed a ca. 2-fold lower isocitrate concentration and an over 7-fold higher intracellular succinate concentrations than the reference strain. Strain IMS456 also showed a 2.5-fold lower intracellular NADH concentration and 3-fold lower NADH/NAD+ ratio (Table 8; Table S4, Supporting Information). At the same time, strain IMS456 showed a 2-fold higher intracellular NADPH concentration in comparison to the reference strain.
Table 8.
Steady-state intracellular metabolite concentrations (μmol g dry weight−1) and acetaldehyde concentration (mM) in the broth in ethanol-limited chemostat cultures of the reference strain CEN.PK113-7D and of the A-ALD-dependent evolved strain IMS456. Chemostat cultures were grown at a dilution rate of 0.05 h−1 and at pH 5. Only metabolites with a fold change ≥2 are shown. Averages and standard deviations were obtained from three replicate cultures for each strain.
| Metabolite | CEN.PK113-7D | IMS456 |
|---|---|---|
| Glycolysis | ||
| Glucose | 3.98 ± 0.80 | 13.99 ± 0.33 |
| Fructose-1,6-bisphosphate | 0.08 ± 0.02 | 0.59 ± 0.04 |
| Dihydroxyacetone | 0.09 ± 0.01 | 0.27 ± 0.03 |
| 2-phosphoglycerate | 0.26 ± 0.02 | 0.04 ± 0.00 |
| 3-phosphoglycerate | 2.46 ± 0.28 | 0.31 ± 0.02 |
| Phosphoenolpyruvate | 1.19 ± 0.19 | 0.18 ± 0.01 |
| Pyruvate | 0.80 ± 0.21 | 0.16 ± 0.02 |
| Pentose phosphate pathway | ||
| 6-phosphogluconate | 0.22 ± 0.03 | 0.54 ± 0.03 |
| Tricarboxylic acid cycle | ||
| Isocitrate | 0.42 ± 0.05 | 0.18 ± 0.03 |
| Succinate | <0.15 | 1.12 ± 0.15 |
| Coenzymes and cofactors | ||
| NADH | 0.30 ± 0.07 | 0.12 ± 0.02 |
| NADPH | 0.10 ± 0.04 | 0.22 ± 0.02 |
| Other | ||
| Glycerol-3-phosphate | 0.03 ± 0.00 | 0.22 ± 0.02 |
| Intra- + extracellular | ||
| Acetaldehyde | 0.05 ± 0.01 | 0.15 ± 0.01 |
DISCUSSION
Based on reaction stoichiometries, replacement of the native S. cerevisiae acetaldehyde dehydrogenases by a heterologous A-ALD appears to provide a straightforward, ATP-independent alternative pathway from ethanol to acetyl-CoA. Previous work has already shown that expression of A-ALD can functionally replace the native pathway for cytosolic acetyl-CoA synthesis in glucose-grown S. cerevisiae cultures (Kozak et al. 2014a). However, prolonged laboratory evolution was required to enable growth on ethanol of S. cerevisiae strains in which its native ALD genes had been deleted and replaced by a prokaryotic A-ALD gene.
Whole-genome sequencing of multiple laboratory-evolved yeast strains, derived from parallel independent evolution experiments, followed by reconstruction of the observed mutations in naïve, non-evolved strains, is a powerful approach to gain a deeper understanding of yeast biology and to (re)construct industrially relevant phenotypes (Oud et al. 2012). Resequencing of evolved Ald− A-ALD strains that had acquired the ability to grow on ethanol, revealed that three genes (ACS1, ERG5 and RIM11) were affected by mutations in multiple evolved strains.
Deletion of ACS1 was sufficient to enable slow growth on ethanol as the sole carbon source of the Ald− A-ALD strains. ACS1 encodes one of two acetyl-CoA synthetases (ACS) present in the cytosol of S. cerevisiae. In contrast to its paralog ACS2, ACS1 is glucose repressed and encodes an ACS with a higher affinity for acetate (van den Berg et al. 1996; de Jong-Gubbels et al. 1997). Elevated acetate concentrations in ethanol-limited chemostat cultures of the evolved strains (Table 6), the amplification of the acetate-transporter-encoding ADY2 gene in three evolved strains, and the positive effect of acetate supplementation on growth of Ald− A-ALD strains, all indicates that acs1 mutations stimulate growth by conserving cellular acetate pools. In the absence of the known ALD (Ald2, Ald3, Ald4, Ald5 and Ald6), the metabolic origin of acetate is unclear. It is however conceivable that some acetate is generated by, for example, protein deacetylation and by chitin deacetylases (Cda1 and Cda2; Christodoulidou et al. 1999). This leads to the question why Ald− A-ALD strains require acetate for growth. An interesting possibility is related to synthesis of intramitochondrial acetyl-CoA, which is the precursor for mitochondrial synthesis of lipids and, in particular, for synthesis of lipoate. Ach1 is a mitochondrial enzyme (Fig. 2) that can use the TCA-cycle intermediate succinyl-CoA as a CoA donor to activate acetate to acetyl-CoA (Fleck and Brock 2009). The significantly increased intracellular concentration of succinate in the evolved Ald− A-ALD strain IMS456 relative to that of a reference strain (Table 8), may reflect increased conversion of succinyl-CoA to succinate.
Figure 2.

Schematic representation of the selected reactions of central metabolism of S. cerevisiae growing on ethanol as the only carbon source. Abbreviations: ACS—acetyl-CoA synthetase, ALD—acetaldehyde dehydrogenase, A-ALD—acetylating acetaldehyde dehydrogenase, Ach1—CoA-transferase, Idp2—isocitrate dehydrogenase, PPP—pentose phosphate pathway and TCA—tricarboxylic acid cycle.
If Ach1 is required to provide intramitochondrial acetyl-CoA in S. cerevisiae during growth on ethanol of the Ald− A-ALD-dependent strains, this would indicate that the mitochondrial PDH complex cannot provide sufficient mitochondrial acetyl-CoA to sustain growth on ethanol. An insufficient flux through the PDH complex might be caused by regulation of the mitochondrial pyruvate transporters (MPC1, MPC2 and MPC3; Herzig et al. 2012), post-translational regulation of the PDH complex itself by phosphorylation (Gey et al. 2008) or changes in the intracellular pyruvate pools. The latter hypothesis is supported by the observation that the intracellular pyruvate concentration in the evolved A-ALD-dependent Ald− strain IMS456 was over 4-fold lower than in the reference strain CEN.PK113-7D (Acs+ Ald+) (Table 8). Moreover, supplementation of growth media with alanine (as a nitrogen source), which directly feeds pyruvate into the metabolic network, stimulated growth on ethanol of Ald− A-ALD acs1Δ strains (Fig. 1). These results are consistent with a role of Ach1 in mitochondrial acetyl-CoA synthesis in ethanol-grown Ald− A-ALD-dependent S. cerevisiae strains. This study therefore suggests intramitochondrial acetyl-CoA synthesis as a key target for further optimization of the growth of Ald− A-ALD strains on ethanol, for example via engineering mitochondrial pyruvate metabolism or via engineering of acetyl-CoA shuttles across the mitochondrial inner membrane.
Mutations in the heterologous A-ALD genes that occurred during laboratory evolution of Ald− A-ALD strains on ethanol could be linked to changes in their kinetic properties and, in particular, in their affinity (Vmax/KM) for acetaldehyde. Although a contribution of copy number changes of the A-ALD plasmids to the improvement in Vmax/KM cannot be excluded, the fact that the increase of the enzymatic activity in the acetyl-CoA forming direction was significantly larger than the increase in the reverse reaction points to a significant contribution of the mutations to the enzyme kinetics in the evolved strains. Simultaneously, the fact that the expression level of TDH3, of which the promotor was used to express A-ALD, is generally lower on ethanol (Peng et al. 2015), might have led to an underestimation of the Vmax/KM differences. The most pronounced changes of Vmax/KM ratio were observed for Pseudomonas sp. DmpF. Prior to evolution, assays in cell extracts of an engineered yeast strain expressing DmpF showed an up to 125-fold lower Vmax/KM ratio than was observed for the corresponding strains expressing EutE from E. coli and Lin1129 from L. innocua. After evolution, this difference decreased to less than 16-fold (Table 5). The much less drastic increase of Vmax/KM of EutE and the absence of mutations in lin1129, suggests that the affinities of EutE and Lin1129 were sufficient to support growth of the A-ALD-dependent strains on ethanol.
A high Vmax/KM ratio of A-ALD enables the enzyme to achieve high fluxes at relatively low intracellular acetaldehyde concentrations. Acetaldehyde is a toxic molecule that can cause protein and DNA damage (Tuma and Casey 2003). Despite the improved affinity of its A-ALD, elevated acetaldehyde concentrations were observed in ethanol-limited chemostat cultures of the evolved strain IMS456 compared to the reference strain CEN.PK113-7D. To drive the A-ALD reaction (ΔG0′ = −13.7 kJ mol−1 at pH 7, ionic strength of 0.2 M (Flamholz et al. 2012) in the oxidative direction high intracellular acetaldehyde concentrations may be required. The observed increased levels of ethanol are in line with these higher levels of intracellular acetaldehyde. This is further supported by the observation that the residual ethanol concentrations are higher in the chemostat cultures of strains expressing A-ALDs with lower affinities for acetaldehyde (Tables 5 and 6). The ΔGR0 of the native S. cerevisiae pathway for conversion of ethanol into acetyl-CoA is more negative than that of the introduced pathway. To investigate the impact of this decreased thermodynamic ‘pull’, it will be of interest to determine the in vivo ΔGR of the A-ALD reaction in combination with the introduction of acetyl-CoA consuming reactions, for example by overexpression of the extramitochondrial citrate synthase Cit2 or by coupling A-ALD to a product pathway.
In addition to its role in the linear oxidation pathway from ethanol to acetate, the native NADP+-dependent acetaldehyde dehydrogenase contributes to the provision of NADPH for assimilation. The increased intracellular concentration of isocitrate in strain IMS456 may reflect an increased contribution of cytosolic NADP+-dependent isocitrate dehydrogenase to NADPH generation to compensate for the absence of Ald6. Similarly, the decreased concentrations of the lower-glycolytic metabolites and the increased concentrations in upper glycolysis (Table 8), may reflect an increased role of the oxidative pentose-phosphate pathway in NADPH generation.
The highest specific growth rate on ethanol of an evolved Ald− A-ALD strain (IMS459) of 0.11 h−1 corresponded to almost 70% of that of the reference strain CEN.PK113-7D (0.16 h−1) (Flikweert et al. 1999b). The specific growth rate of reverse engineered strains in which deletion of ACS1 was combined with the expression of evolved alleles of A-ALD genes, did not exceed 0.035 h−1. Unfortunately, low growth rates and poor genetic accessibility of Ald− A-ALD strains, resulting in very low transformation efficiency precluded a combinatorial analysis of the mutations that occurred in multiple strains. However, our results clearly indicate that, in addition to acs1 inactivation and improved affinity of A-ALD, other mutations contributed to the improved growth of the evolved strains.
Only one of five evolved Ald− A-ALD strains (IMS456) showed a small but significant increase of its biomass yield on ethanol relative to an Ald+ACS1 reference strain (Table 7). However, the observed biomass yield of 0.60 g per g ethanol of this evolved strain remained far below the theoretical maximum of 0.80 g biomass g ethanol−1 calculated for Ald− A-ALD strains. This discrepancy could only partly be explained by carbon loss due to the increased formation of byproducts, such as acetaldehyde. Based on transcriptome analyses, a decrease in the biomass yield in glucose-limited cultures of metabolically engineered S. cerevisiae strains in which cytosolic acetyl-CoA synthesis had been rerouted via A-ALD was attributed to acetaldehyde toxicity (Kozak et al. 2014a). Cellular mechanisms to combat toxicity of acetaldehyde (Tuma and Casey 2003) in the Ald− A-ALD strains may have led to increased ATP costs and, thereby, a lower biomass yield. For example, increased turnover of damaged proteins and regeneration of glutathione, which promotes tolerance by reacting with acetaldehyde, are both ATP-dependent processes.
This study demonstrates, for the first time, that it is possible to replace the native ALD/ACS-based route for ethanol dissimilation with an A-ALD-dependent pathway that has the potential to enable strongly increased product yields on ethanol. Furthermore, compartmentation of acetyl-CoA metabolism and the regulation of intracellular acetaldehyde concentrations were identified as high priority targets for further research, which is required to harvest the full stoichiometric potential of the introduced modifications.
Supplementary Material
Acknowledgments
We thank our colleagues Marijke Luttik, Erik de Hulster and Marcel van den Broek for technical support.
SUPPLEMENTARY DATA
FUNDING
This work was carried out within the BE-Basic R&D Program, which was granted a FES subsidy from the Dutch Ministry of Economic affairs, agriculture and innovation (EL&I) and received additional financial contributions from DSM Biotechnology Center and Amyris Inc.
Conflict of interest. None declared.
REFERENCES
- Aristidou A, Penttila M. Metabolic engineering applications to renewable resource utilization. Curr Opin Biotech. 2000;11:187–98. doi: 10.1016/s0958-1669(00)00085-9. [DOI] [PubMed] [Google Scholar]
- Bahalul M, Kaneti G, Kashi Y. Ether-zymolyase ascospore isolation procedure: an efficient protocol for ascospores isolation in Saccharomyces cerevisiae yeast. Yeast. 2010;27:999–1003. doi: 10.1002/yea.1808. [DOI] [PubMed] [Google Scholar]
- Bekers KM, Heijnen JJ, van Gulik WM. Determination of the in vivo NAD/NADH ratio in S. cerevisiae under anaerobic conditions using alcohol dehydrogenase as sensor reaction. Yeast. 2015;32:541–57. doi: 10.1002/yea.3078. [DOI] [PubMed] [Google Scholar]
- Boeke JD, LaCroute F, Fink GR. A positive selection for mutants lacking orotidine-5′-phosphate decarboxylase activity in yeast: 5–fluoro-orotic acid resistance. Mol Gen Genet. 1984;197:345–6. doi: 10.1007/BF00330984. [DOI] [PubMed] [Google Scholar]
- Bruinenberg PM, van Dijken JP, Scheffers WA. An enzymic analysis of NADPH production and consumption in Candida utilis. J Gen Microbiol. 1983;129:965–71. doi: 10.1099/00221287-129-4-965. [DOI] [PubMed] [Google Scholar]
- Button DK. Nutrient-limited microbial growth kinetics: overview and recent advances. Anton Van Lee. 1993;63:225–35. doi: 10.1007/BF00871220. [DOI] [PubMed] [Google Scholar]
- Canelas AB, Ras C, ten Pierick A, et al. Leakage-free rapid quenching technique for yeast metabolomics. Metabolomics. 2008;4:226–39. [Google Scholar]
- Chen Y, Daviet L, Schalk M, et al. Establishing a platform cell factory through engineering of yeast acetyl-CoA metabolism. Metab Eng. 2013;15:48–54. doi: 10.1016/j.ymben.2012.11.002. [DOI] [PubMed] [Google Scholar]
- Christodoulidou A, Briza P, Ellinger A, et al. Yeast ascospore wall assembly requires two chitin deacetylase isozymes. FEBS Lett. 1999;460:275–9. doi: 10.1016/s0014-5793(99)01334-4. [DOI] [PubMed] [Google Scholar]
- Cipollina C, ten Pierick A, Canelas AB, et al. A comprehensive method for the quantification of the non-oxidative pentose phosphate pathway intermediates in Saccharomyces cerevisiae by GC-IDMS. J Chromatogr B. 2009;877:3231–6. doi: 10.1016/j.jchromb.2009.07.019. [DOI] [PubMed] [Google Scholar]
- Daran-Lapujade P, Jansen ML, Daran JM, et al. Role of transcriptional regulation in controlling fluxes in central carbon metabolism of Saccharomyces cerevisiae. A chemostat culture study. J Biol chem. 2004;279:9125–38. doi: 10.1074/jbc.M309578200. [DOI] [PubMed] [Google Scholar]
- de Jong-Gubbels P, van den Berg MA, Steensma HY, et al. The Saccharomyces cerevisiae acetyl-coenzyme A synthetase encoded by the ACS1 gene, but not the ACS2-encoded enzyme, is subject to glucose catabolite inactivation. FEMS Microbiol Lett. 1997;153:75–81. doi: 10.1111/j.1574-6968.1997.tb10466.x. [DOI] [PubMed] [Google Scholar]
- de Kok S, Kozak BU, Pronk JT, et al. Energy coupling in Saccharomyces cerevisiae: selected opportunities for metabolic engineering. FEMS Yeast Res. 2012a;12:387–97. doi: 10.1111/j.1567-1364.2012.00799.x. [DOI] [PubMed] [Google Scholar]
- de Kok S, Nijkamp JF, Oud B, et al. Laboratory evolution of new lactate transporter genes in a jen1Δ mutant of Saccharomyces cerevisiae and their identification as ADY2 alleles by whole-genome resequencing and transcriptome analysis. FEMS Yeast Res. 2012b;12:359–74. doi: 10.1111/j.1567-1364.2012.00787.x. [DOI] [PubMed] [Google Scholar]
- de Kok S, Yilmaz D, Suir E, et al. Increasing free-energy (ATP) conservation in maltose-grown Saccharomyces cerevisiae by expression of a heterologous maltose phosphorylase. Metab Eng. 2011;13:518–26. doi: 10.1016/j.ymben.2011.06.001. [DOI] [PubMed] [Google Scholar]
- Dyer JM, Chapital DC, Kuan JW, et al. Metabolic engineering of Saccharomyces cerevisiae for production of novel lipid compounds. Appl Microbiol Biot. 2002;59:224–30. doi: 10.1007/s00253-002-0997-5. [DOI] [PubMed] [Google Scholar]
- Entian KD, Kotter P. 25 yeast genetic strain and plasmid collections. Method Microbiol. 2007;36:629–66. [Google Scholar]
- Eriksen DT, Hsieh PC, Lynn P, et al. Directed evolution of a cellobiose utilization pathway in Saccharomyces cerevisiae by simultaneously engineering multiple proteins. Microb Cell Fact. 2013;12:61. doi: 10.1186/1475-2859-12-61. [DOI] [PMC free article] [PubMed] [Google Scholar]
- Ewing B, Green P. Base-calling of automated sequencer traces using phred. II. Error probabilities. Genome Res. 1998;8:186–94. [PubMed] [Google Scholar]
- Ewing B, Hillier L, Wendl MC, et al. Base-calling of automated sequencer traces using phred. I. Accuracy assessment. Genome Res. 1998;8:175–85. doi: 10.1101/gr.8.3.175. [DOI] [PubMed] [Google Scholar]
- Flamholz A, Noor E, Bar-Even A, et al. eQuilibrator–the biochemical thermodynamics calculator. Nucleic Acids Res. 2012;40:D770–5. doi: 10.1093/nar/gkr874. [DOI] [PMC free article] [PubMed] [Google Scholar]
- Fleck CB, Brock M. Re-characterisation of Saccharomyces cerevisiae Ach1p: fungal CoA-transferases are involved in acetic acid detoxification. Fungal Genet Biol. 2009;46:473–85. doi: 10.1016/j.fgb.2009.03.004. [DOI] [PubMed] [Google Scholar]
- Flikweert MT, de Swaaf M, van Dijken JP, et al. Growth requirements of pyruvate-decarboxylase-negative Saccharomyces cerevisiae. FEMS Microbiol Lett. 1999a;174:73–79. doi: 10.1111/j.1574-6968.1999.tb13551.x. [DOI] [PubMed] [Google Scholar]
- Flikweert MT, Kuyper M, van Maris AJ, et al. Steady-state and transient-state analysis of growth and metabolite production in a Saccharomyces cerevisiae strain with reduced pyruvate-decarboxylase activity. Biotechnol Bioeng. 1999b;66:42–50. doi: 10.1002/(sici)1097-0290(1999)66:1<42::aid-bit4>3.0.co;2-l. [DOI] [PubMed] [Google Scholar]
- Gey U, Czupalla C, Hoflack B, et al. Yeast pyruvate dehydrogenase complex is regulated by a concerted activity of two kinases and two phosphatases. J Biol Chem. 2008;283:9759–67. doi: 10.1074/jbc.M708779200. [DOI] [PubMed] [Google Scholar]
- Gietz RD, Woods RA. Transformation of yeast by lithium acetate/single-stranded carrier DNA/polyethylene glycol method. Methods Enzymol. 2002;350:87–96. doi: 10.1016/s0076-6879(02)50957-5. [DOI] [PubMed] [Google Scholar]
- Gonzalez-Ramos D, van den Broek M, van Maris AJ, et al. Genome-scale analyses of butanol tolerance in Saccharomyces cerevisiae reveal an essential role of protein degradation. Biotechnol Biofuels. 2013;6:48. doi: 10.1186/1754-6834-6-48. [DOI] [PMC free article] [PubMed] [Google Scholar]
- Guadalupe Medina V, Almering MJ, van Maris AJ, et al. Elimination of glycerol production in anaerobic cultures of a Saccharomyces cerevisiae strain engineered to use acetic acid as an electron acceptor. Appl Environ Microb. 2010;76:190–5. doi: 10.1128/AEM.01772-09. [DOI] [PMC free article] [PubMed] [Google Scholar]
- Guadalupe-Medina V, Metz B, Oud B, et al. Evolutionary engineering of a glycerol-3-phosphate dehydrogenase-negative, acetate-reducing Saccharomyces cerevisiae strain enables anaerobic growth at high glucose concentrations. Microb Biotechnol. 2014;7:44–53. doi: 10.1111/1751-7915.12080. [DOI] [PMC free article] [PubMed] [Google Scholar]
- Herzig S, Raemy E, Montessuit S, et al. Identification and functional expression of the mitochondrial pyruvate carrier. Science. 2012;337:93–96. doi: 10.1126/science.1218530. [DOI] [PubMed] [Google Scholar]
- Hong KK, Nielsen J. Metabolic engineering of Saccharomyces cerevisiae: a key cell factory platform for future biorefineries. Cell Mol Life Sci. 2012;69:2671–90. doi: 10.1007/s00018-012-0945-1. [DOI] [PMC free article] [PubMed] [Google Scholar]
- Kocharin K, Siewers V, Nielsen J. Improved polyhydroxybutyrate production by Saccharomyces cerevisiae through the use of the phosphoketolase pathway. Biotechnol Bioeng. 2013;110:2216–24. doi: 10.1002/bit.24888. [DOI] [PubMed] [Google Scholar]
- Koopman F, Beekwilder J, Crimi B, et al. De novo production of the flavonoid naringenin in engineered Saccharomyces cerevisiae. Microb Cell Fact. 2012;11:155. doi: 10.1186/1475-2859-11-155. [DOI] [PMC free article] [PubMed] [Google Scholar]
- Kozak BU, van Rossum HM, Benjamin KR, et al. Replacement of the Saccharomyces cerevisiae acetyl-CoA synthetases by alternative pathways for cytosolic acetyl-CoA synthesis. Metab Eng. 2014a;21:46–59. doi: 10.1016/j.ymben.2013.11.005. [DOI] [PubMed] [Google Scholar]
- Kozak BU, van Rossum HM, Luttik MA, et al. Engineering acetyl coenzyme A supply: functional expression of a bacterial pyruvate dehydrogenase complex in the cytosol of Saccharomyces cerevisiae. mBio. 2014b;5:e01 696–14. doi: 10.1128/mBio.01696-14. [DOI] [PMC free article] [PubMed] [Google Scholar]
- Kuijpers NGA, Solis Escalante D, Bosman L, et al. A versatile, efficient strategy for assembly of multi-fragment expression vectors in Saccharomyces cerevisiae using 60-bp synthetic recombination sequences. Microb Cell Fact. 2013;12:47. doi: 10.1186/1475-2859-12-47. [DOI] [PMC free article] [PubMed] [Google Scholar]
- Lange HC, Eman M, van Zuijlen G, et al. Improved rapid sampling for in vivo kinetics of intracellular metabolites in Saccharomyces cerevisiae. Biotechnol Bioeng. 2001;75:406–15. doi: 10.1002/bit.10048. [DOI] [PubMed] [Google Scholar]
- Lee JW, Na D, Park JM, et al. Systems metabolic engineering of microorganisms for natural and non-natural chemicals. Nat Chem Biol. 2012;8:536–46. doi: 10.1038/nchembio.970. [DOI] [PubMed] [Google Scholar]
- Li H, Durbin R. Fast and accurate short read alignment with Burrows-Wheeler transform. Bioinformatics. 2009;25:1754–60. doi: 10.1093/bioinformatics/btp324. [DOI] [PMC free article] [PubMed] [Google Scholar]
- Li H, Durbin R. Fast and accurate long-read alignment with Burrows-Wheeler transform. Bioinformatics. 2010;26:589–95. doi: 10.1093/bioinformatics/btp698. [DOI] [PMC free article] [PubMed] [Google Scholar]
- Lowry OH, Rosebrough NJ, Farr AL, et al. Protein measurement with the Folin phenol reagent. J Biol Chem. 1951;193:265–75. [PubMed] [Google Scholar]
- Mashego MR, van Gulik WM, Vinke JL, et al. Critical evaluation of sampling techniques for residual glucose determination in carbon-limited chemostat culture of Saccharomyces cerevisiae. Biotechnol Bioeng. 2003;83:395–9. doi: 10.1002/bit.10683. [DOI] [PubMed] [Google Scholar]
- Miao Z, Shastri Y, Grift TE, et al. Lignocellulosic biomass feedstock transportation alternatives, logistics, equipment configurations, and modeling. Biofuels Bioprod Bior. 2012;6:351–62. [Google Scholar]
- Nevoigt E. Progress in metabolic engineering of Saccharomyces cerevisiae. Microbiol Mol Biol Rev. 2008;72:379–412. doi: 10.1128/MMBR.00025-07. [DOI] [PMC free article] [PubMed] [Google Scholar]
- Nielsen J, Larsson C, van Maris A, et al. Metabolic engineering of yeast for production of fuels and chemicals. Curr Opin Biotech. 2013;24:398–404. doi: 10.1016/j.copbio.2013.03.023. [DOI] [PubMed] [Google Scholar]
- Nijkamp JF, van den Broek M, Datema E, et al. De novo sequencing, assembly and analysis of the genome of the laboratory strain Saccharomyces cerevisiae CEN.PK113-7D, a model for modern industrial biotechnology. Microb Cell Fact. 2012a;11:36. doi: 10.1186/1475-2859-11-36. [DOI] [PMC free article] [PubMed] [Google Scholar]
- Nijkamp JF, van den Broek MA, Geertman JM, et al. De novo detection of copy number variation by co-assembly. Bioinformatics. 2012b;28:3195–202. doi: 10.1093/bioinformatics/bts601. [DOI] [PubMed] [Google Scholar]
- Oud B, van Maris AJ, Daran JM, et al. Genome-wide analytical approaches for reverse metabolic engineering of industrially relevant phenotypes in yeast. FEMS Yeast Res. 2012;12:183–96. doi: 10.1111/j.1567-1364.2011.00776.x. [DOI] [PMC free article] [PubMed] [Google Scholar]
- Paddon CJ, Westfall PJ, Pitera DJ, et al. High-level semi-synthetic production of the potent antimalarial artemisinin. Nature. 2013;496:528–32. doi: 10.1038/nature12051. [DOI] [PubMed] [Google Scholar]
- Paiva S, Devaux F, Barbosa S, et al. Ady2p is essential for the acetate permease activity in the yeast Saccharomyces cerevisiae. Yeast. 2004;21:201–10. doi: 10.1002/yea.1056. [DOI] [PubMed] [Google Scholar]
- Peng B, Williams TC, Henry M, et al. Controlling heterologous gene expression in yeast cell factories on different carbon substrates and across the diauxic shift: a comparison of yeast promoter activities. Microb Cell Fact. 2015;14:91. doi: 10.1186/s12934-015-0278-5. [DOI] [PMC free article] [PubMed] [Google Scholar]
- Postma E, Verduyn C, Scheffers WA, et al. Enzymic analysis of the crabtree effect in glucose-limited chemostat cultures of Saccharomyces cerevisiae. Appl Environ Microb. 1989;55:468–77. doi: 10.1128/aem.55.2.468-477.1989. [DOI] [PMC free article] [PubMed] [Google Scholar]
- Pronk JT, Steensma HY, van Dijken JP. Pyruvate metabolism in Saccharomyces cerevisiae. Yeast. 1996;12:1607–33. doi: 10.1002/(sici)1097-0061(199612)12:16<1607::aid-yea70>3.0.co;2-4. [DOI] [PubMed] [Google Scholar]
- Pronk JT, van Maris AJ, Guadalupe Medina V. In: Fermentative Glycerol - Free Ethanol Production. Delft TU, editor. 2011. Patent WO 2011010923 (A1) [Google Scholar]
- Russell DW, Jensen R, Zoller MJ, et al. Structure of the Saccharomyces cerevisiaeHO gene and analysis of its upstream regulatory region. Mol Cell Biol. 1986;6:4281–94. doi: 10.1128/mcb.6.12.4281. [DOI] [PMC free article] [PubMed] [Google Scholar]
- Seifar RM, Ras C, Deshmukh AT, et al. Quantitative analysis of intracellular coenzymes in Saccharomyces cerevisiae using ion pair reversed phase ultra high performance liquid chromatography tandem mass spectrometry. J Chromatogr A. 2013;1311:115–20. doi: 10.1016/j.chroma.2013.08.076. [DOI] [PubMed] [Google Scholar]
- Shiba Y, Paradise EM, Kirby J, et al. Engineering of the pyruvate dehydrogenase bypass in Saccharomyces cerevisiae for high-level production of isoprenoids. Metab Eng. 2007;9:160–8. doi: 10.1016/j.ymben.2006.10.005. [DOI] [PubMed] [Google Scholar]
- Skaggs BA, Alexander JF, Pierson CA, et al. Cloning and characterization of the Saccharomyces cerevisiae C-22 sterol desaturase gene, encoding a second cytochrome P-450 involved in ergosterol biosynthesis. Gene. 1996;169:105–9. doi: 10.1016/0378-1119(95)00770-9. [DOI] [PubMed] [Google Scholar]
- Solis-Escalante D, Kuijpers NG, Bongaerts N, et al. amdSYM, a new dominant recyclable marker cassette for Saccharomyces cerevisiae. FEMS Yeast Res. 2013;13:126–39. doi: 10.1111/1567-1364.12024. [DOI] [PMC free article] [PubMed] [Google Scholar]
- Steen EJ, Chan R, Prasad N, et al. Metabolic engineering of Saccharomyces cerevisiae for the production of n-butanol. Microb Cell Fact. 2008;7:36. doi: 10.1186/1475-2859-7-36. [DOI] [PMC free article] [PubMed] [Google Scholar]
- Su SS, Mitchell AP. Molecular characterization of the yeast meiotic regulatory gene RIM1. Nucleic Acids Res. 1993;21:3789–97. doi: 10.1093/nar/21.16.3789. [DOI] [PMC free article] [PubMed] [Google Scholar]
- Tang X, Feng H, Chen WN. Metabolic engineering for enhanced fatty acids synthesis in Saccharomyces cerevisiae. Metab Eng. 2013;16:95–102. doi: 10.1016/j.ymben.2013.01.003. [DOI] [PubMed] [Google Scholar]
- Tuma DJ, Casey CA. Dangerous byproducts of alcohol breakdown–focus on adducts. Alcohol Res Health. 2003;27:285–90. [PMC free article] [PubMed] [Google Scholar]
- Van Dam JC, Eman MR, Frank J, et al. Analysis of glycolytic intermediates in Saccharomyces cerevisiae using anion exchange chromatography and electrospray ionization with tandem mass spectrometric detection. Anal Chim Acta. 2002;460:209–18. [Google Scholar]
- van den Berg MA, de Jong-Gubbels P, Kortland CJ, et al. The two acetyl-coenzyme A synthetases of Saccharomyces cerevisiae differ with respect to kinetic properties and transcriptional regulation. J Biol Chem. 1996;271:28 953–9. doi: 10.1074/jbc.271.46.28953. [DOI] [PubMed] [Google Scholar]
- van Maris AJ, Winkler AA, Kuyper M, et al. Development of efficient xylose fermentation in Saccharomyces cerevisiae: xylose isomerase as a key component. Adv Biochem Eng Biotechnol. 2007;108:179–204. doi: 10.1007/10_2007_057. [DOI] [PubMed] [Google Scholar]
- Veen M, Lang C. Production of lipid compounds in the yeast Saccharomyces cerevisiae. Appl Microbiol Biot. 2004;63:635–46. doi: 10.1007/s00253-003-1456-7. [DOI] [PubMed] [Google Scholar]
- Verduyn C. Physiology of yeasts in relation to biomass yields. Anton Van Lee. 1991;60:325–53. doi: 10.1007/BF00430373. [DOI] [PubMed] [Google Scholar]
- Verduyn C, Postma E, Scheffers WA, et al. Effect of benzoic acid on metabolic fluxes in yeasts: a continuous-culture study on the regulation of respiration and alcoholic fermentation. Yeast. 1992;8:501–17. doi: 10.1002/yea.320080703. [DOI] [PubMed] [Google Scholar]
- Wisselink HW, Toirkens MJ, del Rosario Franco Berriel M, et al. Engineering of Saccharomyces cerevisiae for efficient anaerobic alcoholic fermentation of L-arabinose. Appl Environ Microb. 2007;73:4881–91. doi: 10.1128/AEM.00177-07. [DOI] [PMC free article] [PubMed] [Google Scholar]
- Wisselink HW, Toirkens MJ, Wu Q, et al. Novel evolutionary engineering approach for accelerated utilization of glucose, xylose, and arabinose mixtures by engineered Saccharomyces cerevisiae strains. Appl Environ Microb. 2009;75:907–14. doi: 10.1128/AEM.02268-08. [DOI] [PMC free article] [PubMed] [Google Scholar]
- Wu L, Mashego MR, van Dam JC, et al. Quantitative analysis of the microbial metabolome by isotope dilution mass spectrometry using uniformly 13C-labeled cell extracts as internal standards. Anal Biochem. 2005;336:164–71. doi: 10.1016/j.ab.2004.09.001. [DOI] [PubMed] [Google Scholar]
Associated Data
This section collects any data citations, data availability statements, or supplementary materials included in this article.