Abstract
Background
Fatty acids (FA) and their metabolites are closely related to some mechanisms involved in the development of uronephrolithiasis. The aim of this study was to evaluate the relationship between FA composition and type of kidney stones.
Material/Methods
Abdominal adipose tissue fatty acid methyl esters of 71 men with nephrolithiasis were identified by GC/MS, and the type of kidney stones was identified using FTIR infrared spectroscopy. Patients were divided into groups according to diagnosis of metabolic syndrome (MS) and type of kidney stone. The composition of FA was compared within different groups of patients with different types of kidney stones and between the patients and healthy individuals (control group) (n=100).
Results
Individuals with nephrolithiasis had a significantly higher level of monounsaturated fatty acids (MUFA) and a lower level of polyunsaturated fatty acids (PUFA) versus healthy individuals. Patients with MS had a higher level of 18: 1ω9 and a lower level of 16: 1ω7 than patients without MS. Individuals with nephrolithiasis, but without MS, had a higher level of saturated fatty acids (SFA) compared to controls. The level of PUFA was higher in the control group (p<0.0001) compared to individuals with uronephrolithiasis, with or without MS. PUFA, ω – 6 PUFA, and 18: 2ω6 were higher in patients with calcium-based kidney stones without MS versus patients with uric acid kidney stones with MS.
Conclusions
The levels of MUFA were significantly higher and the levels of PUFA were significantly lower in patients with uronephrolithiasis compared to controls.
MeSH Keywords: Fatty Acids, Kidney Calculi, Metabolic Syndrome X
Background
Nephrolithiasis is a multifactorial disease influenced by lifestyle and nutritional habits, as well as metabolic, environmental, and genetic factors. During recent decades, growth in the prevalence of nephrolithiasis has been observed in Western countries [1]. According to the National Health and Nutrition Examination Survey (NHANES), the prevalence of kidney stones reached 8.8% in the period 2007–2010. Kidney stone disease increased from 6.3% to 10.6% among men and from 4.1% to 7.1% among women [2]. The variety and complexity of the processes influencing stone formation prevents a single explanation for the etiology and pathogenesis of the disease, which in turn causes a lack of appropriate prevention measures. This fact is confirmed by the increasingly high recurrence rates of urolithiasis. Recurrence of nephrolithiasis over the first 5 years increases by 50% after the first episode. This has a significant impact on quality of life. Furthermore, the prevalence and incidence of kidney stone disease increased across the world throughout the 20th century. For example, in the USA the prevalence of the disease is approximately 10% (13% for men and 7% for women), which is a drastic increase from the 3% recorded in the period 1964–1972 [3]. European countries follow similar trends, and urolithiasis is becoming a major health care problem worldwide. It is acknowledged that the need for an individual-based treatment approach is now an important challenge [4].
Around 80% of all kidney stones are composed of calcium oxalate and calcium phosphate. Other cases of nephrolithiasis are caused by magnesium ammonium phosphate, cysteine, uric acid, and struvite kidney stones [2]. Nevertheless, most kidney stones are calcium phosphate monohydrate surrounding a calcium phosphate core [6].
According to some studies, fatty acids (FA) and their metabolites are closely related to some mechanisms involved in the development of nephrolithiasis [1,4–7]. Abdomen adipose tissue reflects the long-term consumption of FA. Metabolic processes in adipose tissue are quite slow, and acute health disorders have no influence on the composition of adipose tissue [8]. There is very little information and few comprehensive studies on the formation of different types of kidney stones as determined by factors influencing the composition of adipose tissue FA in the abdomen.
Several explanations concerning the impact of FA on the development of kidney stones are possible. According to some researchers, FA have a direct influence on renal tubules, crystal formation, the metabolism of salt and water in the kidneys, and on oxidative and inflammatory processes. Others declare that FA are more likely related to metabolic syndrome (MS). MS is defined by the following diagnostic criteria: glucose intolerance, hypertension, decreased high-density lipoprotein (HDL) level, increased triacylglycerol (TAG) level, and visceral obesity [9]. Scientific data showing the relationship between MS and type of kidney stone is still controversial. According to some researchers, MS causes lower urine pH, higher calcium and uric acid excretion, and lower citrate excretion, leading to formation of uric acid and calcium-based stones [10]. According to others, MS is more closely related to uric acid stones, because patients with MS have significantly more formation of uric acid stones [11].
On the other hand, an excess of lipids and FA in renal proximal tubules could impede ammonium synthesis and transport because glutamine transport is interfered with through the mitochondrial membrane. Accumulation of lipids in kidney and renal tubules could also be associated with aberrant tissue sensitivity to insulin [7,12]. Abdominal adipose tissue adipocytes eventually lose their ability to store FA adequately. Because of insulin resistance, free FA interact with liver enzyme systems and induce glucose synthesis, decrease insulin clearance, increase TAG and low-density lipoprotein (LDL) levels, and decrease HDL level, accelerating early atherogenesis [7]. There is evidence that increased levels of TAG and cholesterol in the blood leads to the formation of uric acid stones. Increased concentration of LDL in the blood, on the other hand, increases Na+ ion excretion and uric acid concentration in the urine [13].
Katsoulieris et al. studied the effects of saturated palmitic fatty acid on proximal renal tubular cells in vitro and found that palmitic FA caused endoplasmic reticulum stress, which led to renal proximal tubular cell apoptosis. The opposite effect was noted when using α-linolenic FA, which decreased the concentration of proinflammatory substances and diminished cell apoptosis in vitro [14].
Moreover, it is thought that palmitic FA induces the expression of monocyte chemotaxis protein (MCP-1). Palmitic acid activates protein kinase C (PKC) family proteins through accumulation of intracellular diacylglycerol (DAG). Oleic FA and EPA induce diacylglycerol acyltransferase 2 gene expression and convert intracellular DAG to TAG, resulting in PKC gene suppression. Renal tubular cells are therefore protected from the harmful effect of palmitic acid [15]. Other authors have reported that the abundance of free FA exceeds the mitochondrial capability to oxidize them and consequently leads to the production of partially oxidized acylcarnitine with an excess of DAG, both of which predispose a person to insulin resistance [16]. FA directly or through signal molecules influence gene transcription in the liver and are capable of regulating lipogenesis, β-oxidation of FA, and glucose metabolism [17]. Nevertheless, the data concerning the relationship between the composition of FA in adipose tissue and nephrolithiasis remain contradictory. We therefore designed this study to evaluate the relationship between the composition of abdominal adipose tissue FA and type of kidney stones.
Material and Methods
This case-control study (duration: 1.5 years) was carried out on a group of 71 men (average age 53.1±14.1) with kidney stone disease; enrolled individuals were hospitalized at Vilnius University Hospital and gave their written consent to participate in the study (case group). The control group had no history of kidney stone disease, and was matched with cases for age and sex (n=100). All patients were thoroughly examined to diagnose MS according to clinical and laboratory criteria [18]. The kidney stones of patients were removed and the chemical composition of the stones was examined using infrared spectroscopy.
The study protocol was approved by the Vilnius Regional Bioethics Committee (Approval No. 158200-5-053-056LP1).
The chemical composition of the stones was examined by a BRUKER VERTEX 70 Fourier transform infrared (FTIR) spectrometer by using a KBr tablet [19].
Methyl esters of adipose tissue FA were prepared using the Folch method [20,21] and were identified by gas chromatography–mass spectrometry (GCMS-QP2010 Ultra, Shimadzu) (Table 1). Individuals were divided into groups according to diagnosis of (MS) and type of kidney stone (Figure 1). The composition of adipose tissue FA was compared within different groups of patients with different types of kidney stones and between the patients and control individuals.
Table 1.
FA analyzed by gas chromatography – mass spectrometry.
| SFA | MUFA | PUFA |
|---|---|---|
| 14: 0 (miristic acid) | 16: 1ω7 (9 – hexadecanoic/palmitoleic acid) | 18: 2ω6 (9,12 – octadecadienoi/linoleic acid) |
| 16: 0 (palmitic acid) | 18: 1ω9 (9 – octadecanoic/oleic acid) | 18: 3ω3 (9,12,15 – octadecatrienoic, α-linolenic acid) |
| 18: 0 (stearic acid) | 18: 1ω7 (11 – octadecanoic acid) | 20: 4ω6 (5,8,11,14 – eicosatetraenoic/arachidonic acid) |
| 20: 1ω9 (11 – eicosanoic acid) | 20: 5ω3 (5,8,11,14,17 – eicosapentaenoic acid) | |
| 22: 5ω3 (7,10,13,16,19 – docosapentaenoic acid) | ||
| 22: 6ω3 (4,7,10,13,16,19 – docosahexaenoic acid) |
Figure 1.
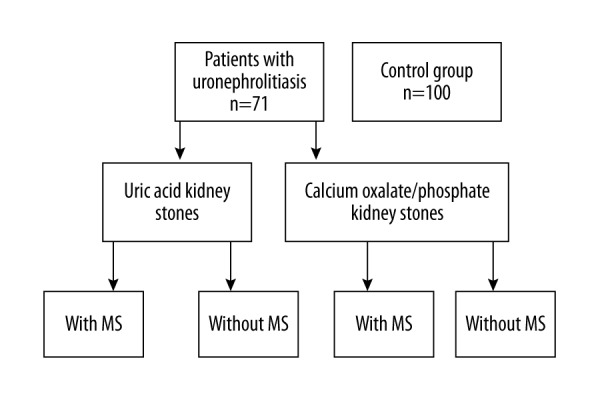
Doistribution of this study population.
Statistical analysis
Data analysis was carried out using the IBM SPSS software (version 21) and Microsoft Excel 2013. Data are expressed as mean ± standard deviation. Differences between investigated groups were tested for significance using the Mann-Whitney U-test and the t test. Statistical significance was considered at p<0.05.
Results
Figure 2 shows the distribution of patients with uronephrolithiasis by type of kidney stones and presence of MS. Calcium-based kidney stones were the most common among the patients with nephrolithiasis, while uric acid stones were the least common. For further analysis, individuals with nephrolithiasis were divided into 2 groups: those with MS (32.4%) and those without MS (67.6%). Seventy percent of patients with uric acid kidney stones had MS, and only 41% of individuals with calcium-based kidney stones (involving both calcium oxalate and calcium phosphate) had MS. The frequency of MS of individuals with uric acid kidney stones was 2 times higher than that of patients with calcium-based kidney stones. Moreover, MS was significantly more frequent in patients with uric acid kidney stones compared to individuals with calcium-based kidney stones (Pearson chi-square=8.308, p=0.004).
Figure 2.
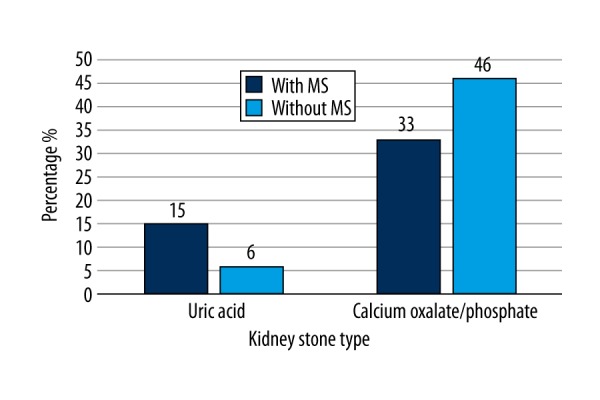
Diagram represents the percentage distribution of patients with uronephrolithiasis by type of kidney stones and MS. N=71.
According to the presence or absence of MS, all patients with uric acid and calcium-based kidney stones were subdivided into 2 groups: those with and without MS (Table 2). The total PUFA (Figure 3), ω6 PUFA (Figure 4), and 18: 2ω6 (Figure 5) percentages were significantly higher in patients with calcium-based stones without MS compared to the patients with uric acid kidney stones with MS.
Table 2.
Comparison of adipose tissue FA composition between patients with uric acid kidney stones and MS and the patients with calcium-based kidney stones without MS.
| FA (provided by percentage of total amount) | Uric acid (n=11) | Calcium oxalate/phosphate (n=38) | P value |
|---|---|---|---|
| With MS | Without MS | ||
| Mean ± Standard deviation | |||
| Total PUFA | 12.61±1.70 | 14.64±2.88 | p=0.037 |
| ∑* ω**6 | 11.94±1.6 | 13.97±2.71 | p=0.042 |
| C 18: 2ω6*** | 11.62±1.57 | 13.55±2.61 | p=0.042 |
PUFA – polyunsaturated fatty acids; ∑* – total sum; ω** – position of double bond between carbon atoms; C 18: 2ω6*** – number of carbon atoms and double bonds. Mean and standard deviation of other fatty acids (C 14: 0, C 16: 0, C 18: 0, C 16: 1ω7, C 18: 1ω9, C 18: 1ω7, C 20: 1ω9) were not statistically significant.
Figure 3.
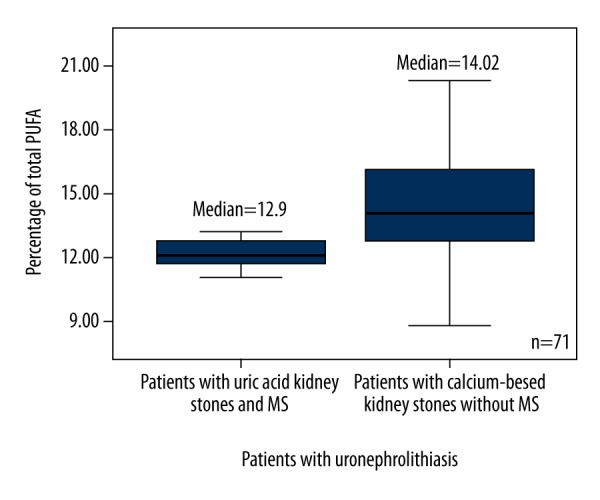
Box plots represent comparison of percentage of total PUFA between patients with uric acid kidney stones and MS, and the patients with calcium-based kidney stones without MS. P=0.037. N=71. PUFA – polyunsaturated fatty acid.
Figure 4.
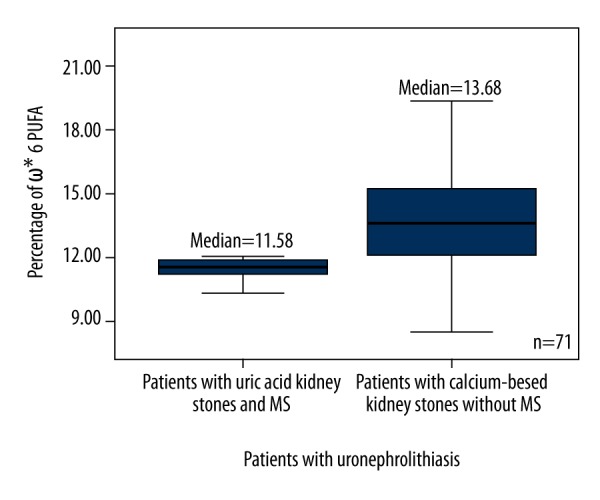
Box plots represent comparison of percentage of ω6 PUFA between patients with uric acid kidney stones and MS, and the patients with calcium-based kidney stones without MS. P=0.042. N=71. * – Omega; PUFA – polyunsaturated fatty acid.
Figure 5.
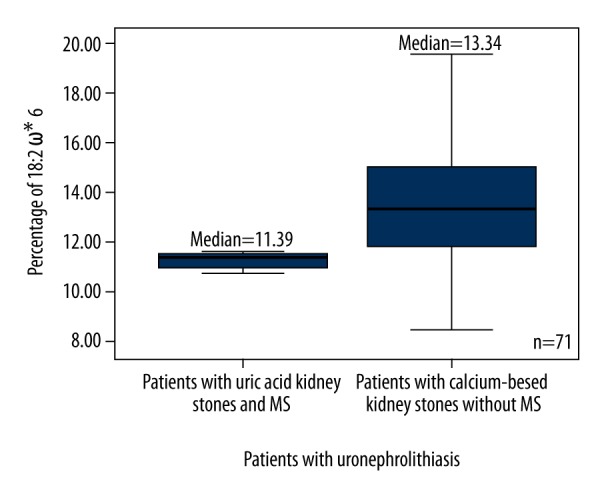
Box plots represent comparison of percentage of 18: 2 ω6 between patients with uric acid kidney stones and MS, and the patients with calcium-based kidney stones without MS. P=0.042. N=71. * – Omega; PUFA – polyunsaturated fatty acid.
The results were significantly different between all groups of patients and the control group. The level of monounsaturated fatty acids (MUFA) in patients with uric acid and calcium-based stones was 2 times higher than it was in the control group (p<0.0001) (Figure 6), (18: 1ω9 was predominant). The level of PUFA was 2.4–2.8 times lower in each group of patients with nephrolithiasis compared to the control (p<0.0001) (Table 3) (Figure 7). The ratio of ω3 and ω6 PUFA was higher in the control group than in patients with kidney stones. The total level of SFA was almost the same in each group of patients with kidney stones compared to the control group. Patients with nephrolithiasis had a higher level of SFA 16: 0 (p=0.001; p<0.0001) and a similar level of SFA 14: 0 (p>0.05) compared to the control group. However, the patients with calcium-based kidney stones had a lower level of SFA 18: 0 compared to the control group (p<0.0001).
Figure 6.
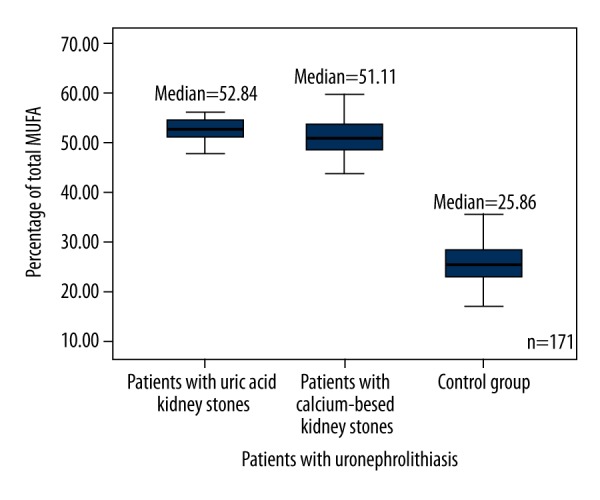
Box plots represent comparison of percentage of total MUFA between all groups of patients and the control group. P<0.0001. N=171. MUFA – monounsaturated fatty acids.
Table 3.
Comparison of the composition of FA in adipose tissue between patients with nephrolithiasis and the control group.
| FA (provided by percentage of total amount) | Uric acid* (n=15) | Calcium oxalate/phosphate# (n=56) | Control## (n=100) | P value |
|---|---|---|---|---|
| Mean ± Standard deviation | ||||
| C 18: 1×ω**9 | 44.37±3.35 | 42.40±4.38 | 22.71±3.69 | *,#,##p<0.0001 |
| C 20: 1ω9 | 1.09±0.21 | 1.03±0.56 | 0.56±0.48 | *,#,##p<0.0001 |
| C 18: 3ω3 | 0.15±0.03 | 0.20±0.11 | 1.12±0.54 | *,#,##p<0.0001 |
| C 22: 5ω3 | 0.19±0.09 | 0.20±0.15 | 0.39±0.27 | *,#,##p=0.002 |
| Ratio of ω3/ω6 | 0.05±0.02 | 0.04±0.02 | 1.13±0.28 | *,#,##p<0.0001 |
| Total SFA (C 14: 0 + C 16: 0 + C 18: 0) | 34.67±3.03 | 33.55±2.81 | 32.14±5.29 |
*,##p=1.0 #,##p=0.608 |
| Total MUFA | 53.07±3.54 | 51.78±3.84 | 26.2±4.27 | *,#,##p<0.0001 |
| Total PUFA | 12.66±2.47 | 14.67±3.47 | 35.13±4.84 | *,#,##p<0.0001 |
| PUFA/SFA | 0.37±0.085 | 0.44±0.12 | 1.13±0.29 | *,#,##p<0.0001 |
| ∑*** ω3 | 0.63±0.26 | 0.7±0.44 | 4.5±1.46 | *,#,##p<0.0001 |
| ∑ ω6 | 12.03±2.33 | 13.97±3.13 | 27.92±4.56 | *,#,##p<0.0001 |
| C 14: 0 | 3.33±0.74 | 3.56±3.5 | 4.5±2.34 | p>0.05 |
| C 16: 0 | 24.88±1.74 | 24.8±2.04 | 21.91±2.4 |
*,##p=0.001 #,##p<0.0001 |
| C 18: 0 | 6.06±1.34 | 5.19±1.09 | 6.49±1.05 |
*,#,##p>0.05 #,##p<0.0001 |
| C 16: 1ω7 | 5.08±1.68 | 5.7±1.68 | 3.48±0.99 |
*,##p=0.003 #,##p<0.0001 |
| C 18: 2ω6 | 11.75±2.3 | 13.58±2.99 | 22.59±3.98 | *,#,##p<0.0001 |
| C 20: 4ω6 | 0.28±0.1 | 0.39±0.24 | 5.33±1.11 | *,#,##p<0.0001 |
| C 20: 5ω3 | 0.09±0.05 | 0.11±0.07 | 1.06±0.68 | *,#,##p<0.0001 |
| C 22: 6ω3 | 0.19±0.12 | 0.19±0.15 | 1.93±0.73 | *,#,##p<0.0001 |
SFA – saturated fatty acids; MUFA – monounsaturated fatty acids; PUFA – polyunsaturated fatty acids; * – patients with uric acid kidney stones; # – patients with calcium oxalate/phosphate kidney stones; ## – control group; C 18: 1× – number of carbon atoms and double bonds; ω** – position of double bond between carbon atoms in the molecule; ∑*** – total sum.
Figure 7.
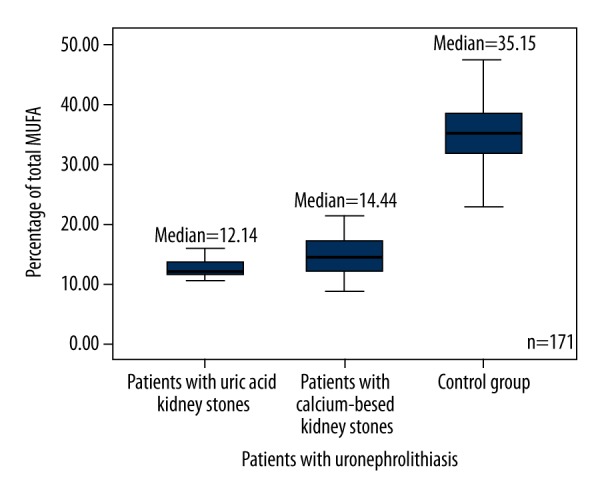
Box plots represent comparison of percentage of total PUFA between all groups of patients and the control group. P<0.0001. N=171. PUFA – polyunsaturated fatty acid.
For further analysis, all patients with nephrolithiasis were subdivided into 2 groups: those with and without MS. Each of those groups was compared to the control group (Table 4). Patients with MS had a significantly higher level of 18: 1ω9 (p=0.041) and a lower level of 16: 1ω7 (p=0.003) compared to kidney stone patients without MS. The total level of MUFA was equal in both groups of kidney stone patients with and without MS (p=0.762), but it was approximately 2-fold higher compared to the control group of healthy people (p<0.0001). The level of SFA was significantly higher in kidney stone patients without MS compared to controls (p=0.008).
Table 4.
Comparison of FA composition in adipose tissue between patients with kidney stones and the control group.
| FA (provided by percentage of total amount) | Patients (n=71) | Controls## (n=100) | P value | |
|---|---|---|---|---|
| Without MS* (n=48) | With MS# (n=23) | |||
| Mean ± Standard deviation | ||||
| C 18: 1×ω**9 | 40.79±7.52 | 43.77±4.61 | 22.71±3.69 |
*,#p=0.041 *,##;#,##p<0.0001 |
| C 20: 1ω9 | 1.26±0.80 | 0.92±0.35 | 0.56±0.48 |
*,#p=0.199 *,##;#,##p<0.0001 |
| C 18: 3ω3 | 0.22±0.17 | 0.21±0.13 | 1.12±0.54 |
*,#p=0.858 *,##;#,##p<0.0001 |
| C 22: 5ω3 | 0.23±0.23 | 0.21±0.17 | 0.39±0.27 |
*,#p=0.941 *,##;#,##p<0.0001 |
| Ratio of ω3/ω6 | 0.05±0.03 | 0.05±0.02 | 1.13±0.28 |
*,#p=0.912 *,##;#,##p<0.0001 |
| Total SFA (C 14: 0 + C 16: 0 + C 18: 0) | 34.54±3.89 | 33.62±2.88 | 32.14±5.29 |
*,#p=1.0 *,##p=0.008 #,##p=0.518 |
| Total MUFA | 51.04±4.93 | 52.30±3.91 | 26.19±4.27 |
*,#p=0.762 *,##;#,##p<0.0001 |
| Total PUFA | 14.42±3.08 | 14.07±3.78 | 35.13±4.84 |
*,#p=1.0 *,##;#,##p<0.0001 |
| Ratio of PUFA/SFA | 0.42±0.1 | 0.42±0.13 | 1.13±0.29 |
*,#p=1.0 *,##;#,##p<0.0001 |
| ∑***ω3 | 0.76±0.58 | 0.72±0.52 | 4.5±1.46 |
*,#p=1.0 *,##;#,##p<0.0001 |
| ∑ ω6 | 13.67±2.82 | 13.36±3.34 | 27.91±4.56 |
*,#p=1.0 *,##;#,##p<0.0001 |
| C 14: 0 | 3.8±1.13 | 3.3±0.81 | 4.49±2.34 |
*,#p=1.0 *,##p=0.124 #,##p=0.029 |
| C 16: 0 | 25.01±2.51 | 24.94±2.05 | 21.9±2.4 |
*,#p=1.0 *,##;#,##p<0.0001 |
| C 18: 0 | 5.72±1.44 | 5.38±1.1 | 6.49±1.05 |
*,#p=0.709 *,###,##p<0.0001 |
| C 16: 1ω7 | 6.23±2.41 | 5.03±1.65 | 3.48±0.99 |
*,#p=0.003 *,##;#,##p<0.0001 |
| C 18: 2ω6 | 13.25±2.7 | 13.02±3.2 | 22.59±3.98 |
*,##p=1.0 *,##;#,##p<0.0001 |
| C 20: 4ω6 | 0.42±0.3 | 0.34±0.23 | 5.33±1.11 |
*,#p=1.0 *,##;#,##p<0.0001 |
| C 20: 5ω3 | 0.11±0.07 | 0.1±0.08 | 1.06±0.68 |
*,##p=1.0 *,##;#,##p<0.0001 |
| C 22: 6ω3 | 0.19±0.15 | 0.19±0.17 | 1.92±0.73 |
*,#p=1.0 *,##;#,##p<0.0001 |
SFA – saturated fatty acids; MUFA – monounsaturated fatty acids; PUFA – polyunsaturated fatty acids; * – kidney stone patients without MS; # – kidney stone patients with MS; ## – control group; C 18: 1× – number of carbon atoms and double bonds; ω** – position of double bond between carbon atoms in the molecule; ∑*** – total sum.
Moreover, the percentage of ω3 PUFA in healthy individuals was about 6.3 times (p<0.0001) higher, and the percentage of ω6 PUFA was about 2 times higher than that in both groups of patients with kidney stones (p<0.0001). The ratio of ω3/ω6 PUFA in the control group was also higher than that in each group of patients.
Discussion
According to our data, MS occurred 2 times more frequently in individuals with uric acid kidney stones than in patients with calcium phosphate/oxalate kidney stones, but the difference was not statistically significant. According to recent scientific data, MS is very much related to the formation of uric acid kidney stones [22–24]. Uric acid kidney stones in those studies were more common in older patients with a higher body mass index (BMI) and lower urine pH and a higher uric acid level [22].
We found twice the amount of MUFA in the adipose tissue of patients with nephrolithiasis, regardless of the type of kidney stone, than in healthy individuals in the control group. Lack of ω3 and ω6 PUFA causes a compensatory increase in the synthesis of MUFA, which leads to increased production of ω9 PUFA. On the other hand, the diet of patients with nephrolithiasis may contain more MUFA than the diet of healthy individuals in the control group.
Peña-Orihuela found that a diet higher in MUFA promotes the gene expression of antioxidant enzymes in adipose tissue (e.g., glutathione peroxidase and catalase) and thus reduces oxidative stress. Increased dietary intake of SFA in adipose tissue of obese individuals stimulates the enzyme NADPH – oxidase, which promotes the synthesis of reactive oxygen compounds and gene expression and inhibits expression of genes encoding antioxidant enzymes. Therefore, researchers believe that SFA should be replaced with MUFA since it would be an effective way to reduce oxidative stress for individuals with MS [25]. Furthermore, experiments on laboratory mice suggest that replacement of SFA by MUFA reduces the inflammation in adipose tissue and insulin resistance as well [26].
Our study showed that individuals with nephrolithiasis had a percentage of total PUFA in adipose tissue 2 times lower than in the control group (p<0.0001). The percentage of PUFA in adipose tissue basically reflects the human diet. A major percentage of total PUFA represents linoleic and α-linolenic FA. We therefore assume that individuals with nephrolithiasis had a lack of PUFA in their diet, and this lack of linoleic and α-linolenic FA can cause a slowdown of the synthesis of other ω3 and ω6 PUFA.
Increased dietary intake of PUFA prevents lipid accumulation in the liver and the adipose tissue of the abdominal area. The reverse effect is, however, characteristic of SFA [28]. In vitro data on a culture of proximal renal tubular cells showed that PUFA (α-linolenic, EPA) and MUFA (oleic) reduce oxidative stress and inhibit endoplasmic reticulum stress, which can lead to cell apoptosis [15,27].
We also found that patients with nephrolithiasis had a higher level of 16: 1ω7 and a lower level of EPA in adipose tissue than in the control group. However, individuals with MS had significantly less 16: 1ω7 and more 18: 1ω9 than those who had not been diagnosed with MS. Our results can therefore confirm that individuals with nephrolithiasis consume a lower level of essential PUFA; therefore, synthesis of MUFA increases, leading to increased levels of 16: 1ω7and 18: 1ω9 in adipose tissue.
Canadian researchers compared the spectrum of FA in blood phospholipids in 734 cardiovascular patients with and without MS. They found increased levels of SFA (16: 0, 18: 0) and ω6 PUFA (18: 3ω6, 22: 6ω6) and decreased amounts of ω3 PUFA (20: 5ω3 and 22: 6ω3) in patients with MS compared to patients without MS [29]. Our study, however, showed that the total percentage of SFA in the adipose tissue of individuals with MS did not differ from that of the control group. Nevertheless, patients without MS had a higher level of SFA than did controls (34.54±3.89 versus32.14±5.29, p=0.008).
When individuals were grouped by origin of kidney stones and MS, we also found that the total percentages of PUFA, ω6 PUFA, and 18: 2ω6 were significantly higher in the calcium oxalate/phosphate kidney stone group without MS versus the uric acid kidney stone group with MS. This can be explained by the fact that the metabolism of PUFA in patients with MS is impaired. There may also be a lack of dietary intake of PUFA.
The higher percentage of ω6 PUFA in the adipose tissue of patients with uronephrolithiasis may cause more eicosanoids to be synthesized from those PUFA. Although no specific concentrations of eicosanoids were studied, according to scientific data, eicosanoids can have a significant impact on the pathogenesis of nephrolithiasis, directly or indirectly participating in inflammation.
Conclusions
Our study results from the patients with uronephrolithiasis differed from results from the control group. Irrespective of MS diagnosis, all individuals with kidney stones had significantly higher percentages of MUFA and lower percentages of PUFA than did healthy individuals. The elevated level of MUFA was a result of the significantly higher percentage of 18: 1ω9 FA in kidney stone patients with MS compared to patients without MS, and could be related to a potential disorder of PUFA metabolism specific to MS. One of the causes of MS, and the cause of increased acidity and changes in the chemical composition of urine, is the lower amount of PUFA, ω6 PUFA, and 18: 2ω6 in the adipose tissue of patients with uric acid kidney stones and MS compared to patients with calcium-based kidney stones and without MS. The results of our study show an elevated level of SFA in kidney stone patients without MS compared to the control group.
Footnotes
Conflict of interest
None.
Source of support: The study was supported by the Lithuanian State Science and Studies Foundation (Grant No. T-59/09) and the Research Council of Lithuania (Grant No. MIP-111/2010)
References
- 1.Sakhaee K. Nephrolithiasis as a systemic disorder. Curr Opin Nephrol Hypertens. 2008;17:304–9. doi: 10.1097/MNH.0b013e3282f8b34d. [DOI] [PubMed] [Google Scholar]
- 2.Richman K, O’Bell J, Pareek G. The growing prevalence of kidney stones and opportunities for prevention. R I Med J. 2014;97(12):31–34. [PubMed] [Google Scholar]
- 3.Romero V, Akpinar H, Assimos DG. Kidney stones: A global picture of prevalence, incidence, and associated risk factors. Rev Urol. 2010;12(2/3):e86–96. [PMC free article] [PubMed] [Google Scholar]
- 4.Bagga HS, Chi T, Miller J, Stoller ML. New insights into the pathogenesis of renal calculi. Urol Clin North Am. 2013;40(1):1–12. doi: 10.1016/j.ucl.2012.09.006. [DOI] [PMC free article] [PubMed] [Google Scholar]
- 5.Moe OW. Kidney stones: Pathophysiology and medical management. Lancet. 2006;367:333–44. doi: 10.1016/S0140-6736(06)68071-9. [DOI] [PubMed] [Google Scholar]
- 6.Xie B, Halter TJ, Borah BM, Nancollas GH. Aggregation of calcium phosphate and oxalate phases in the formation of renal stones. Cryst Growth Des. 2015;15:204–11. doi: 10.1021/cg501209h. [DOI] [PMC free article] [PubMed] [Google Scholar]
- 7.Hendrixson V, Chomanskis Ž. Pathogenetic links in metabolic syndrome and urolithiasis. Laboratorinė Medicina. 2010;12( 46):87–94. [Google Scholar]
- 8.Baylin A, Kabagambe EK, Siles X, Campos H. Adipose tissue biomarkers of fatty acid intake. Am J Clin Nutr. 2002;76(4):750–57. doi: 10.1093/ajcn/76.4.750. [DOI] [PubMed] [Google Scholar]
- 9.Alberti KG, Zimmet P, Shaw J. The metabolic syndrome – a new world – wide definition. Lancet. 2005;366:1059–62. doi: 10.1016/S0140-6736(05)67402-8. [DOI] [PubMed] [Google Scholar]
- 10.Sung TC, Seung IJ, Soon CM, Tae HK. Correlation of metabolic syndrome with urinary stone composition. Int J Urol. 2013;20:208–13. doi: 10.1111/j.1442-2042.2012.03131.x. [DOI] [PubMed] [Google Scholar]
- 11.Akman T, Binbay M, Erbin A, et al. The impact of metabolic syndrome on long-term outcomes of percutaneous nephrolithotomy (PCNL) B J U Int. 2012;110(11):1079–83. doi: 10.1111/j.1464-410X.2012.11548.x. [DOI] [PubMed] [Google Scholar]
- 12.Jou YC, Fang CY, Chen SY, et al. Proteomic study of renal uric acid stone. Urology. 2012;80(2):260–66. doi: 10.1016/j.urology.2012.02.019. [DOI] [PubMed] [Google Scholar]
- 13.Torricelli FCM, De SK, Gebreselassie S, et al. Dyslipidemia and kidney stone risk. J Urol. 2014;191(3):667–72. doi: 10.1016/j.juro.2013.09.022. [DOI] [PubMed] [Google Scholar]
- 14.Cooke AA, Connaughton RM, Lyons CL, et al. Fatty acids and chronic low-grade inflammation associated with obesity and the metabolic syndrome. Eur J Pharm. 2016;12(785):207–14. doi: 10.1016/j.ejphar.2016.04.021. [DOI] [PubMed] [Google Scholar]
- 15.Soumura M, Kume S, Isshiki K, et al. Oleate and eicosapentaenoic acid attenuate palmitate-induced inflammation and apoptosis in renal proximal tubular cell. Biochem Biophys Res Commun. 2010;402(2):265–71. doi: 10.1016/j.bbrc.2010.10.012. [DOI] [PubMed] [Google Scholar]
- 16.Muoio DM, Neufer PD. Lipid-induced mitochondrial stress and insulin action in muscle. Cell Metab. 2012;15(5):595–605. doi: 10.1016/j.cmet.2012.04.010. [DOI] [PMC free article] [PubMed] [Google Scholar]
- 17.Jump DB, Tripathy S, Depner CM. Fatty acid – regulated transcription factors in the liver. Annu Rev Nutr. 2013;33:249–69. doi: 10.1146/annurev-nutr-071812-161139. [DOI] [PMC free article] [PubMed] [Google Scholar]
- 18.Grundy SM, Cleeman JI, Daniels SR, et al. American Heart Association; National Heart, Lung, and Blood Institute. Diagnosis and management of the metabolic syndrome: An American Heart Association/National Heart, Lung, and Blood Institute Scientific Statement. Circulation. 2005;112(17):2735–52. doi: 10.1161/CIRCULATIONAHA.105.169404. [DOI] [PubMed] [Google Scholar]
- 19.Hendrixson V, Šablinskas V, Leščiūtė D, et al. Infrared spectroscopical approach in kidney stones research. Laboratorinė Medicina. 2008;2(38):99–105. [Google Scholar]
- 20.Folch J, Lees M, Stanley G. A simple method for the isolation and purification of total lipids from animal tissue. J Biol Chem. 1957;226:497–509. [PubMed] [Google Scholar]
- 21.Stoffel W, Chu F, Ahrens E. Analysis of long – chain fatty acids by gas – liquid chromatography. Anal Chem. 1959;31(2):307–8. [Google Scholar]
- 22.Reichard C, Gill BC, Sarkissian C, et al. 100% uric acid stone formers: What makes them different? Urology. 2015;85(2):296–98. doi: 10.1016/j.urology.2014.10.029. [DOI] [PubMed] [Google Scholar]
- 23.Cho ST, Jung SI, Myung SC, Kim TH. Correlation of metabolic syndrome with urinary stone Composition. Int J Urol. 2013;20:208–13. doi: 10.1111/j.1442-2042.2012.03131.x. [DOI] [PubMed] [Google Scholar]
- 24.Hendrixson V, Malyško E, Mažeikienė A, et al. Prevalence of metabolic syndrome in patients with uric acid and calcium – based kidney stones. GSTF J Adv Med Res. 2014;1(2):1–7. [Google Scholar]
- 25.Peña-Orihuela P, Camargo A, Rangel-Zuñiga OA, et al. Antioxidant system response is modified by dietary fat in adipose tissue of metabolic syndrome patients. J Nutr Biochem. 2013;24(10):1717–23. doi: 10.1016/j.jnutbio.2013.02.012. [DOI] [PubMed] [Google Scholar]
- 26.Finucane OM, Lyons CL, Murphy AM, et al. Monounsaturated fatty acid – enriched high-fat diets impede adipose NLRP3 inflammasome – mediated IL-1β secretion and insulin resistance despite obesity. Diabetes. 2015;64(6):2116–28. doi: 10.2337/db14-1098. [DOI] [PubMed] [Google Scholar]
- 27.Katsoulieris E, Mabley JG, Samai M, et al. α-Linolenic acid protects renal cells against palmitic acid lipotoxicity via inhibition of endoplasmic reticulum stress. Eur J Pharm. 2009;623(1–3):107–12. doi: 10.1016/j.ejphar.2009.09.015. [DOI] [PubMed] [Google Scholar]
- 28.Rosqvist F, Iggman D, Kullberg J, et al. Overfeeding polyunsaturated and saturated fatty acids causes distinct effects on liver and visceral fat accumulation in humans. Diabetes. 2014;63:2356–68. doi: 10.2337/db13-1622. [DOI] [PubMed] [Google Scholar]
- 29.Nigam A1, Frasure-Smith N, Lespérance F, Julien P. Relationship between n-3 and n-6 plasma fatty acid levels and insulin resistance in coronary patients with and without metabolic syndrome. Nutr Metab Cardiovasc Dis. 2009;19( 4):264–270. doi: 10.1016/j.numecd.2008.07.008. [DOI] [PubMed] [Google Scholar]


