

SUMMARY
The timing of food intake and nutrient utilization is critical to health and regulated partly by the circadian clock. Increased amplitude of circadian oscillations and metabolic output has been found to improve health in diabetic and obesity mouse models. Here, we report a function for the circadian deadenylase Nocturnin as a regulator of metabolic amplitude across the day/night cycle and in response to nutrient challenge. We show that mice lacking Nocturnin (Noct−/−) display significantly increased amplitudes of mRNA expression of hepatic genes encoding key metabolic enzymes regulating lipid and cholesterol synthesis, both over the daily circadian cycle and in response to fasting and refeeding. Noct−/− mice have increased plasma triglyceride throughout the night and increased amplitude of hepatic cholesterol levels. Therefore, posttranscriptional control by Nocturnin regulates the amplitude of these critical metabolic pathways, and loss of this activity results in increased metabolic flux and reduced obesity.
In Brief
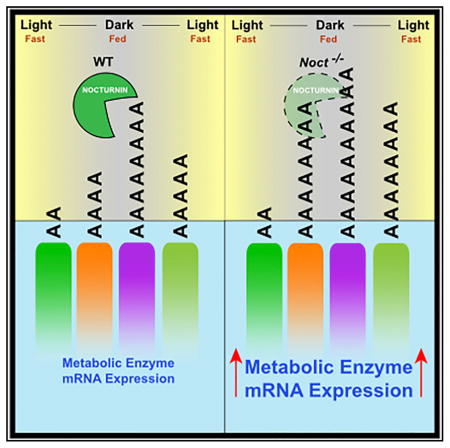
Stubblefield et al. find that Nocturnin is a key regulator of metabolic amplitude. Nocturnin expression depends on the circadian clock and nutrient status. In the absence of Nocturnin, mRNAs encoding lipid and cholesterol metabolic enzymes display increased amplitudes of expression, resulting in increased circulating metabolites.
INTRODUCTION
Endogenous circadian clocks allow organisms to anticipate cyclic changes in their environment, such as daily rhythms in food intake. This dynamic control efficiently regulates the daily switch from energy liberation during fasting to energy storage during feeding. Disruptions in circadian rhythms have many negative consequences on health, and reductions in clock amplitude have been discovered in aging, obesity, and other diseases (reviewed in Bass and Lazar, 2016). Pharmacological interventions and restricted feeding paradigms have demonstrated that modulating cycling amplitude can be beneficial for health and can combat the negative effects of obesity (Hatori et al., 2012; Chaix et al., 2014; Nohara et al., 2015; He et al., 2016). Although these studies have revealed that the amplitude of the core clock machinery is important for metabolic health, other mechanisms of amplitude control likely exist.
The circadian system is able to drive rhythms in cells of peripheral organs throughout the mammalian body. Genome-wide analyses estimate that 10%–30% of the hepatic transcriptome and 20% of the proteome are rhythmic (Panda et al., 2002; Storch et al., 2002; Reddy et al., 2006; Hughes et al., 2009; Koike et al., 2012; Le Martelot et al., 2012; Menet et al., 2012; Vollmers et al., 2012; Robles et al., 2014), though these rhythms can become dramatically altered through metabolic perturbation such as high fat diet (HFD) feeding and/or temporally restricted feeding (Damiola et al., 2000; Kohsaka et al., 2007; Vollmers et al., 2009). Although rhythmic transcription ultimately generates rhythms in the levels of many proteins, a significant fraction of rhythmic proteins are generated through posttranscriptional mechanisms (Kojima et al., 2012; Koike et al., 2012; Le Martelot et al., 2012; Menet et al., 2012; Robles et al., 2014). One form of reversible posttranscriptional modification is polyadenylation, and poly(A) tail length has been positively correlated with translational efficiency and/or transcript stability (Zhang et al., 2010; Weill et al., 2012). Circadian control of poly(A) tail length in mouse liver plays an important role in the generation of rhythms in protein levels that are independent of transcriptional rhythms (Kojima et al., 2012).
The liver is an important metabolic organ in which processes such as xenobiotic detoxification, glucose production, and lipid and cholesterol storage and processing occur. We have previously characterized the circadian profile of known deadenylases within the liver, and although most show little to no temporal rhythmicity, the protein Nocturnin (NOC), encoded by the gene Nocturnin (gene name Noct, formerly Ccrn4l) displays robust rhythmicity at both the mRNA and the protein levels (Green et al., 2007; Kojima et al., 2010, 2012; Niu et al., 2011). NOC is critical for proper lipid metabolism in mice (Green et al., 2007; Douris et al., 2011), and it has been implicated in osteogenesis, adipogenesis, and immune function (Kawai et al., 2010a, 2010b; Niu et al., 2011). Mice lacking Noct (Noct−/−, knockout [KO]) have normal core circadian mechanisms but are resistant to HFD-induced obesity and hepatic steatosis, indicating that NOC’s role in metabolism is downstream of the core clock machinery (Green et al., 2007). In the present study, we set out to examine the contribution of NOC function to rhythmic metabolism. Our study revealed that the Noct−/− mice have significantly enhanced amplitudes in cholesterol and triglyceride metabolic pathways, both over the daily circadian cycle and in response to acute nutritional challenges. Our findings provide insight into posttranscriptional mechanisms by which the circadian clock exerts control over the amplitude of energetic processes important for regulation of lipid and cholesterol metabolism.
RESULTS
Increased mRNA Amplitude in the Noct−/− Mouse Hepatic Transcriptome
To better understand the role NOC plays in circadian physiology, we examined global gene expression and various metabolic profiles over the 24 hr diurnal cycle in wild-type (WT) and Noct−/− (KO) mice (Figure 1A; Figure S1A). We harvested tissues and plasma and measured body and tissue weight at 3 hr intervals across the light:dark (LD) cycle from ad libitum (ad lib)-fed mice on a regular chow (RC) diet. Body weight did not differ with time and was similar between genotypes (Figure S1B), although liver weight (as a percentage of total body weight) was significantly increased in KO mice during the later portion of the dark phase and early portion of the light phase, while unchanged at other times (Figure S1C). Loss of Noct also had a significant effect on epididymal white adipose tissue (eWAT) weight, resulting in an overall reduced eWAT as a percentage of total body weight in KO mice (Figure S1D).
Figure 1. Loss of Nocturnin Does Not Alter Global Circadian Cycling in the Hepatic Transcriptome.

(A) Global circadian cycling of the hepatic transcriptome of WT and Noct−/− (KO) mice was determined by mRNA-seq analysis of liver samples (n = 2 mice/genotype/time point) collected at 3 hr intervals around the clock from ad lib-fed mice entrained to a 12:12 light:dark (LD) cycle. Samples from n = 4–5 mice/genotype/time point were collected for physiological analysis (Figure S1), and n = 2 mice/genotype/time point were randomly selected for mRNA-seq analysis.
(B) Metacycle was used to determine cycling transcripts (JTK and ARS, FDR [q value] < 0.15, 0.10, 0.05, or 0.01). From a total of n = 26,928 expressed transcripts, a similar percentage was cycling in the WT and KO livers at each cycling threshold (see also Table S1).
(C) Overlap of cycling transcripts was compared between WT and KO samples. Similar distributions of common and unique cycling transcripts were found at all thresholds except q < 0.01, where the WT has a larger percentage of cycling transcripts.
(D) Histograms of the distribution of the peak phase for transcripts cycling at the q < 0.05 threshold in each genotype. Mean peak phase was determined by circular rose plots (Figure S1G) and indicated by a red line and red text.
(E) mRNA-seq expression of several core clock genes is shown for WT and KO samples. The average of each biological replicate (n = 2/genotype/time point) ± range is graphed.
Gene expression profiling of the livers of WT and KO mice over the 24 hr diurnal cycle was done by mRNA sequencing (mRNA-seq) (Figure 1A). We analyzed the data both by considering the total transcripts (including transcript variants from the same gene) and by using only the single-longest transcript for each gene with similar results. Transcripts were filtered for transcript length and expression levels to determine expressed transcripts (for details on filtering, see Experimental Procedures). Expressed transcripts were analyzed for circadian cycling using Metacycle (Wu et al., 2016). We applied several levels of cycling stringency to examine robust versus weak cycling transcripts, as well as those assuming waveforms less conducive to the Metacycle curve-fitting algorithms. Across a range of false discovery rate (FDR, q value) cutoffs, the two genotypes had a similar proportion of transcripts that exhibited statistically significant diurnal rhythmicity, similar to previous reports that examined circadian gene expression in WT mice (Figure 1B). Predictively, more stringent q values reduced the number of cycling genes with both the ARSER (ARS) and the Jonckheere-Terpstra-Kendall (JTK) algorithms (Figures S1E and S1F; Table S1). However, although similar in number, only about half the cycling transcripts from each genotype were identified in both WT and KO livers (Figure 1C), and this ratio was maintained even when the cycling stringency was reduced. We chose a moderately stringent q value of 0.05 as a cutoff and assessed the global phasing of expressed transcripts. Both common and unique cycling transcript groups have similar peak phasing between the genotypes (Figure 1D; Figure S1H). The common cycling transcripts were enriched for genes associated with metabolic pathways and circadian rhythms (Figure S1G). The core clock genes display similar patterns of expression between WT and KO mice (Figure 1E).
Rhythm amplitude is thought to be positively correlated with improved physiological function. Therefore, we examined amplitude (relative amplitude [AMPRel], calculated as the ARS or JTK curve-fit amplitude divided by the mean expression for a given transcript across all time points) of expression for each cycling transcript using our q < 0.05 cycling threshold. This revealed that transcripts with peak expression during the dark phase (Zeitgeber time [ZT] 12–ZT24) had significantly increased amplitude compared to those peaking during the light phase (ZT0–ZT12) in both genotypes (Figure 2A). We observed a trend toward increased amplitude in the ZT12–ZT24 mRNAs in the KO mice when looking at all cycling transcripts and those cycling with moderate to high AMPRel (> 0.15), prompting us to examine the amplitude further. As we did with our cycling analysis, we included a range of cycling thresholds when assessing amplitude (Table S2). We found that, consistently, the cycling transcripts from the KO mice had a greater difference in amplitude between day (ZT0–ZT12) and night (ZT12–ZT24) peaking transcripts, mostly because of increased amplitude in the ZT12–ZT24 peaking group (Table S2). This increased amplitude in night-peaking transcripts for the KO mice occurred exclusively in the common cycling transcripts; the unique cycling group was similar between WT and KO samples (Table S2). We further assessed the distribution of amplitudes in the common cycling transcripts by examining amplitudes in categories of low amplitude (AMPRel < 0.15), moderate amplitude (0.15 < AMPRel < 0.85), and high amplitude (AMPRel > 0.85) (Table S3). The distributions across amplitude thresholds were not significantly different between WT and KO mice, even with decreasing the overall cycling threshold. KO mice do have a more pronounced increase in AMPRel in ZT12–ZT24 peaking transcripts compared to WT mice when using a low cycling threshold (q < 0.15) and looking exclusively at the moderate-high amplitude transcripts (Figure 2B). This difference results mainly from increased amplitude in transcripts peaking later in the dark phase between ZT18 and ZT21 (Figures 2C and 2D). These transcripts were enriched for transcripts associated with carbohydrate and glucose metabolism (Figure S2A).
Figure 2. Hepatic Transcript Amplitude Is Increased in Mice Lacking Nocturnin.

Cycling hepatic transcripts display amplitude increases in mice lacking NOC (Noct−/−, KO) during the dark phase.
(A) Relative amplitude (AMPRel) was determined for cycling transcripts (q < 0.05) by taking the ARS algorithm amplitude value and dividing it by the average expression (reads per kilobase of transcript per million mapped reads [RPKM]) value for a given transcript across all time points (Table S2). Transcripts were grouped by peak phase and grouped into day (ZT0–ZT12) and night (ZT12–ZT24) categories. The number of transcripts is indicated on each bar. Averages for transcripts were graphed according to all amplitudes (left) or those with AMPRel > 0.15.
(B) AMPRel was plotted as in (A), but with transcripts cycling with a q < 0.15 threshold.
(C and D) Cycling transcripts from (B) with AMPRel > 0.15 were subdivided into 3 hr peak phase windows. Transcripts were grouped into 3 hr bins ± 1.5 (e.g., Zeitgeber time (ZT) 3 transcripts had a peak phase ranging from ZT1.5 to ZT4.5) and presented according to genotype with WT (C) or KO (D).
Unless otherwise noted, bars represent the mean ± SEM and significance was determined using a Student’s t test.
We next assessed amplitude across all expressed genes, under the hypothesis that certain cycling waveforms may be undetectable by both the JTK and the ARS algorithms within Metacycle. Instead, we filtered transcripts that were not called rhythmic (with a q < 0.15 cutoff) by either JTK or ARS. If a transcript was called rhythmic (q < 0.15) by JTK and/or ARS in at least one genotype (WT or KO), then it was kept for amplitude analysis. We observed that when considering all AMPRels, WT and KO mice do not exhibit large changes across different circadian phases (Figures S2B and S2C). However, if we again look at just the moderate-high amplitude (AMPRel > 0.15) transcripts, differences in the KO emerge, with a notable increase at ZT18 (Figures S2D and S2E) that contains transcripts encoding many metabolic genes (Figure S2F).
We also considered amplitude as fold change across time points, regardless of being classified as cycling. By comparing the fold change of transcripts from WT and KO mice, we found a number of mRNAs with large increases in fold-change amplitude in the KO (Figure 3A). Gene ontology analysis revealed that the mRNAs with increased fold-change amplitude in the KO liver are significantly enriched for those involved in cholesterol and lipid metabolism (Figures S3A and S3B). These mRNAs encode proteins with key roles in the general metabolic flux pathway producing acetyl coenzyme A (CoA), cholesterol (CHOL), and triglyceride (TG) (Figure 3B). When these mRNAs were plotted for expression across the 24-hr day, we observed a striking pattern. Many mRNAs exhibited increased amplitude in the KO livers during the dark phase at ZT18 (Figures 3C–3E), the time of peak NOCprotein expression in WT mice (Kojima et al., 2010; Niu et al., 2011). These data suggest that loss of NOC protein increases the nighttime levels of mRNAs, with important roles throughout the CHOL and lipid metabolism pathways.
Figure 3. mRNAs Encoding Cholesterol and Lipid Synthesis Enzymes Display Increased Amplitude at ZT18 in the Noct−/− Mouse Liver.

(A) Transcript fold change was determined for each transcript by dividing the maximum expression value by the minimum expression value across time points. Genotype fold change for each transcript was then calculated by dividing the KO transcript fold change by the WT transcript fold change. A Z score was calculated for the genotype fold change and color-coded to highlight the transcripts with the highest amplitude increases in the KO (red) and the lowest amplitude decreases in the KO (blue).
(B) Pathway diagram depicting mRNAs and enzymes involved in the production of acetyl-CoA (green), cholesterol (purple), triglyceride (orange), and lipoproteins (turquoise). The names highlighted with red text had a Z score > 2, as identified in Figures 1I and 1J.
(C–E) mRNA-seq expression plots from WT and Noct−/− (KO) mice for select genes from the metabolic flux pathway in (B) are shown across the circadian cycle (n = 2/genotype/time point). Select genes are color-coded according to their terminal production of Acetyl CoA (green, C), cholesterol (purple, D), or triglycerides (orange, E).
Data points represent the mean ± range.
Loss of NOC Alters the Circadian Dynamics of Metabolic Flux
Metabolic flux occurs in mammals through cyclic ingestion of nutrients in the diet during times of feeding and fasting. These nutrients can be processed in tissues such as the liver to produce TG and CHOL (Figure 4A) through the pathways shown in Figure 3B. Because many mRNAs encoding enzymes along this pathway have dysregulated expression in the KO liver (Figure 3), we hypothesized that this would be reflected in altered TG or CHOL levels both within tissues and in the circulation. We assessed feeding using metabolic cages (TSE Systems Phenomaster) (Figures S4A–S4E). Consistent with previous findings (Green et al., 2007), RC-fed WT and KO mice have similar feeding and activity patterns across the circadian cycle, and although VO2 and VCO2 display small differences when comparing the light versus the dark phase, the respiratory exchange ratio (RER) is not altered between WT and KO mice on a RC diet (Figures S4A–S4E). We observed similar increases in both genotypes in stomach weight during the middle of the dark phase, corresponding to the increased feeding that occurs at light offset in nocturnal rodents (Figure 4B).
Figure 4. Tissue and Plasma Metabolites Display Altered Circadian Dynamics in Noct−/− Mice.

(A) Schematic depicting the metabolic flux, whereby the liver produces lipoproteins, triglycerides (TGs), and cholesterol (CHOL). CHOL metabolized to produce bile acids (BAs) in the liver, and the BAs are stored in the gallbladder. TGs, CHOL, and lipoproteins can also enter circulation from the diet as organisms feed.
(B) Stomach weight was recorded from animals across the circadian cycle.
(C–G) Lipid species were measured in the liver and plasma of mice. TG was measured in liver (C) and plasma (D). VLDLs (very low-density lipoproteins) (E) and dHDL (high-density lipoprotein, derived) (F) were measured from plasma. NEFA (non-esterified fatty acid) was measured from plasma (G).
(H and I) CHOL levels were quantified from liver tissue (H) and plasma (I).
(J) Gallbladder volume was determined at the indicated circadian time points.
All data points represent the mean ± SEM and come from n = 3–5 mice/genotype/time point.
Measurement of hepatic TG content revealed diurnal oscillations in both genotypes, and the pattern of TG levels in the liver did not differ between WT and KO (Figure 4C). However, there was a significant increase in the levels of TG in the plasma of KO mice at ZT18 (Figure 4D), corresponding to the timing of peak amplitude in mRNAs encoding lipid synthesis enzymes in KO animals, which likely extends the peak of TG in the circulation beyond that observed in the WT mice. TGs are packaged into lipoproteins for passage throughout the circulation, and we found that plasma very low-density lipoprotein (VLDL), but not derived high-density lipoprotein (dHDL), is significantly increased in the night at ZT18 in KO mice (Figures 4E and 4F). Lipid within the circulation also consists of non-esterified fatty acid (NEFA) mainly stored and liberated by the adipose tissue. Levels of plasma NEFA oscillate in both genotypes, but KO mice exhibit lower NEFA levels through the daytime (Figure 4G).
Hepatic CHOL also oscillates in both WT and KO mice, but the amplitude in the KO livers is higher (~2-fold), with lower levels in the late night or early day, followed by an increase over WT levels in late day (Figure 4H). Despite this modest increase in amplitude, overall levels of CHOL within the liver and circulation were similar between genotypes (Figures 4H and 4I), even though there are significant increases in expression of mRNAs encoding enzymes for CHOL production in the KO liver (Figure 3D). However, CHOL is a key component in bile acid metabolism through conversion into bile acids in the liver and storage in the gallbladder for release upon nutrient ingestion (Russell, 2003). Measurement of gallbladder volume revealed significantly increased volumes in the KO mice throughout the light phase (Figure 4J), suggesting that excess CHOL production is being used for bile synthesis.
Our results show that many mRNAs encoding TG- and CHOL-synthesizing enzymes have dysregulated expression across the circadian cycle in KO mice, with consistent increases over WT levels during the dark phase (Figure 3), which are reflected in altered dynamics of TGs and CHOL metabolite levels (Figure 4). Given the deadenylase function of NOC, we hypothesized that the poly(A) tail length of the previously identified mRNAs might be altered in KO mice. To address this, we examined the poly(A) tail length of candidate mRNAs from WT and KO mice at ZT18, when the amplitude of expression for these mRNAs is at its peak. Although the poly(A) tail length of the mRNAs we examined encoding acetyl-CoA synthesis enzymes was similar between WT and KO, the distributions of tail lengths of some mRNAs encoding CHOL synthesis enzymes were shifted toward longer poly(A) tail lengths (e.g., Pmvk and Fdps) (Figures S5A and S5B), suggesting that these mRNAs may be direct targets of NOC.
NOC Responds to and Helps Regulate the Temporal Response to Feeding Status
Because metabolic flux is linked to both circadian cycle and feeding status, we explored the effect of different nutritional challenges on Noct expression. Consistent with previous reports (Green et al., 2007; Kojima et al., 2010; Gilbert et al., 2011; Niu et al., 2011), Noct mRNA displays strong circadian rhythmicity in the liver, with peak expression across the LD transition at ZT12 in WT mice fed ad lib on a RC diet (Figure 5A). We challenged WT mice with a fast/refed paradigm (Figure 5B) and found that a 10 hr fast blunted the circadian rise in Noct expression at ZT10 (Figure 5C). Mice that were fasted for 10 hr and then refed for 1 hr showed a significant increase in Noct expression (Figure 5C). When fed a HFD for 3 weeks, Noct rhythmicity is maintained in the WT liver, but it begins to rise earlier in the light phase and its peak expression is significantly elevated at ZT12 compared to RC-fed mice (Figure 5D). We also challenged HFD-fed mice with a fast/refed paradigm (Figure 5E) and found that a 10 hr fast again caused Noct levels to be blunted, even when the fast occurred at a different circadian phase. Noct expression was significantly increased after a 4 hr refeeding compared to its expression after a 10 hr fast (Figure 5F).
Figure 5. Feeding Condition Alters Nocturnin mRNA Expression.

(A) Nocturnin (Noct) hepatic mRNA expression was determined by qPCR across the LD cycle in the ad lib-fed state of WT mice on regular chow (RC) (n = 3–4 mice/time point).
(B) Schematic depicting the nutritional challenges administered to WT mice. Mice (n = 4–6) had livers harvested in the ad lib-fed state at either ZT0 or ZT10, the 10 hr fasted state (fast) (food removed at ZT0), and the 1 hr refed state at ZT11 (food removed at ZT0 and returned at ZT10 for 1 hr).
(C) Quantification of Noct hepatic mRNA by qPCR in each of the feeding conditions depicted in (B).
(D) Mice were also challenged with 3 weeks ad lib high fat diet (HFD) feeding (Research Diets, D12492i). Hepatic Noct mRNA was quantified from HFD-fed WT mice at the indicated time points (n = 4 mice/time point) and normalized to Gapdh expression. Noct expression from RC-fed WT mice is replotted from (A) as a dashed green line.
(E) Schematic depicting the nutritional challenges administered to HFD-fed WT mice.
(F) Liver tissue was collected from mice in the ad lib-fed state at ZT22, the 10 hr fast (fast) state at ZT22 (food removed at ZT12), the 1 hr refed state at ZT23 (food removed at ZT12 and returned at ZT22 for 1 hr), and the 4 hr refed state at ZT2 (food removed at ZT12 and returned at ZT22 for 4 hr).
Data points represent mean ± SEM. For (D), ***p < 0.001, two-way ANOVA with multiple comparisons. For (C) and (F), different letters represent p < 0.05 from a one-way ANOVA with multiple comparisons. Identical letters represent mean values that are not statistically different.
The responsiveness of Noct to both diet (HFD) and feeding status (fast/refed) and the loss of amplitude control at the mRNA and metabolite level for TG and CHOL synthesis in KO mice prompted us to examine NOC’s ability to regulate nutrient levels following acute fasting and refeeding on a HFD background (Figure 6A). Similar to the changes seen across the circadian cycle, KO mice have significantly increased gallbladder volumes when refed following a fast (Figure 6B), while plasma CHOL did not differ between genotypes (Figure 6C). Plasma TG, NEFA, and VLDL were all increased in the KOs in the refed state (Figures 6D–6F); plasma LDL was significantly reduced in the KO mice; and there was no change in dHDL (Figures 6G and 6H).
Figure 6. Altered Gallbladder Volume and Lipid Levels in Noct−/− Mice following Fasting and Refeeding.

(A) Schematic depicting the nutritional challenges administered to WT and Noct−/− (KO) mice. WT and KO mice (n = 3–5) were exposed to a HFD (Research Diets, D12492i) for 3 weeks and then fasted for 10 hr (fast, food removed at ZT0) or fasted for 10 hr and then refed for 1 hr (refed, food removed at ZT0 and returned at ZT10 for 1 hr).
(B) Gallbladder volume was measured from WT and KO mice.
(C–H) Plasma was harvested from WT and KO mice in the fast and refed states, and levels of CHOL (C), non-esterified fatty acid (NEFA) (D), TG (E), very low-density lipoprotein (VLDL) (F), low-density lipoprotein (LDL) (G), and derived high-density lipoprotein (dHDL) (H) were quantified.
(I) Schematic diagram depicting the paradigm for metabolic cages. WT and KO mice (n = 12/genotype) were placed in metabolic cages (TSE Systems Phenomaster) and were fed a RC diet for 1.5 days. Just before lights off on day 2, the diet was switched to HFD (Research Diets, D12492i) for the remaining 3 days of recording.
(J) Respiratory exchange ratio (RER) from the metabolic cages is shown for the HFD exposure days. Letters indicate Student’s t test significance values, with similar letters not statistically significant and different letters indicating statistical significance of p < 0.05.
All other data points represent mean ± SEM. *p < 0.05, **p < 0.01, ****p < 0.0001, Student’s t test.
Given the significant disruption in lipid metabolites across the circadian cycle and in response to nutrient challenge in the KO, we examined NOC’s role in whole-body metabolism in response to a metabolic challenge. We used metabolic cages to probe the response in WT and KO mice to an acute shift in diet from RC to HFD (Figure 6I). Metabolic parameters are similar between WT and KO mice under RC diet and in the first night following the switch to HFD (Figures S4A–S4J). However, there are several notable differences in the KO mice in the first 3 days of HFD exposure. Comparing the light versus the dark phase values of VO2 and VCO2 reveals a significant increase in these parameters in the KO mice (Figures S4K and S4L). These values can be a reflection of activity or energy substrate utilization; however, the activity and food intake of WT and KO mice are similar during this period (Figures S4N and S4O). The RER is an indicator of carbohydrate versus lipid utilization, and it is significantly decreased in the light phase in KO mice (Figure 6J; Figure S4M), indicating a preference in lipid utilization in the KO mice.
Because KO mice display similar disruptions in lipid regulation both throughout the circadian cycle and in response to nutrient challenge, we hypothesized that a molecular disruption at the level of mRNA amplitude or poly(A) tail length in the KO mice might contribute to these phenotypes. The metabolic demand during a nutrient challenge such as fasting necessitates downregulation of certain transcripts, and subsequent refeeding would lead to their upregulation (Figure 7A). Noct mRNA follows this same pattern of downregulation with a fast and upregulation with refeeding. We therefore hypothesized that potential targets of NOC could be identified by examining the hepatic transcriptome during such a nutrient challenge (Figure 7B). We performed mRNA-seq on liver samples from HFD-fed WT and KO mice in the fed, fast, and refed states (Figure 7C). For our analysis, we considered mRNAs that exhibited similar amplitude dynamics in which their expression was downregulated following a fast and upregulated with refeeding (down-up). The mRNAs that are downregulated by a fast exhibit globally smaller fold changes in the KO, followed by a significantly increased response upon refeeding (Figure 7D), thereby displaying dynamics with increased amplitudes. The mRNAs within these categories are many of the same genes identified in our previous circadian mRNA-seq analysis, encoding enzymes necessary for the production of acetyl-CoA, CHOL, and lipid (Figures 7E–7G). These mRNAs have significantly increased expression in the fed state at ZT22 in KO mice, and refeeding following a fast causes these mRNAs to return to elevated levels over WT controls, thus giving them an absolute amplitude increase. We also performed poly(A) tail length analysis on mRNAs from these HFD-fed mice in the fed state at ZT22 and found that the mRNAs with increased expression in the fed state also have a shift in the cumulative distribution of poly(A) tail lengths of their mRNAs toward longer-tailed forms in the KO mice (Figures 7H–7J). The mRNAs identified here could be potential targets of NOC, because their expression levels are altered in the circadian cycle and acutely in response to fasting and refeeding. The significant increase in poly(A) tail length for these mRNAs in KO mice on a HFD background suggests that they are targets of NOC. Because Noct mRNA is upregulated with HFD feeding, NOC’s deadenylation activity may be more important or pronounced in these situations of nutrient excess.
Figure 7. Disrupted mRNA Amplitude and poly(A) Tail Length in Noct−/− Mice under Different Feeding Conditions.

(A and B) Model of NOC’s regulation of metabolic amplitude in WT mice (A) and the physiological consequence of loss of Nocturnin in the KO (B).
(C) Schematic of the feeding conditions for mRNA-seq analysis. WT and Noct−/− (KO) mice were fed a HFD for 3 weeks, and then liver tissue was harvested in each of 3 nutritionally challenged states (n = 3 mice/genotype/condition). Livers were harvested from mice in the ad lib-fed state at ZT22, the fast state at ZT22 (10 hr fast, food removed at ZT12), or the refed state at ZT2 (10 hr fast, food removed at ZT12 and replaced at ZT22 for 4 hr).
(D) mRNA-seq results were categorized into groups by their response to the feeding condition. mRNAs downregulated with fasting and upregulated with refeeding were grouped as “down-up.” mRNAs within each category were given an amplitude response value to the feeding condition by comparing the mean RPKM in the fed versus fast conditions and fast versus refed conditions and the amplitude expressed as fold change.
(E–G) RPKM values for both WT and KO genotypes are graphed for genes associated with acetyl-CoA production (Acly) (E), CHOL (Fdps) (F), and TG (Gpam) (G) synthesis.
(H–J) poly(A) tail lengths at ZT22 in the fed state were measured (n = 1/genotype), and the cumulative distribution percentage was graphed for each genotype of the select genes associated with acetyl CoA production (Acly) (H), CHOL (Fdps) (I), and TG (Gpam) (J) synthesis. The inset is a box-and-whisker plot of the median poly(A) tail length ± range, and statistics performed were Mann-Whitney U tests with *p < 0.05 and **p < 0.01.
Unless otherwise specified, bars with error bars represent the mean ± SEM, statistics were obtained with a Student’s t test, and *p < 0.05, **p < 0.01, and ****p < 0.0001.
DISCUSSION
Daily rhythms in gene expression are important for metabolic homeostasis, and alterations to these rhythms can have profound consequences on the health of the organism. In humans, circadian misalignment causes loss of sleep quality and disruptions in glucose metabolism, hormone balance, and cardiac function (Scheer et al., 2009; Morris et al., 2015). Animal models display similar dysfunction when genetic mutations or feeding challenges cause alterations in clock function or cause central and peripheral oscillators to lose coordination (Damiola et al., 2000; Stokkan et al., 2001; Rudic et al., 2004; Turek et al., 2005; Vollmers et al., 2009; Marcheva et al., 2010; Hatori et al., 2012; Chaix et al., 2014). The amplitude of the rhythms is also critically important, and the amplitudes of both the core clock and its outputs strongly correlate with metabolic health (Kohsaka et al., 2007; Hatori et al., 2012; Chaix et al., 2014; He et al., 2016; Zhao et al., 2016). The data presented here show that loss of NOC results in increased amplitudes of genes involved in CHOL and TG metabolism and resulting metabolites, and this raises the question of whether this increased amplitude plays a role in protecting these animals from metabolic problems such as obesity and hepatic steatosis.
NOC is unique among the known deadenylases in that it is regulated rhythmically by the clock and responds acutely to many stimuli as an immediate early gene; other deadenylases display weak or no circadian rhythmicity at the mRNA level in the mouse liver and are not known to be inducible (Garbarino-Pico et al., 2007; Kojima et al., 2012). Noct hepatic mRNA exhibits high-amplitude rhythmicity in the ad lib-fed state, and its expression depends on both circadian clock machinery and metabolic cycles. Here we demonstrate that Noct mRNA rhythmicity and amplitude can be altered by chronic HFD and acutely in response to fasting and refeeding (Figure 5). We examined the hepatic transcriptome in WT and KO mice, and in the KO, the mRNAs with increased amplitude within the dark phase encode proteins mediating flux through lipid and CHOL pathways. This results in increased circulating TG at night and increased gallbladder volume during the early part of the day. This nighttime temporal window coincides with the normal time of peak NOC protein levels in WT mice and suggests that NOC’s normal function is to promote decay of mRNAs within these pathways during the night. Similarly, the increased expression of these mRNAs during the fasting and refeeding paradigm correlates with the conditions under which NOC is normally induced in WT mice. In some cases (Acly, Fdps, and Gpam), these mRNAs may be direct targets of NOC’s deadenylase activity, because the distributions of their poly(A) tail lengths shift to longer tails in the KO livers. In other cases (Acss2, Hmgcs1, and Acaca), the tail length distributions do not change significantly, indicating that NOC’s control of these mRNAs may be indirect. Many of these mRNAs are targets of the transcription factors PPARα and SREBP2. We examined both the circadian profile of the mRNAs encoding these proteins and their poly(A) tail length distributions at ZT18 and found no difference between WT and KO mice (data not shown).
NOC’s responsiveness to time of day and to nutritional challenges suggests that it is important during perturbations related to energy status or need. Our studies with KO mice in metabolic cages following the transition from a RC to HFD revealed that KO mice have a small but significant preference for lipid utilization as an energy substrate and significantly higher VO2 and VCO2 values (Figure S4). This, in addition to our previous report that KO mice have altered transit of lipid across intestinal enterocytes (Douris et al., 2011), could contribute to the protection from diet-induced obesity exhibited by KO mice.
We were surprised that the CHOL levels in KO mice did not show overt changes both within the liver and in plasma, because most mRNAs encoding CHOL synthesis enzymes were upregulated in the KO mice (Figure 3). Hepatic CHOL levels in the KO mice oscillate with a similar phase as WT mice, but the amplitude is increased (~2-fold), with decreased CHOL levels early in the light phase followed by an increase over WT levels just before the LD transition (Figure 4D). This change in amplitude is consistent with our finding that KO mice have increased gallbladder volumes throughout the light phase (Figure 4J). CHOL is the substrate for bile acid (BA) production and BAs are stored in the gallbladder until release into the proximal small intestine upon nutrient ingestion (reviewed in Russell, 2003). The increased gallbladder volume throughout the light phase could be a metabolic compensation for the increased amplitude of expression of mRNAs encoding CHOL synthesis enzymes in the late portion of the dark phase in KO mice or could be due to dysregulated feedback signaling in the hepatobiliary system. This feedback is mediated primarily through Fgf15 mRNA induction in the distal small intestine (ileum) by released BAs and FGF15 protein signaling back to the liver to shut down BA synthesis through hepatic activation of FXR and SHP protein expression (for review, see Russell, 2009). It is unlikely that feedback is disrupted in the KO mice, because Fgf15 mRNA in the ileum and Fxr and Shp mRNA in the liver do not differ between genotypes (data not shown).
The data presented here are consistent with a model whereby NOC regulates metabolic amplitude at the level of mRNA expression, resulting in an increase in amplitude of metabolite abundance. We identified a temporal window throughout the dark portion of the circadian phase, during which mice lose the ability to downregulate levels of mRNAs encoding metabolic enzymes and circulating lipid levels in the absence of NOC, resulting in higher peak expression. We have further demonstrated that NOC is critical in the acute metabolic response to refeeding following a fast by helping maintain proper levels of lipid species and gallbladder volume. In both cases, the KO mice exhibit higher-amplitude responses to feeding challenges, identifying it as a metabolic amplitude regulator both within the dark phase of the circadian cycle and in response to nutrient challenges (Figures 7A and 7B). Increased mRNA and metabolite amplitudes have been associated with improved metabolic health (Chaix et al., 2014; He et al., 2016), and many mRNAs with enhanced amplitude in the KO mice have been reported to have reduced amplitude (e.g., Acly, Fdps, and Gpam) in a model of jetlag and hepatocarcinogenesis (Kettner et al., 2016). Although in the laboratory setting lack of NOC confers a health advantage (increased metabolic amplitude and resistance to diet-induced obesity), the effects of NOC loss in the wild when food may be limiting would be interesting to assess. Our work highlights the importance of metabolic regulation by the circadian system and deepens our understanding of the mechanisms controlling metabolic amplitude. With this knowledge, modulating levels or activity of NOC could assist in treating conditions such as jetlag, cancer, or obesity in which proper regulation of metabolite levels is lost.
EXPERIMENTAL PROCEDURES
Contact for Reagent and Resource Sharing
Further information and requests for resources and reagents should be directed to and will be fulfilled by the lead contact.
Experimental Model and Subject Details
Animal Studies
WT and Noct−/− (KO) male C57BL/6 (congenic, N > 9) mice were individually housed in light-tight environmental chambers under green light emitting diode (LED) lighting on a 12:12 LD cycle, with ZT0 defined as the time of lights on and ZT12 defined as the time of lights off. Specific time of lights on and lights off was variable, depending on the experiment, but all LD cycles maintained the LD 12:12 ratio, and animals were allowed a minimum of 2 weeks to entrain to the specific LD cycle once placed in the environmental chambers. Animals on RC were fed Harlan Teklad diet 2918. Animals receiving HFD were fed Research Diets D12492i (60% kcal fat). HFD-fed mice were allowed to feed ad lib for 3 weeks beginning from 6 to 8 weeks of age. Animals were 9–12 weeks of age at the time of tissue collection. WT and KO mice used for RC mRNA-seq were littermates and randomly assigned to time points for collection. WT mice used for HFD mRNA-seq were bought from the breeding core at UT Southwestern Medical Center, and KO mice were from a KO-specific breeding strain maintained by our laboratory. Mice were sacrificed via decapitation for terminal blood collection followed by tissue harvest. Tissues were flash-frozen in liquid nitrogen and stored at −80°C for downstream analysis. Mice sacrificed at times corresponding to lights off were sacrificed under dim red light. All animal studies were conducted in accordance with Institutional Care and Use Committee (IACUC) regulations and guidelines.
Quantification and Statistical Analysis
Unless otherwise specified, statistical significance was determined using GraphPad Prism software. Statistical tests varied according to the experiment, but p < 0.05 was generally used for significance. Specific statistical tests are referred to in the figure legends, along with the specific level of significance achieved. Circadian rhythmicity was determined using the Metacycle package within R statistical computing software (Wu et al., 2016). Significant circadian cycling was determined over a range of FDR (q) values (q < 0.01, q < 0.05, q < 0.10, and q < 0.15) for both JTK and ARS. Where applicable, n refers to the number of biological replicates represented by different mice.
Further details and an outline of resources used in this work can be found in Supplemental Experimental Procedures.
DATA AND SOFTWARE AVAILABILITY
The accession number for the mRNA-seq datasets reported in this paper is GEO: GSE105413.
Supplementary Material
Highlights.
Hepatic mRNAs encoding key metabolic enzymes have increased amplitude in Noct−/− mice
Hepatic Nocturnin mRNA expression is responsive to nutrient status
Lipid and cholesterol levels are increased after a meal in Noct−/− mice
mRNAs with increased amplitude in Noct−/− mice have lengthened poly(A) tails
Acknowledgments
We thank all members of the Green lab for helpful discussions on experimental design and data interpretation and give special thanks to Qingyan Wu, Cameron Ford, and Katharina Sewart for assistance with animal husbandry. This work was supported by NIH grants R01AG045795, R01GM111387, and R01GM112991 (to C.B.G.).
Footnotes
Supplemental Information includes Supplemental Experimental Procedures, five figures, and three tables and can be found with this article online at https://doi.org/10.1016/j.celrep.2018.01.011.
AUTHOR CONTRIBUTIONS
J.J.S. designed and executed all experiments described here, as well as conducting data analysis and writing the manuscript. P.G. performed TAIL-seq analysis. G.K. conducted bioinformatics analysis of mRNA-seq data (mapping and differential expression analysis), as well as executing the poly(A) barrier analysis. B.M. quantified gallbladder volumes. J.T. assisted with metabolic cage experiments and data analysis. C.B.G. assisted in experimental design and in writing the manuscript.
DECLARATION OF INTERESTS
The authors declare no competing interests.
References
- Bass J, Lazar MA. Circadian time signatures of fitness and disease. Science. 2016;354:994–999. doi: 10.1126/science.aah4965. [DOI] [PubMed] [Google Scholar]
- Chaix A, Zarrinpar A, Miu P, Panda S. Time-restricted feeding is a preventative and therapeutic intervention against diverse nutritional challenges. Cell Metab. 2014;20:991–1005. doi: 10.1016/j.cmet.2014.11.001. [DOI] [PMC free article] [PubMed] [Google Scholar]
- Damiola F, Le Minh N, Preitner N, Kornmann B, Fleury-Olela F, Schibler U. Restricted feeding uncouples circadian oscillators in peripheral tissues from the central pacemaker in the suprachiasmatic nucleus. Genes Dev. 2000;14:2950–2961. doi: 10.1101/gad.183500. [DOI] [PMC free article] [PubMed] [Google Scholar]
- Douris N, Kojima S, Pan X, Lerch-Gaggl AF, Duong SQ, Hussain MM, Green CB. Nocturnin regulates circadian trafficking of dietary lipid in intestinal enterocytes. Curr Biol. 2011;21:1347–1355. doi: 10.1016/j.cub.2011.07.018. [DOI] [PMC free article] [PubMed] [Google Scholar]
- Garbarino-Pico E, Niu S, Rollag MD, Strayer CA, Besharse JC, Green CB. Immediate early response of the circadian polyA ribonuclease nocturnin to two extracellular stimuli. RNA. 2007;13:745–755. doi: 10.1261/rna.286507. [DOI] [PMC free article] [PubMed] [Google Scholar]
- Gilbert MR, Douris N, Tongjai S, Green CB. Nocturnin expression is induced by fasting in the white adipose tissue of restricted fed mice. PLoS ONE. 2011;6:e17051. doi: 10.1371/journal.pone.0017051. [DOI] [PMC free article] [PubMed] [Google Scholar]
- Green CB, Douris N, Kojima S, Strayer CA, Fogerty J, Lourim D, Keller SR, Besharse JC. Loss of Nocturnin, a circadian deadenylase, confers resistance to hepatic steatosis and diet-induced obesity. Proc Natl Acad Sci USA. 2007;104:9888–9893. doi: 10.1073/pnas.0702448104. [DOI] [PMC free article] [PubMed] [Google Scholar]
- Hatori M, Vollmers C, Zarrinpar A, DiTacchio L, Bushong EA, Gill S, Leblanc M, Chaix A, Joens M, Fitzpatrick JA, et al. Time-restricted feeding without reducing caloric intake prevents metabolic diseases in mice fed a high-fat diet. Cell Metab. 2012;15:848–860. doi: 10.1016/j.cmet.2012.04.019. [DOI] [PMC free article] [PubMed] [Google Scholar]
- He B, Nohara K, Park N, Park YS, Guillory B, Zhao Z, Garcia JM, Koike N, Lee CC, Takahashi JS, et al. The small molecule nobiletin targets the molecular oscillator to enhance circadian rhythms and protect against metabolic syndrome. Cell Metab. 2016;23:610–621. doi: 10.1016/j.cmet.2016.03.007. [DOI] [PMC free article] [PubMed] [Google Scholar]
- Hughes ME, DiTacchio L, Hayes KR, Vollmers C, Pulivarthy S, Baggs JE, Panda S, Hogenesch JB. Harmonics of circadian gene transcription in mammals. PLoS Genet. 2009;5:e1000442. doi: 10.1371/journal.pgen.1000442. [DOI] [PMC free article] [PubMed] [Google Scholar]
- Kawai M, Delany AM, Green CB, Adamo ML, Rosen CJ. Nocturnin suppresses igf1 expression in bone by targeting the 3′ untranslated region of igf1 mRNA. Endocrinology. 2010a;151:4861–4870. doi: 10.1210/en.2010-0407. [DOI] [PMC free article] [PubMed] [Google Scholar]
- Kawai M, Green CB, Lecka-Czernik B, Douris N, Gilbert MR, Kojima S, Ackert-Bicknell C, Garg N, Horowitz MC, Adamo ML, et al. A circadian-regulated gene, Nocturnin, promotes adipogenesis by stimulating PPAR-gamma nuclear translocation. Proc Natl Acad Sci USA. 2010b;107:10508–10513. doi: 10.1073/pnas.1000788107. [DOI] [PMC free article] [PubMed] [Google Scholar]
- Kettner NM, Voicu H, Finegold MJ, Coarfa C, Sreekumar A, Putluri N, Katchy CA, Lee C, Moore DD, Fu L. Circadian homeostasis of liver metabolism suppresses hepatocarcinogenesis. Cancer Cell. 2016;30:909–924. doi: 10.1016/j.ccell.2016.10.007. [DOI] [PMC free article] [PubMed] [Google Scholar]
- Kohsaka A, Laposky AD, Ramsey KM, Estrada C, Joshu C, Kobayashi Y, Turek FW, Bass J. High-fat diet disrupts behavioral and molecular circadian rhythms in mice. Cell Metab. 2007;6:414–421. doi: 10.1016/j.cmet.2007.09.006. [DOI] [PubMed] [Google Scholar]
- Koike N, Yoo SH, Huang HC, Kumar V, Lee C, Kim TK, Takahashi JS. Transcriptional architecture and chromatin landscape of the core circadian clock in mammals. Science. 2012;338:349–354. doi: 10.1126/science.1226339. [DOI] [PMC free article] [PubMed] [Google Scholar]
- Kojima S, Gatfield D, Esau CC, Green CB. MicroRNA-122 modulates the rhythmic expression profile of the circadian deadenylase Nocturnin in mouse liver. PLoS ONE. 2010;5:e11264. doi: 10.1371/journal.pone.0011264. [DOI] [PMC free article] [PubMed] [Google Scholar]
- Kojima S, Sher-Chen EL, Green CB. Circadian control of mRNA polyadenylation dynamics regulates rhythmic protein expression. Genes Dev. 2012;26:2724–2736. doi: 10.1101/gad.208306.112. [DOI] [PMC free article] [PubMed] [Google Scholar]
- Le Martelot G, Canella D, Symul L, Migliavacca E, Gilardi F, Liechti R, Martin O, Harshman K, Delorenzi M, Desvergne B, et al. CycliX Consortium. Genome-wide RNA polymerase II profiles and RNA accumulation reveal kinetics of transcription and associated epigenetic changes during diurnal cycles. PLoS Biol. 2012;10:e1001442. doi: 10.1371/journal.pbio.1001442. [DOI] [PMC free article] [PubMed] [Google Scholar]
- Marcheva B, Ramsey KM, Buhr ED, Kobayashi Y, Su H, Ko CH, Ivanova G, Omura C, Mo S, Vitaterna MH, et al. Disruption of the clock components CLOCK and BMAL1 leads to hypoinsulinaemia and diabetes. Nature. 2010;466:627–631. doi: 10.1038/nature09253. [DOI] [PMC free article] [PubMed] [Google Scholar]
- Menet JS, Rodriguez J, Abruzzi KC, Rosbash M. Nascent-seq reveals novel features of mouse circadian transcriptional regulation. eLife. 2012;1:e00011. doi: 10.7554/eLife.00011. [DOI] [PMC free article] [PubMed] [Google Scholar]
- Morris CJ, Yang JN, Garcia JI, Myers S, Bozzi I, Wang W, Buxton OM, Shea SA, Scheer FA. Endogenous circadian system and circadian misalignment impact glucose tolerance via separate mechanisms in humans. Proc Natl Acad Sci USA. 2015;112:E2225–E2234. doi: 10.1073/pnas.1418955112. [DOI] [PMC free article] [PubMed] [Google Scholar]
- Niu S, Shingle DL, Garbarino-Pico E, Kojima S, Gilbert M, Green CB. The circadian deadenylase Nocturnin is necessary for stabilization of the iNOS mRNA in mice. PLoS ONE. 2011;6:e26954. doi: 10.1371/journal.pone.0026954. [DOI] [PMC free article] [PubMed] [Google Scholar]
- Nohara K, Yoo SH, Chen ZJ. Manipulating the circadian and sleep cycles to protect against metabolic disease. Front Endocrinol (Lausanne) 2015;6:35. doi: 10.3389/fendo.2015.00035. [DOI] [PMC free article] [PubMed] [Google Scholar]
- Panda S, Antoch MP, Miller BH, Su AI, Schook AB, Straume M, Schultz PG, Kay SA, Takahashi JS, Hogenesch JB. Coordinated transcription of key pathways in the mouse by the circadian clock. Cell. 2002;109:307–320. doi: 10.1016/s0092-8674(02)00722-5. [DOI] [PubMed] [Google Scholar]
- Reddy AB, Karp NA, Maywood ES, Sage EA, Deery M, O’Neill JS, Wong GK, Chesham J, Odell M, Lilley KS, et al. Circadian orchestration of the hepatic proteome. Curr Biol. 2006;16:1107–1115. doi: 10.1016/j.cub.2006.04.026. [DOI] [PubMed] [Google Scholar]
- Robles MS, Cox J, Mann M. In-vivo quantitative proteomics reveals a key contribution of post-transcriptional mechanisms to the circadian regulation of liver metabolism. PLoS Genet. 2014;10:e1004047. doi: 10.1371/journal.pgen.1004047. [DOI] [PMC free article] [PubMed] [Google Scholar]
- Rudic RD, McNamara P, Curtis AM, Boston RC, Panda S, Hogenesch JB, Fitzgerald GA. BMAL1 and CLOCK, two essential components of the circadian clock, are involved in glucose homeostasis. PLoS Biol. 2004;2:e377. doi: 10.1371/journal.pbio.0020377. [DOI] [PMC free article] [PubMed] [Google Scholar]
- Russell DW. The enzymes, regulation, and genetics of bile acid synthesis. Annu Rev Biochem. 2003;72:137–174. doi: 10.1146/annurev.biochem.72.121801.161712. [DOI] [PubMed] [Google Scholar]
- Russell DW. Fifty years of advances in bile acid synthesis and metabolism. J Lipid Res. 2009;50(Suppl):S120–S125. doi: 10.1194/jlr.R800026-JLR200. [DOI] [PMC free article] [PubMed] [Google Scholar]
- Scheer FA, Hilton MF, Mantzoros CS, Shea SA. Adverse metabolic and cardiovascular consequences of circadian misalignment. Proc Natl Acad Sci USA. 2009;106:4453–4458. doi: 10.1073/pnas.0808180106. [DOI] [PMC free article] [PubMed] [Google Scholar]
- Stokkan KA, Yamazaki S, Tei H, Sakaki Y, Menaker M. Entrainment of the circadian clock in the liver by feeding. Science. 2001;291:490–493. doi: 10.1126/science.291.5503.490. [DOI] [PubMed] [Google Scholar]
- Storch KF, Lipan O, Leykin I, Viswanathan N, Davis FC, Wong WH, Weitz CJ. Extensive and divergent circadian gene expression in liver and heart. Nature. 2002;417:78–83. doi: 10.1038/nature744. [DOI] [PubMed] [Google Scholar]
- Turek FW, Joshu C, Kohsaka A, Lin E, Ivanova G, McDearmon E, Laposky A, Losee-Olson S, Easton A, Jensen DR, et al. Obesity and metabolic syndrome in circadian Clock mutant mice. Science. 2005;308:1043–1045. doi: 10.1126/science.1108750. [DOI] [PMC free article] [PubMed] [Google Scholar]
- Vollmers C, Gill S, DiTacchio L, Pulivarthy SR, Le HD, Panda S. Time of feeding and the intrinsic circadian clock drive rhythms in hepatic gene expression. Proc Natl Acad Sci USA. 2009;106:21453–21458. doi: 10.1073/pnas.0909591106. [DOI] [PMC free article] [PubMed] [Google Scholar]
- Vollmers C, Schmitz RJ, Nathanson J, Yeo G, Ecker JR, Panda S. Circadian oscillations of protein-coding and regulatory RNAs in a highly dynamic mammalian liver epigenome. Cell Metab. 2012;16:833–845. doi: 10.1016/j.cmet.2012.11.004. [DOI] [PMC free article] [PubMed] [Google Scholar]
- Weill L, Belloc E, Bava FA, Méndez R. Translational control by changes in poly(A) tail length: recycling mRNAs. Nat Struct Mol Biol. 2012;19:577–585. doi: 10.1038/nsmb.2311. [DOI] [PubMed] [Google Scholar]
- Wu G, Anafi RC, Hughes ME, Kornacker K, Hogenesch JB. MetaCycle: an integrated R package to evaluate periodicity in large scale data. Bioinformatics. 2016;32:3351–3353. doi: 10.1093/bioinformatics/btw405. [DOI] [PMC free article] [PubMed] [Google Scholar]
- Zhang X, Virtanen A, Kleiman FE. To polyadenylate or to deadenylate: that is the question. Cell Cycle. 2010;9:4437–4449. doi: 10.4161/cc.9.22.13887. [DOI] [PMC free article] [PubMed] [Google Scholar]
- Zhao X, Hirota T, Han X, Cho H, Chong LW, Lamia K, Liu S, Atkins AR, Banayo E, Liddle C, et al. Circadian amplitude regulation via FBXW7-targeted REV-ERBα degradation. Cell. 2016;165:1644–1657. doi: 10.1016/j.cell.2016.05.012. [DOI] [PMC free article] [PubMed] [Google Scholar]
Associated Data
This section collects any data citations, data availability statements, or supplementary materials included in this article.