

Abstract
Objective
To determine and compare gait speed during head-forward and side-to-side head-turn walking in individuals with lower versus greater lateral balance.
Design
Cross-sectional study
Setting
University research laboratory
Participants
Ninety-three older adults (42 men and 51 women) aged 73 ± 6.08 years who could walk independently participated in this study.
Main Outcome Measures
1) ‘balance tolerance limit’ (BTL), defined as the lowest perturbation intensity where a multistep balance recovery pattern was first evoked in response to randomized lateral waist-pull perturbations of standing balance to the left and right sides, at six different intensities (range from level two: 4.5 cm displacement at 180cm/s2 acceleration to level seven: 22.5 cm displacement at 900cm/s2 acceleration), 2) gait speed, 3) balance, and 4) mobility using an instrumented gait mat, Timed-Up-and-Go (TUG) and Activities-Specific Confidence (ABC) scale, respectively.
Results
Individuals with low versus high BTL had slower self-selected head-forward gait speed (HFGS) and head-turn gait speed (HTGS) (p = 0.002 and p < 0.001, respectively); the magnitude of difference was greater in HTGS than HFGS (Cohen's d = 1.0 versus 0.6). HTGS best predicted BTL. BTL was moderately and positively related (p = 0.003) to the ABC and negatively related (p = 0.017) to TUG.
Conclusions
HTGS is affected to a greater extent than HFGS in older individuals with poorer lateral balance and at greater risk of falls. Moreover, HTGS can be used to assess the interactions of limitations in lateral balance function and gait speed in relation to fall risk in older adults.
Keywords: Gait, Balance, Mobility, Falls, Older adults
Introduction
Aging is associated with increased gait variability 1, 2 and diminished gait speed 3 that increase the risk of falls. Common pedestrian activities such as crossing a street, walking across a parking lot, or shopping at a mall incorporate walking with side-to-side head-turns that may naturally challenge the control of balance and affect gait variability and speed, especially among older adults, through changes in gaze stabilization or attentional foci, vestibular or neck proprioceptive stimulation, or segmental body motion. From a balance control perspective, the successful completion of these activities is dependent upon one's ability to effectively regulate the relationship between the body center of mass (COM) and the base of support (BOS) 4. When the movement characteristics of the COM with respect to the BOS exceed safe spatial and temporal stability limits, balance becomes unstable 5. In such cases, modifying the COM-BOS relationship through adjustments in stepping parameters is a common means of stabilizing balance and preventing falls 6, 7. However, recovering balance through protective stepping is often problematic for older adults particularly in the lateral direction 6.
Walking with side-to-side head turns is most difficult in individuals with balance or vestibular disorders 8. Information on gait performance during transitions from forward walking without head-turns to walking with side-to-side head-turns in community-dwelling older adults is limited. In the event of a potential fall during walking with head-turns, it can be postulated that compensatory adjustments in medio-lateral stepping may be required due to difficulties with controlling lateral balance while walking. Therefore, improved understanding of the relationship between lateral balance and gait speed during walking with side-to-side head-turns in older adults would provide further insights about dynamic balance control during gait and potentially identifying therapeutic targets for designing fall-prevention rehabilitation programs.
The primary aim of this study was to determine and compare gait speeds during walking with the head oriented forward and walking with side-to-side head-turns in relation to lateral balance in older individuals. We also compared clinical measures of balance performance with laboratory-based measure of lateral balance. We hypothesized that individuals with poor lateral balance would have a greater deficit in gait speed in walking with side-to-side head-turns than with the head oriented forward.
Methods
Participants
Data from 93 community-dwelling older adults pooled from two separate studies with identical data collection methodology are reported here as shown in Table 1. Participants were recruited from the Baltimore/Washington area. Exclusion criteria included cognitive impairment, non-ambulatory, assisted ambulation, recent surgery, and any clinically significant functional impairment or medical problems that could limit functional activities. Participants signed informed consent approved by the Institutional Review Boards of University of Maryland, Baltimore and Veterans Administration Medical Center, Baltimore.
Table 1. Physical, Mobility, Balance, Gait, and Muscle Function Characteristics of Study Participants.
| All (n = 93) | Men (n = 42) | Women (n = 51) | |
|---|---|---|---|
| Age (years) | 73.9 ± 6.5 | 74.2 ± 6.9 | 73.7 ± 6.3 |
| Height (m) | 1.66 ± 0.09 | 1.7 ± 0.1 | 1.63 ± 0.08† |
| Body mass (kg) | 75.8 ± 14.9 | 80.8 ± 14.2 | 71.6 ± 14.3† |
| ABC (%) | 92.1 ± 10.0 | 95.4 ± 5.8* | 89.3 ± 11.8*† |
| TUG (second) | 10.4 ± 2.5 (n = 53) | 9.5 ± 1.7 (n =23) | 10.9 ± 2.9 (n = 30) |
| BTL (2/3/4/5/6/7) | 5/27/42/14/5/0 | 1/12/19/7/3/0 | 4/15/2 3/7/2/0† |
| SS Gait Speed ((m/s)/m) | 0.68 ± 0.12 | 0.68 ± 0.10 | 0.68 ± 0.14 |
| HT Gait Speed ((m/s)/m) | 0.60 ± 0.13 | 0.61 ± 0.13 | 0.60 ± 0.14 |
| Walking with head forward | |||
| Step length/body height | 0.38 ± 0.05 | 0.39 ± 0.05 | 0.37 ± 0.05 |
| Step width/body height | 0.38 ± 0.04 | 0.38 ± 0.04 | 0.37 ± 0.04 |
| Walking with head turn | |||
| Step length/body height | 0.34 ± 0.05 | 0.35 ± 0.05 | 0.34 ± 0.05 |
| Step width/body height | 0.35 ± 0.05 | 0.35 ± 0.04 | 0.34 ± 0.05 |
| Hip Torque (Nm/kg/m) | 0.007 ± 0.002 (n = 52) | 0.008 ± 0.003 (n = 23) | 0.007 ± 0.002 (n = 29) |
| Hip Power (Torque.rad/sec) | 0.43 ± 0.17 (n = 52) | 0.47 ± 0.19 (n =23) | 0.41 ± 0.13 (n =29) |
| DiffSpeed | 0.12 ± 0.12 | 0.11 ± 0.13 | 0.12 ± 0.11 |
Values are means ± SD
Different from All, p < 0.05
Different from Men, p < 0.01
Activities-Specific Balance Confidence Scale (ABC)
Timed-Up-and-Go (TUG)
Balance Tolerance Limit (BTL)
Self-Selected Gait Speed normalized to height (SS Gait Speed)
Head-Turn Gait Speed normalized to height (HT Gait Speed)
Difference between SS gait speed and HT gait speed normalized to SS Gait speed (DiffSpeed)
Study Design and Procedures
We utilized a cross-sectional study design. Participants completed all testing in a single session. First, they completed the balance and fall risk questionnaires. Next, clinical measures of mobility and balance were collected and followed by self-selected gait speed test with and without cued lateral head-turns. Finally, lateral balance was tested by applying laterally-directed postural perturbations delivered via position-controlled, motor-driven waist-pulls.
Anthropometrics
Height was measured to the nearest 0.1 cm using a wall-mounted stadiometera and body mass was measured to the nearest 0.1 kg by a balance beam scaleb while participants stood without shoes and in light clothing.
Activities-Specific Balance Confidence (ABC) questionnaire
All participants completed a self-reported measure of their level of confidence in carrying out 16 different types of activities related to their daily life without losing their balance on a scale ranging from 0% to 100%, where higher scores implied greater level of confidence in completing the activity without losing balance 9.
Fall Risk Assessment
Falls were defined as “events that resulted in a person coming to rest unintentionally on the ground or other lower level”10. Before participation, participants were asked if they fell within the previous year. If participants reported one or more falls in the previous year then they were classified as fallers, while individuals not reporting falls in the previous year were classified as non-fallers. 27/93 participants were labeled as fallers.
Clinical Tests of Balance and Mobility - Timed Up and Go (TUG)
Time required by participants to stand up from sitting on a chair, walk three meters at their regular pace, and then turn, walk back straight, and sit down on the chair was measured as their TUG score 11. A higher TUG score denotes decreased mobility and balance. Due to non-collection of this data from one of the two studies, TUG scores are reported from 53 participants.
Muscle Strength Assessment
Isokineticc hip abductor torque were determined via bilateral hip abduction concentric contractions at 60°/sec from 0° - 30° of hip abduction 12. Torques were normalized by body weight and body height, while hip joint power was calculated as the normalized peak torque multiplied by the angular velocity in radians per second. Due to non-collection of this data from one of the two studies, and corrupted data from one subject, hip strength measures are reported from 52 participants.
Gait Assessment
Data were collected at a sampling frequency of 120 Hz. Gait speed, step length, and step width were assessed using a GAITRite electronic walkwayd (length - 7.01 × width - 0.895 × height - 0.003 meters). Gait speed was determined by dividing the distance traveled by the ambulation time, step length represented the anterior-posterior distance from the heel-strike of one foot to toe-off of the contralateral foot, and step width was identified as the medial-lateral distance between the locations of sequential left and right heel strikes.
First, participants performed four trials of level head-forward over-ground walking at their self-selected speed. Self-selected head-forward gait speed was calculated as the mean gait speed over all the trials. Then, participants started walking at their self-selected speed and turned their head once to the right and then to the left, in consecutive order, when instructed to ‘look right’ and ‘look left’, respectively, while continuing to walk straight. Finally, they turned their head to the center when instructed to ‘look straight’ and continued walking until they crossed the mat. The tester walked behind the participant out of the participant's view. The tester gave oral commands of “turn right” or “turn left” without the participant knowing when the commands would occur. When giving oral commands, the tester also showed a hand signal to the camera which was recorded by video synchronized to GAITRite recording. The participant's head turns and footfalls were also recorded by video. Both, the tester's hand signal and the participant's responses in the video, were used to confirm the head turn phase. For each direction, a minimum of two steps were recorded. Gait speed, step length, and step width were calculated from the first step through the completion of head-turn for the left and right directions respectively.
Lateral Balance Testing
Waist-pull postural perturbations in the right and left lateral directions were applied at six different intensities, ranging from level two (4.5 cm displacement at 180cm/s2 acceleration) to level seven (22.5 cm displacement at 900cm/s2 acceleration). The details of the perturbation technique have been published previously13. Participants donned a mobile safety harness and wore their usual walking shoes and were asked to stand with their feet shoulder width apart on force platforms while an adjustable belt secured around their waist was attached to the pulling cables13.
Participants were instructed to react naturally to the perturbations and prevent themselves from falling. Lateral balance was assessed by determining the ‘balance tolerance limit’ (BTL), defined as the minimum perturbation intensity at which a multistep balance recovery pattern was evoked 13. Participants were categorized into two groups based on their BTL score: low-BTL (BTLs from 2-4), and high-BTL (BTLs from 5-7) with low BTL and high BTL indicating less stable lateral balance control and more stable lateral balance control, respectively. 74/93 participants were classified as low BTL while 19/93 participants were classified as high BTL. Furthermore, out of 42 men, 32 were low and 10 were high BTL; while, out of 51 women, 42 were low and nine were high BTL.
Statistical Analyses
All descriptive statistics are reported as mean ± standard deviation. Using an effect size of one SD for group differences, setting the alpha at 0.05 and power at 0.8, and considering unequal sample sizes, a minimum sample size of 11 individuals with low BTL and 41 individuals with high BTL was estimated to determine if there were group differences in gait speeds. Data were assessed for normality using skewness, kurtosis and the Shapiro-Wilk Test. Data were analyzed using SPSS 22.0 softwaree. Physical, mobility, balance and muscle function data were classified by groups: 1) men and women, and 2) low and high BTL. Independent t tests (for normally distributed variables) and Mann-Whitney U tests (for non-normally distributed variables) were used to determine group differences in physical characteristics, mobility, balance, and muscle torque for the groups: low versus high BTL, and men versus women. A Bonferroni adjustment was made for gait speed, step length, step width, hip torque, and hip power. Although head-turn gait speed for the left side was significantly (∼3%, p < 0.05) greater than for the right side, it was clinically insignificant (Cohen's d = 0.08). Therefore, an average of the left and the right sides for gait variables were calculated and used for all the calculations, as has been reported previously8. Self-selected head-forward gait speed, head-turn gait speed, step length, and step width were normalized to the body height. We also calculated the normalized difference in gait speeds: (normalized self-selected head-forward gait speed – normalized head-turn gait speed)/normalized self-selected head-forward gait speed. The magnitude of effects was measured using Cohen's d, with values of 0.2, 0.5, and 0.8 representing small, medium, and large effects. Spearman ρ correlation analysis was used to examine relationship between: 1) ABC and BTL, and 2) TUG and BTL. Stepwise sequential regression analysis was used to find the best predictor of BTL category. Age and gender were entered in the first block and in the second block a stepwise selection procedure was used for ABC, self-selected head-forward speed, head-turn gait speed, head-forward step length and step width, and head-turn step length and step width.
Results
Physical characteristics, clinical balance and mobility assessments, muscle performance and gait speed are presented in Table 1. All data were normally distributed except ABC, BTL, average power and average torque. There were no group differences in age. Women were shorter (Cohen's d = 0.8, p = 0.001) and had less body mass than men (Cohen's d = 0.6, p = 0.009). ABC score was lower in women versus men (Cohen's d = 0.6, p < 0.001). Also, BTL was lower in women versus men (Cohen's d = 0.2, p = 0.004). There were no gender-based group differences in step length, step width, hip power or torque, and gait speeds. Out of 27 fallers, ∼63% (17/27) were women and 37% (10/27) were men. Scatterplots of BTL with ABC and TUG are shown in Figure 1. BTL was moderately and positively related to ABC (Fig. 1A, Spearman ρ = 0.307, p = 0.003), and moderately and negatively related to TUG (Fig. 1B, Spearman ρ = -0.343, p = 0.017).
Figure 1.
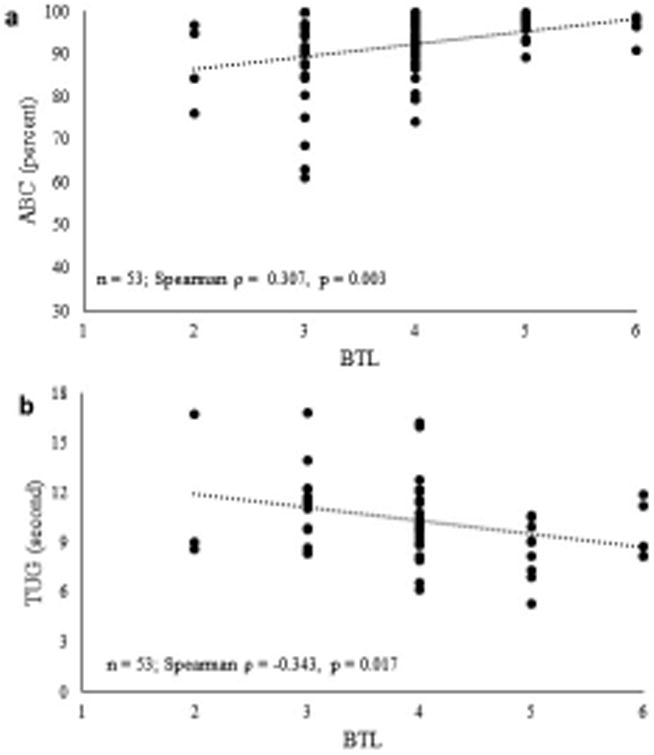
a. Scatterplot showing relationship between balance tolerance limit (BTL) and activities-specific balance confidence questionnaire (ABC); n = 93
b. Scatterplot showing relationship between balance tolerance limit (BTL) and timed up-and-go performance (TUG); n = 53
Physical characteristics, balance and mobility assessments, and muscle performance classified by BTL groups are reported in Table 2. No differences in age, height, body mass, and ABC scores were found between low and high BTL. Although hip power and torque tended to be lower in individuals with low BTL, they were not significant (Cohen's d = 0.5, p = 0.07 - 0.08). Individuals with low BTL had a slower TUG (Cohen's d = 0.9, p = 0.01) than high BTL (Figure 2). Self-selected head-forward gait speed (p = 0.002), head-turn gait speed (p < 0.001) (Figure 3), head-forward step length (p = 0.006), head-forward step-width (p = 0.012), head-turn step-length (p = 0.001), and head-turn step width (p < 0.001) (Figure 4) were lower in individuals with low BTL versus high BTL while difference in gait speeds were greater (p = 0.021) in individuals with low BTL versus high BTL (Figure 5). We observed greater deficits of 1) head-turn gait speed (Cohen's d = 1.0) than self-selected head-forward gait speed and difference in gait speeds (both Cohen's d = 0.6), 2) head-turn step length (Cohen's d = 1.0) than head-forward step length (Cohen's d = 0.7) and 3) head-turn step width (Cohen's d = 1.0) than head-forward step width (Cohen's d = 0.7) in individuals with low versus high BTL. Moreover, gender-based comparisons showed that both men and women, had slower head-turn gait speed (Cohen's d = 1.3 and 1.0, respectively) than self-selected head-forward gait speed (Cohen's d = 0.9 and 0.6, respectively), reduced step length in head-turn gait (Cohen's d = 1.2 and 0.7, respectively) than head-forward gait (Cohen's d = 0.9 and 0.6, respectively), and reduced step width in head-turn gait (Cohen's d = 1.2 and 0.8, respectively) than head-forward gait (Cohen's d = 0.9 and 0.5, respectively) in those with low versus high BTL. Stepwise sequential regression analyses showed head-turn gait speed (β = 0.412, CI = 0.685 – 1.868, p < 0.001) as the strongest predictor of BTL category.
Table 2. Physical and Muscle Function Characteristics of Study Participants based on BTL groups.
| Low BTL (n =74) | High BTL (n = 19) | |
|---|---|---|
| Age (years) | 73.7 ± 6.4 | 74.8 ± 7.0 |
| Height (m) | 1.67 ± 0.09 | 1.63 ± 0.09 |
| Body mass (kg) | 76.5 ± 15.3 | 72.8 ± 13.5 |
| ABC (%) | 91.1 ± 10.9 | 95.9 ± 3.7 |
| Hip Torque (Nm/kg/m) | 0.007 ± 0.002 (n = 37) | 0.008 ± 0.003 (n = 15) |
| Hip Power (Torque.rad/sec) | 0.41 ± 0.17 (n = 37) | 0.49 ± 0.14 (n =15) |
Values are means ± SD
Balance Tolerance Limit (BTL)
Activities-Specific Balance Confidence Scale (ABC)
Figure 2.
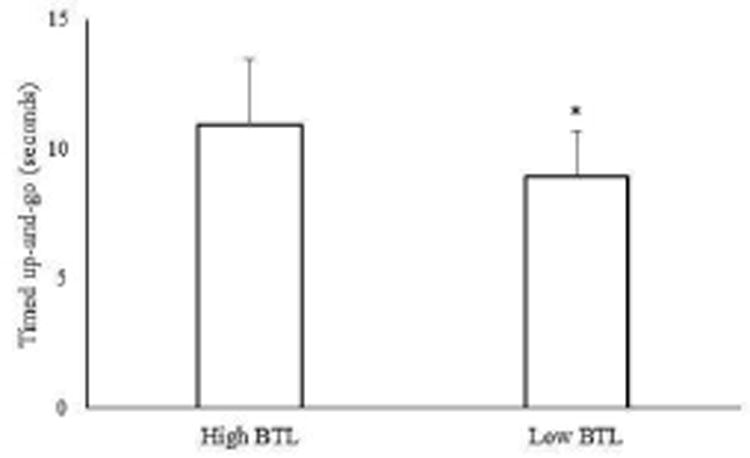
Timed up-and-go performance in individuals with low (n = 38) and high (n =15) balance tolerance limit (BTL). Means and standard deviations for each group are shown in the above figure. *Group difference, p < 0.05
Figure 3.
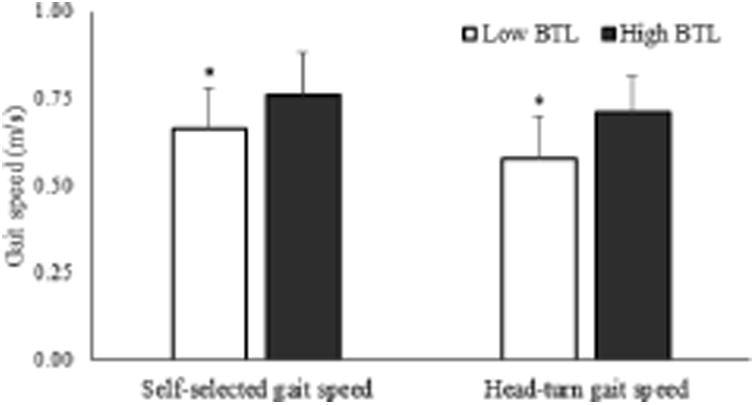
Self-selected head-forward gait speed and head-turn gait speed in individuals with low (n = 74) versus high (n = 19) balance tolerance limit (BTL). Means and standard deviations for each group are shown in the above figure. *Group difference, p < 0.05
Figure 4.
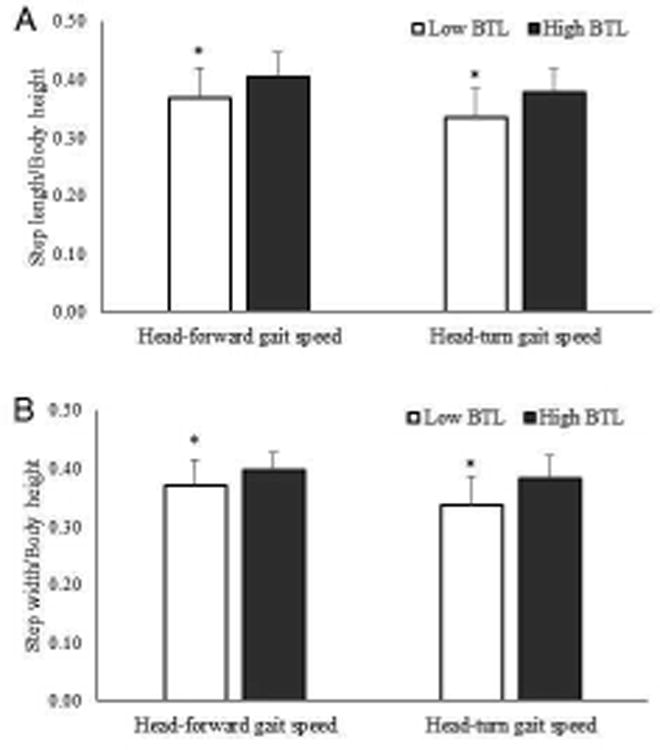
Difference in A) step length/body height and B) step width/body height in individuals with low (n = 74) versus high (n = 19) balance tolerance limit (BTL). Means and standard deviations for each group are shown in the above figure. *Group difference, p < 0.05
Figure 5.
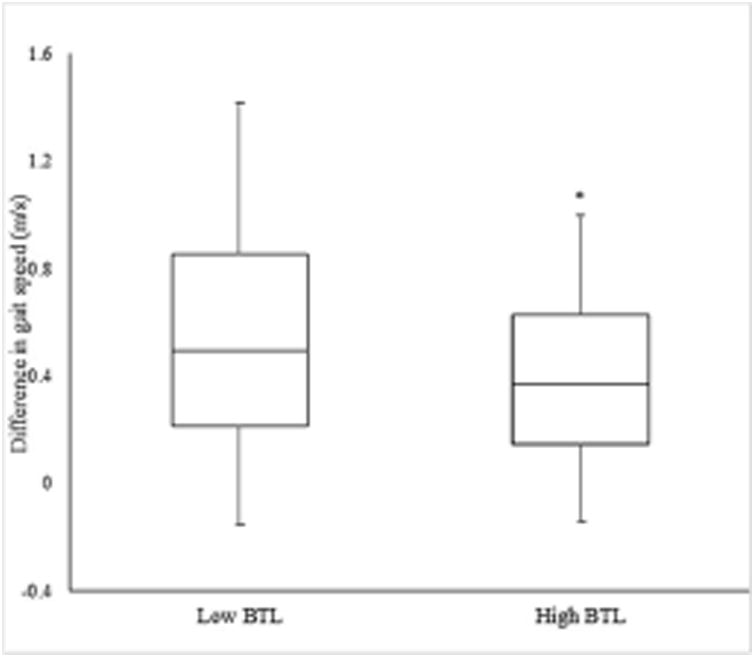
Difference in gait speed ((normalized self-selected head-forward gait speed -normalized head turn gait speed)/ normalized self-selected head-forward gait speed) in individuals with low (n = 74) versus high (n = 19) balance tolerance limit (BTL). Means and standard deviations for each group are shown in the above figure. *Group difference, p < 0.05
Discussion
To our knowledge, this is possibly the first study to investigate the relationship between head-turn gait speed and risk of falling in relation to the control of lateral balance during rapid protective stepping. Our findings indicated that gait speed, step length, and step width are affected to a greater extent in head-turn gait than self-selected head-forward gait in older individuals with poorer lateral balance and at greater risk of falls.
BTL and clinical assessments of balance and mobility
Our lab-based measure of lateral balance function, where a lower BTL score represents poorer balance, was positively associated with the clinical balance scale (ABC), and negatively associated with mobility performance on the TUG which corroborates the utility of BTL as a marker of balance ability in older individuals. This knowledge can help to determine if BTL, or some equivalent balance perturbation magnitude measure, can be utilized to determine the threshold of postural perturbations to prospectively determine and clinically differentiate low versus moderate versus high risk for falls. Moreover, a lower score on the ABC scale in women might reflect of a lower physical activity level than men because fear of falling is associated with diminished physical activity14, 15 and has been shown to be generally higher in older men than women16.
Although the speed of ongoing walking has normally been attributed to the motor control of gait parameters such as leg swing, propulsion, stride length, cadence and limb support, these variables mainly involve the sagittal plane of progression and vertical suspension. However, the ability to perform interlimb lateral weight transfer while maintaining balance in the frontal plane may also be an important determinant of forward gait speed. This may be particularly relevant to the age-associated reduction in gait speed and its relationship with the risk of falling. Also, anticipatory postural adjustments during stepping get slower with aging indicating supraspinal deterioration17. Thus, situations that may increase challenges to lateral balance control especially during voluntary actions such as side-to-side head-turns while walking, may be particularly problematic for many older adults who display poor anticipatory postural adjustments and are vulnerable to lateral instability. Our new findings appear to support this possibility by showing that older individuals who have greater difficulty with recovering their balance through stepping in the lateral direction, demonstrate greater reductions in gait speed when performing side-to-side head-turns to each side than those with better lateral balance. Additionally, the laboratory-based measure of lateral balance that has been previously shown to prospectively predict the risk of falls12 in a similar cohort of older adults was significantly associated with clinical assessments of balance and mobility that indicate the likelihood of falling. These observations provide directives for designing rehabilitation assessments and interventions by identifying deficits in balance and locomotion interactions and providing therapeutic targets for preventing falls among older adults. Interestingly, we did not find any difference in hip abductor muscle torque between individuals with low and high BTL which may be due to the unequal sample sizes in these groups (37 low BTL versus 15 high BTL). In addition, each BTL group had unequal % of men and women, where muscle strength declines at a higher rate in men than women 18, 19.
Head-turn Gait Speed and BTL
Previous studies using the dynamic gait index (DGI) have shown that head-turn gait speed was the most difficult and adversely affected of all the different DGI tasks in individuals with balance or vestibular disorders compared to controls 20. Our findings of greater deficits in step length and step width in head-turn gait versus head-forward gait is in line with past finding where gait parameters such as speed, cadence and step length were affected to the greatest degree for the DGI task of walking with side-to-side head-turn in older individuals 20. Our findings extend these observations by showing that deficits in head-turn gait speed were associated with impaired lateral balance as determined by protective stepping performance in older individuals.
Several factors may have contributed to the worsening of head-turn walking speed in those with poorer lateral balance. Vestibular hair cells decline with aging resulting in a reduced capacity for detecting rotational head movements21. Thus, age-related deficits in vestibular function 20, 21 can impair the ability to detect changes in head acceleration and may have contributed to slowing of head-turn gait speed in those at greater risk of falls. Furthermore, postural changes in muscle activity and associated compensations due to head turns may slow down gait speed to guard against balance instability 22. This was supported by our findings of reduced step length and step width in head-turn gait in adults with poorer lateral balance. Furthermore, in a previous study 23, elderly participants minimized the amount and velocity of head and body rotation, while walking with side-to-side head-turns, to minimize postural perturbations associated with the task. The challenging nature of this task was further supported by the positive association between large amplitude side-to-side head movements and altered trunk-pelvis coordination in the horizontal plane while turning the head during walking in younger adults 23. A reduced head-turn gait speed may also be related to interference due to the attention demands of turning the head while walking which could be considered a dual task 23. Evidence suggests that even under relatively simple task conditions, healthy older adults show heightened attentional demands for postural control 24. Moreover, previous research indicates that many falls in balance-impaired older adults occur while walking and concomitantly performing a secondary motor task, such as talking or carrying an object 25. Based on our findings and previous studies,8, 22-24 it can be anticipated that walking with head-turns, which is a dynamic postural control task, has a potential to exacerbate difficulties with balance which otherwise may be less apparent. It is also possible that the head-turn while walking could reduce gait speed by hindering the ability to stabilize the visual field 20. Also, effective transitions in gait speed and direction, and between different walking terrains are often dependent on visual information 26. It has been shown that the speed of walking slows if visual information specifies a forward speed greater than the actual biomechanical rate of travel 26, which could occur with transient head-turns while walking.
Study Limitations
Among the limitations of this study is the percentage of total participants (∼40%) who were not tested for TUG, hip power and torque; however, even after accounting for missing participant data, the study had sufficient statistical power to detect group differences. Secondly, although the BTL assesses lateral balance and can be used as an indicator of balance capability, the specific impairments in motor control factors underlying balance-related reductions in individuals with lower gait speed with side-to-side head-turns remain to be determined. Although retrospective fall history was reported in this study, which may be less reliable due to recall, it has been found to be consistent with actual numbers of future falls in older people 27.
Conclusions
The results from this study suggest that head-turn gait speed is affected more than self-selected head-forward walking speed in community-dwelling older individuals, and is associated with lateral balance stability. Clinically, head-turn gait speed may potentially differentiate future fallers from non-fallers. Future studies are needed to investigate if interventions aimed at mitigating reduced head-turn gait speed in association with impaired balance function in older adults at risk of falls can improve lateral balance.
Highlights.
Head turn gait speed is affected to a greater extent than self-selected gait speed in older individuals with diminished lateral balance stability and at greater risk of falls.
BTL has a potential to be a marker of balance ability in older individuals.
Prospective studies are need to examine if head turn gait speed can differentiate future fallers from non-fallers.
Acknowledgments
We certify that no party having a direct interest in the results of the research supporting this article has or will confer a benefit on us or on any organization with which we are associated AND, if applicable, we certify that all financial and material support for this research (eg, NIH grants) and work are clearly identified in the title page of the manuscript. The manuscript submitted does not contain information about medical device(s).
Study sponsor: This study was supported by National Institutes of Health (NIH) grants R01AG029510 and R01AG033607, the University of Maryland Claude D Pepper - Older Americans Independence Center Grant (OAIC) NIH/NIA grant P30 AG028747, the University of Maryland Advanced Neuromotor Rehabilitation Research Training (UMANRRT) Program, supported by the National Institute on Disability and Rehabilitation Research (NIDRR) grant H133P100014, and the Baltimore VA Medical Center, Geriatric Research, Education and Clinical Center (GRECC). The funding agencies had no involvement in: (1) the study design; (2) the collection, analysis, and interpretation of data; (3) the writing of the report; or (4) the decision to submit the paper for publication.
Abbreviations
- ABC scale
Activities-Specific Balance Confidence scale
- TUG
Timed Up and Go (TUG
- BTL
Balance Tolerance Limit
Footnotes
Seca Model 242, Seca, 7240 Parkway Drive, Suite 120, Hanover, MD 21076
DETECTO, Model CN20, DETECTO, 203 East Daughtery Street, P.O.Box 151, Webb City, MO
Biodex System 4, Biodex Medical Systems, Inc. 20 Ramsey Road, Shirley, NY 11967
GAITRite, CIR Systems Inc., 12 Cork Hill Road, #2, Franklin, NJ 07416
IBM Corporation, 1 New Orchard Road, Armonk, NY 10504
Conflicts of Interest: Harshvardhan Singh, Ozell Sanders, Sandy McCombe Waller, Woei-Nan Bair, Brock Beamer, Robert A. Creath and Mark W. Rogers declare that they have no conflict of interest.
Publisher's Disclaimer: This is a PDF file of an unedited manuscript that has been accepted for publication. As a service to our customers we are providing this early version of the manuscript. The manuscript will undergo copyediting, typesetting, and review of the resulting proof before it is published in its final citable form. Please note that during the production process errors may be discovered which could affect the content, and all legal disclaimers that apply to the journal pertain.
References
- 1.Hausdorff JM, Rios DA, Edelberg HK. Gait variability and fall risk in community-living older adults: a 1-year prospective study. Archives of physical medicine and rehabilitation. 2001;82(8):1050–6. doi: 10.1053/apmr.2001.24893. [DOI] [PubMed] [Google Scholar]
- 2.Hornbrook MC, Stevens VJ, Wingfield DJ, Hollis JF, Greenlick MR, Ory MG. Preventing falls among community-dwelling older persons: results from a randomized trial. The Gerontologist. 1994;34(1):16–23. doi: 10.1093/geront/34.1.16. [DOI] [PubMed] [Google Scholar]
- 3.Beavers KM, Beavers DP, Houston DK, Harris TB, Hue TF, Koster A, et al. Associations between body composition and gait-speed decline: results from the Health, Aging, and Body Composition study. The American journal of clinical nutrition. 2013;97(3):552–60. doi: 10.3945/ajcn.112.047860. [DOI] [PMC free article] [PubMed] [Google Scholar]
- 4.Winter DA. Human balance and posture control during standing and walking. Gait & posture. 1995;3(4):193–214. [Google Scholar]
- 5.Rogers MW, Mille ML. Lateral stability and falls in older people. Exercise and sport sciences reviews. 2003;31(4):182–7. doi: 10.1097/00003677-200310000-00005. [DOI] [PubMed] [Google Scholar]
- 6.Mille ML, Johnson-Hilliard M, Martinez KM, Zhang Y, Edwards BJ, Rogers MW. One step, two steps, three steps more… Directional vulnerability to falls in community-dwelling older people. The Journals of Gerontology Series A: Biological Sciences and Medical Sciences. 2013;68(12):1540–8. doi: 10.1093/gerona/glt062. [DOI] [PMC free article] [PubMed] [Google Scholar]
- 7.Rogers MW, Hedman LD, Johnson ME, Martinez KM, Mille ML. Triggering of protective stepping for the control of human balance: age and contextual dependence. Cognitive brain research. 2003;16(2):192–8. doi: 10.1016/s0926-6410(02)00273-2. [DOI] [PubMed] [Google Scholar]
- 8.Marchetti GF, Whitney SL, Blatt PJ, Morris LO, Vance JM. Temporal and spatial characteristics of gait during performance of the Dynamic Gait Index in people with and people without balance or vestibular disorders. Physical therapy. 2008;88(5):640–51. doi: 10.2522/ptj.20070130. [DOI] [PMC free article] [PubMed] [Google Scholar]
- 9.Powell LE, Myers AM. The activities-specific balance confidence (ABC) scale. The Journals of Gerontology Series A: Biological Sciences and Medical Sciences. 1995;50(1):M28–M34. doi: 10.1093/gerona/50a.1.m28. [DOI] [PubMed] [Google Scholar]
- 10.Ageing WHO, Unit LC. WHO global report on falls prevention in older age. World Health Organization; 2008. [Google Scholar]
- 11.Wall JC, Bell C, Campbell S, Davis J. The Timed Get-up-and-Go test revisited: measurement of the component tasks. Journal of rehabilitation research and development. 2000;37(1):109–13. [PubMed] [Google Scholar]
- 12.Hilliard MJ, Martinez KM, Janssen I, Edwards B, Mille ML, Zhang Y, et al. Lateral balance factors predict future falls in community-living older adults. Archives of physical medicine and rehabilitation. 2008;89(9):1708–13. doi: 10.1016/j.apmr.2008.01.023. [DOI] [PMC free article] [PubMed] [Google Scholar]
- 13.Yungher DA, Morgia J, Bair WN, Inacio M, Beamer BA, Prettyman MG, et al. Short-term changes in protective stepping for lateral balance recovery in older adults. Clinical biomechanics. 2012;27(2):151–7. doi: 10.1016/j.clinbiomech.2011.09.003. [DOI] [PMC free article] [PubMed] [Google Scholar]
- 14.Myers AM, Powell LE, Maki BE, Holliday PJ, Brawley LR, Sherk W. Psychological indicators of balance confidence: relationship to actual and perceived abilities. The Journals of Gerontology Series A: Biological Sciences and Medical Sciences. 1996;51(1):M37–M43. doi: 10.1093/gerona/51a.1.m37. [DOI] [PubMed] [Google Scholar]
- 15.Myers AM, Fletcher PC, Myers AH, Sherk W. Discriminative and evaluative properties of the activities-specific balance confidence (ABC) scale. The Journals of Gerontology Series A: Biological Sciences and Medical Sciences. 1998;53(4):M287–M94. doi: 10.1093/gerona/53a.4.m287. [DOI] [PubMed] [Google Scholar]
- 16.Musselman K, Brouwer B. Gender-related differences in physical performance among seniors. Journal of aging and physical activity. 2005;13(3):239–53. doi: 10.1123/japa.13.3.239. [DOI] [PubMed] [Google Scholar]
- 17.Cohen RG, Nutt JG, Horak FB. Errors in postural preparation lead to increased choice reaction times for step initiation in older adults. The Journals of Gerontology Series A: Biological Sciences and Medical Sciences. 2011;66(6):705–13. doi: 10.1093/gerona/glr054. [DOI] [PMC free article] [PubMed] [Google Scholar]
- 18.Goodpaster BH, Park SW, Harris TB, Kritchevsky SB, Nevitt M, Schwartz AV, et al. The loss of skeletal muscle strength, mass, and quality in older adults: the health, aging and body composition study. The Journals of Gerontology Series A: Biological Sciences and Medical Sciences. 2006;61(10):1059–64. doi: 10.1093/gerona/61.10.1059. [DOI] [PubMed] [Google Scholar]
- 19.Hughes VA, Frontera WR, Wood M, Evans WJ, Dallal GE, Roubenoff R, et al. Longitudinal muscle strength changes in older adults influence of muscle mass, physical activity, and health. The Journals of Gerontology Series A: Biological Sciences and Medical Sciences. 2001;56(5):B209–B17. doi: 10.1093/gerona/56.5.b209. [DOI] [PubMed] [Google Scholar]
- 20.Whitney SL, Marchetti GF, Pritcher M, Furman JM. Gaze stabilization and gait performance in vestibular dysfunction. Gait & posture. 2009;29(2):194–8. doi: 10.1016/j.gaitpost.2008.08.002. [DOI] [PMC free article] [PubMed] [Google Scholar]
- 21.Lopez I, Ishiyama G, Tang Y, Tokita J, Baloh RW, Ishiyama A. Regional estimates of hair cells and supporting cells in the human crista ampullaris. Journal of neuroscience research. 2005;82(3):421–31. doi: 10.1002/jnr.20652. [DOI] [PubMed] [Google Scholar]
- 22.Rankin JK, Woollacott MH, Shumway-Cook A, Brown LA. Cognitive influence on postural stability a neuromuscular analysis in young and older adults. The Journals of Gerontology Series A: Biological Sciences and Medical Sciences. 2000;55(3):M112–M9. doi: 10.1093/gerona/55.3.m112. [DOI] [PubMed] [Google Scholar]
- 23.Paquette C, Paquet N, Fung J. Aging affects coordination of rapid head motions with trunk and pelvis movements during standing and walking. Gait & posture. 2006;24(1):62–9. doi: 10.1016/j.gaitpost.2005.07.001. [DOI] [PubMed] [Google Scholar]
- 24.Shumway-Cook A, Brauer S, Woollacott M. Predicting the probability for falls in community-dwelling older adults using the Timed Up & Go Test. Physical therapy. 2000;80(9):896–903. [PubMed] [Google Scholar]
- 25.Lundin-Olsson L, Nyberg L, Gustafson Y. Stops walking when talking as a predictor of falls in elderly people. Lancet. 1997;349(9052):617. doi: 10.1016/S0140-6736(97)24009-2. [DOI] [PubMed] [Google Scholar]
- 26.Mohler BJ, Thompson WB, Creem-Regehr SH, Pick HL, Jr, Warren WH., Jr Visual flow influences gait transition speed and preferred walking speed. Experimental brain research. 2007;181(2):221–8. doi: 10.1007/s00221-007-0917-0. [DOI] [PubMed] [Google Scholar]
- 27.Berg RL, Cassells JS. The second fifty years: Promoting health and preventing disability. National Academy Press; 1990. [PubMed] [Google Scholar]