

Abstract
Recent studies implicate innate immunity to systemic lupus erythematosus (SLE) pathogenesis. Toll-like receptor (TLR)8 is estrogen-regulated and binds viral ssRNA to stimulate innate immune responses, but recent work indicates that microRNA (miR)-21 within extracellular vesicles (EVs) can also trigger this receptor. Our objective was to examine TLR8 expression/activation to better understand sex-biased responses involving TLR8 in SLE. Our data identify an estrogen response element that promotes STAT1 expression and demonstrate STAT1-dependent transcriptional activation of TLR8 with estrogen stimulation. In lieu of viral ssRNA activation, we explored EV-encapsulated miR-21 as an endogenous ligand and observed induction of both TLR8 and cytokine expression in vitro. Moreover, extracellular miR detection was found predominantly within EVs. Thus, just as a cytokine or chemokine, EV-encapsulated miR-21 can act as an inflammatory signaling molecule, or miRokine, by virtue of being an endogenous ligand of TLR8. Collectively, our data elucidates a novel innate inflammatory pathway in SLE.
Keywords: Systemic Lupus Erythematosus, Estrogen, Innate Immunity, microRNA (miR), Toll-like Receptor (TLR)8, Extracellular Vesicles
Graphical abstract
1. Introduction
Estrogen can promote gene expression by several mechanisms, but the primary route of influence is the classical pathway, which is mediated by direct DNA binding of cytosolic estrogen receptors alpha and beta (ERα/β) to estrogen response elements (EREs) following nuclear translocation [1]. While a limited number of genes are known to be regulated by estrogen at present, recent evidence suggests that this list is likely much larger [2]. In lupus mouse models, studies have shown enhanced survival and decreased disease severity with ERα deficiency, while no effect was observed with regard to ERβ [3, 4]; thus supporting other studies also indicating the important role of the ERα receptor subtype in promoting autoimmune-mediated inflammation [5]. Additionally, we have previously identified a novel ERE proximal to the toll-like receptor (TLR)8 genetic locus and, using peripheral blood mononuclear cells (PBMCs) derived from systemic lupus erythematosus (SLE) patients and healthy controls, demonstrated both elevated expression of TLR8 in SLE and significant ERα-dependent induction with estrogen treatment [6]. Furthermore, stimulation of leukocytes from ERα deficient, lupus-prone mice with TLR agonists has been shown to elicit a significantly reduced inflammatory response [4]. Collectively, these data indicate an association between ERα-mediated TLR activation following estrogen stimulation and suggest that this pathway may be involved pathologically in SLE.
TLR8 is an innate immune system receptor expressed predominately in macrophages that stimulates inflammatory responses by binding to pathogen-associated, single-stranded (ss)RNA sequences [7]. Despite the well-established association of the adaptive arm of the immune system, the role of innate immunity in SLE pathogenesis and perpetuation has recently emerged (reviewed in [8]). TLRs serve as a key interface between innate and adaptive immunity and could therefore be a mechanistic link between these responses. Our previous studies have shown that synthetic agonist stimulation of TLR8 expression is enhanced in the presence of estrogen and heightened in females when compared to male counterparts [6], which suggest that estrogen can lower the threshold of inflammatory activation in the presence of a TLR8 agonist and produce a sex-biased response. In addition to synthetic and viral ssRNA agonists, recent cancer research has uncovered that endogenous microRNAs (miRs) can also mediate paracrine TLR8 activation. These results demonstrated that extracellular vesicles (EVs) containing miR-21 secreted from tumor cells were engulfed by macrophages, fused with endosomes, and activated pro-inflammatory cytokine expression via TLR8 binding and signaling [9].
Since EVs are associated with inflammation and distinct miR expression patterns have been characterized in SLE [10, 11], this TLR8 signaling pathway may present a novel sex-biased mechanism regulating autoimmunity. To examine estrogen signaling and TLR8 activation in SLE, primary human cells and cell lines were treated with estrogen. We observe enhanced estrogenic responses in SLE patients and identify a putative ERE for ERα to promote signal transducer and activator of transcription (STAT)1 expression. Furthermore, we demonstrate that STAT1 transcriptionally regulates TLR8 expression and is overexpressed in SLE patients. To investigate miR-21 as an endogenous agonist to mediate TLR8 activation, liposomal formulations containing miR-21 were used to stimulate TLR8 and cytokine expression; conversely, this response was suppressed in primary macrophages with a miR-21 antagonist. Taken together, these data suggest that estrogen can stimulate TLR8 expression either directly through an ERE or indirectly through STAT1 and can be activated by EV-derived miR-21, which presents a novel therapeutic pathway to target in SLE.
2. Materials and Methods
2.1 Human samples
Female SLE patients meeting the revised criteria of the American College of Rheumatology [12] were recruited for this study from The Ohio State University Wexner Medical Center (OSUWMC) clinics. Age and sex-matched healthy volunteers were recruited from the American Red Cross and local communities using the Research Match program through the Center for Clinical and Translational Science (CCTS) at The Ohio State University. All study participants were not taking hormonal medications and were pre-menopausal. Participation was in accordance with an approved Institutional Review Board protocol at OSUWMC. Samples obtained for processing were either whole blood collected into heparinized tubes or filtered blood samples. PBMC isolation was carried out using Ficoll-Paque centrifugation (GE Healthcare, Uppsala, Sweden) as previously described [6].
2.2 Gene arrays
Total RNA was submitted for gene array analysis using HG-U133 Affymetrix® Human Gene Chips with untreated PBMC arrays serving as the internal baseline control for each individual sample. Baseline values were subtracted from the estrogen-treated expression values; thus, only the estrogen-mediated effect was reported. Plots were generated using the Multiplot function within the GenePattern software program and the data was analyzed using the core Analysis function of Ingenuity Pathway Analysis Software as detailed formerly [13].
2.3 Hormone treatment
Human PBMCs were isolated from patients and cultured in hormone free conditions as previously described by our group [14] using RPMI 1640 (Life Technologies, Grand Island, NY) and 5% charcoal stripped fetal bovine serum (FBS; Life Technologies). Hematopoietic cell lines were grown in RPMI 1640 supplemented with 10% FBS then transferred to XVIVO-15 (Lonza, Basel, Switzerland) chemically defined, hormone free media for 24 hours prior to hormone stimulation. Cells were treated with 10 nM of 17β-estradiol (E2; Sigma-Aldrich, St. Louis, MO), 10 nM Progesterone (Sigma), 10 ng/mL Prolactin (Sigma), or 10 nM dihydrotestosterone (5 α-androstatin-17β-ol-one; Fluka, Buchs, Switzerland) and were collected at the indicated times according to previously established protocols [6].
2.4 Chromatin immunoprecipitation sequencing (ChIP-seq)
MCF-7 cells were treated with 1 nM E2 for 45 min following 72 h culture in DMEM (Life Technologies) media containing 5% charcoal/dextran treated FBS. ChIP assays were performed as previously described using ERα antibody (Santa Cruz Biotechnology, Santa Cruz, CA) [15]. Sequencing libraries were prepared from ChIP enriched DNA using the Tru-seq Chip Sample Prep Kit (Illumina, San Diego, CA) according to manufacturer's protocol. Each library was sequenced on one lane of an Illumina GA IIx platform generating 40bp single end reads. Sequences were aligned to the University of California, Santa Cruz hg19 human reference genome using the Bowtie short read mapping utility and graphical maps of aligned reads were generated using HOMER [16]. Images shown were generated in the Integrative Genomics Viewer [17].
2.5 RNA purification and qPCR
Cellular RNA was isolated, quantitated, synthesized to cDNA, and used for quantitative (q)PCR as previously described by our group [14]. Briefly, RNA was isolated from PBMCs using the RNeasy Mini Kit (Qiagen Sciences, Valencia, CA) and from whole blood samples using the Paxgene Blood RNA Kit (PreAnalytix; Qiagen) according to manufacturer's protocol. RNA was quantitated using a NanoDrop 1000 spectrophotometer (NanoDrop Products, Wilmington, DE). cDNA was synthesized using High Capacity cDNA Reverse Transcription Kit (Applied Biosystems, Foster City, CA) following manufacturer's protocol and qPCR was performed using the TaqMan system (Applied Biosystems) using cDNA and gene specific primers in accordance with the manufacturer's protocol. All samples were run on the ABI Prism 7900HT Sequence Detection System (Applied Biosystems) and normalized to 18sRNA as an internal positive control. Results were analyzed using the 2−ΔΔCt method [6].
For analysis of RNA in EVs, RNA was isolated according to manufacturer's protocol using the MagMAX mirVana total RNA isolation kit (Thermo Fisher Scientific, Rockford, IL). EVs were isolated per manufacturer's protocol from human serum using ExoQuick (System Biosciences, Palo Alto, CA). Both the EV and non-EV fractions were processed in the presence of chemical RNase inhibitor, RNAsecure (Thermo Fisher Scientific). Purified RNA was measured on the Agilent 2100 bioanalyzer system using the Total RNA Pico and Small RNA capillary electrophoresis assays (Agilent Technologies, Santa Clara, CA).
2.6 Electrophoretic mobility shift assay (EMSA)
EMSA was performed as detailed formerly [14]. Briefly, cells were stimulated with 10 nM E2 (Sigma) for the indicated time and nuclear lysates were incubated with probes labeled with [32P] dCTP by the Klenow fragment of DNA polymerase. Probes corresponding to the putative ERE site proximal to the STAT1genetic locus included: 5′-GGGAGAATCTAGGTCAAGGTCCTTC-3′ and 5′-GAAGGACCTTGACCTAGATTCT-3′. Additionally, recombinant ERα protein (Thermo Scientific) was incubated with these DNA fragments to confirm the specificity prior to gel electrophoresis. Probes designed to interrogate a previously characterized STAT1 binding region downstream of the TLR8 genetic locus [18] included: 5′-GGGCTTTATTCTCTGAAACACCCACT and 5′-AGTGGGTGTTTCAGAGAATAAAG.
2.7 Western blotting
Samples were prepared and western blotting was performed according to previously described methods [14]. Briefly, cell lysates were prepared using Bio-Rad Sample buffer (Life Science Research, Hercules, CA) containing 0.5% 2-mercaptoethanol. Protein samples were resolved on 4-20% Tris-HCl Bio-Rad Ready Gels (Life Science Research) and transferred onto PVDF membranes (GE Healthcare). Membranes were incubated with TLR8 (Rockland Immunochemicals Inc., Gilbertsvilla, PA), STAT1 (Santa Cruz Biotechnology), or p-STAT1 (Santa Cruz Biotechnology) antibody and stripped using Millipore Re-Blot Plus (Millipore, Temecula, CA) for reprobing with monoclonal β-actin antibody (Sigma Aldrich). ImageJ software (NIH, Bethesda, MD; v1.45s) was used to measure signal intensities and results were analyzed with Microsoft Excel (v2013). Final quantitations of protein expression were determined by normalization to β-actin levels.
2.8 Liposomal transfection and fluorescent microscopy
Cells were stimulated with synthetically produced vesicles containing miR-21 by encapsulating 15 μg of miR-21 mimic 5′-UAGCUUAUCAGACUGAUGUUGA-3′ (Sigma) or miR-scramble 5′-UAAGGCUAUGAAGAGAUAC-3′(Sigma) using DOTAP (Roche, Basel, Switzerland) transfection reagent according to manufacturer's protocol. Fluorescent microscopy was captured on the ZOE fluorescent cell imager (Bio-Rad) using smart-flare miR-21 (EMD Millipore Bioscience, Billerica, MA) or miR-scramble (EMD) in RNAi-MAXX Lipofectamine reagent (ThermoFisher) following manufacturer's protocol. Cells were treated with 0.3 μg/mL R-848 (Enzolife Sciences, Farmingdale, NY), 100 μM of MyD88 inhibitor (Novus Biologicals, Littleton, CO), or 100 μM of control peptide (Novus Biologicals) as indicated. After 24 hours, cells and supernatants were collected. To target autologous EVs containing miR-21, primary human PBMCs were isolated from whole blood as indicated above, incubated in the presence of 20% autogolous serum, and treated with locked nucleic acid (LNA) sequences designed to antagonize miR-21 (Exiqon, Vedbaek, Denmark) following liposomal complexing with DOTAP (Roche) according to manufacturer's protocol.
2.9 ELISA (enzyme-linked immunosorbent assay)
Analysis of cytokine expression was performed on conditioned media using electrochemiluminescence detection (Meso Scale Diagnostics, Rockville MD) according to the manufacturer's protocol and data was analyzed using Microsoft Excel (v2013).
2.10 Nanoparticle tracking analysis (NTA)
The NanoSight LM10 system (NanoSight, Wiltshire, United Kingdom) was used to measure the rate of Brownian motion of particles to determine the size and quantification of EVs. Briefly, the sample was injected in a NanoSight cubicle and the size of particles was obtained by determining the motion in fluid passing across the chamber. The number of particles per milliliter was measured from a 0 – 160 nm range and was acquired from both experimental and control samples for comparison using area under the curve calculations obtained via the linear trapezoidal analysis method.
2.11 Statistics
All numerical data were expressed as mean values ± standard deviation. Statistical differences were determined by paired, two-tailed, Student t-tests using Microsoft Excel (v2013) and considered statistically significant if p ≤ 0.05.
3. Results
3.1 Heightened estrogenic responses are observed in SLE patients
We have previously demonstrated that physiological levels of estrogen can effectively lower the threshold of immune activation, which may account for enhanced resistance to infectious disease in many female species, but may also contribute to autoimmunity if dysregulated [6]. Furthermore, using PBMCs derived from SLE patients or age and sex-matched healthy controls, we have used microarray gene expression data to identify potential genes regulated by estrogen to account for this response [14]. To further explore estrogenic potential to influence genetic expression genome-wide in PBMCs from both SLE patients and healthy individuals, this gene array data was further analyzed using GenePattern software. Using the Multiplot function within the program to create a 2-parameter scatter plot, the genome-wide estrogenic effect on the entire probe set can visualized simultaneously. With estrogen treatment of healthy PBMCs, 236 probes are significantly upregulated over 2-fold and 244 are downregulated more than 2-fold (p < 0.05; Fig. 1A). However, the response with estrogen stimulation of SLE PBMCs was heightened; here, 1005 and 2530 probes are significantly up or downregulated over 2-fold, respectively (p < 0.05; Fig. 1A). To identify genes that are uniquely regulated with estrogen treatment in both healthy and SLE samples, expression values were plotted onto a fold change vs. fold change plot. If expression is regulated similarly in healthy and SLE datasets on this plot, the probe will follow a linear relationship and appear in the upper-right or lower-left quadrants. Conversely, exclusive up and downregulation will appear in the remaining quadrants. While estrogen treatment exclusively upregulated 134 and downregulated 107 probes in healthy volunteers, 525 and 1629 were significantly up or downregulated in SLE patients to statistical significance, respectively (Supplemental Fig. 1). These results were consistent with an enhanced responsiveness to estrogen in SLE patients.
Fig. 1. Estrogenic responses are enhanced in SLE and estrogen promotes protein binding to a response element proximal to the STAT1 genetic locus.

(A) PBMCs from SLE patients and healthy controls were isolated from whole blood and stimulated with estrogen (E2; 10 nM) for 48 h. RNA was isolated and gene arrays were analyzed using GenePattern software relative to untreated (media) controls. Red lines indicate a 2-fold change in gene expression with E2 treatment. Black dots indicate probe detection that is not statistically significant; red and blue dots indicate a significant increase or decrease in probe detection, respectively (p < 0.05). (B) Graphical output expressed in reads per million (RPM) of ChIP-enriched DNA sequencing. MCF-7 cells were treated for 45 min with ethanol (EtOH) vehicle or E2 (1 nM) and ChIP assays were performed with ERα specific antibody. Putative ERα binding peak is indicated with an arrow. (C-D) EMS A of nuclear lysates from THP-1 cells incubated with 32P-labeled probes corresponding to the ERα binding sequence derived from ChIP-seq (B). (C) Cells stimulated with E2 (10 nM). (D) 6 h incubation with recombinant ERα protein. Representative results are shown from individual experiments run in triplicate (A) or duplicate (B-D).
3.2 Putative estrogen response element is identified proximal to STAT1
To further validate the array data and identify candidate genes potentially regulated by ERα in SLE, chromatin immunoprecipitation sequencing (ChIP-seq) was performed on a human breast cancer cell line (MCF-7) stimulated with a physiological dose of estrogen for 45 min. Following stimulation, nuclear extracts were cross-linked and incubated with ERα antibody to identify putative EREs. Chip-seq analysis revealed a novel intragenic binding peak within the STAT1 genetic locus with estrogen treatment (Fig. 1B). STAT1 regulates the induction of interferon stimulated gene expression and has recently been identified to play a key role in autoimmune disease, including rheumatoid arthritis, diabetes, and inflammatory bowel disease [19-21]. Furthermore, while a previous study has demonstrated induction of STAT1 expression and activation in a murine model of lupus nephritis [22], human data displaying this association is currently lacking and the role of this signaling pathway in SLE pathogenesis has yet to be comprehensively characterized.
To confirm estrogen-mediated DNA-protein complex formation using this putative ERE sequence intragenic to STAT1, an electrophoretic mobility shift assay (EMSA) was performed using the human macrophage precursor THP-1 monocytic cell line after estrogen stimulation. Nuclear extracts were collected longitudinally and incubated with radiolabeled probes containing the STAT1 ERE sequence. Enhanced DNA-protein complex formation is observed following estrogen stimulation at both the 1 h and 2 h time points and the signal gradually declines following longer incubations (Fig. 1C). To demonstrate binding specificity to this putative ERE, recombinant ERα protein was used because ERα forms transcriptional complexes [23], which have the potential to mask epitopes in supershift assays. When incubated with radiolabeled probes containing the STAT1 ERE sequences identified above, dose dependent enhancement of DNA-protein complex formation is observed (Fig. 1D).
3.3 Estrogen stimulation of STAT1 expression occurs via ERα
To evaluate the induction of STAT1 expression in hematopoietically derived cell lines with estrogen treatment, THP-1 and K562 cells were stimulated with estrogen for 24 h. Relative to untreated cells, estrogen significantly upregulated STAT1 mRNA transcript expression in THP-1 and K562 cells 1.7-fold (p < 0.01) and 1.25-fold (p < 0.01), respectively (Fig. 2A). Using separate treatments of prolactin, progesterone, dihydrotestosterone, or estrogen, the induction of STAT1 expression in THP-1 cells was further analyzed. Our results show that hormonal influence was only observed with estrogen treatment when normalized to untreated cells; here, statistically significant (p < 0.01) induction of STAT1 transcript expression was observed as early as 6 h and continued to remain elevated over 2-fold up to the 24 h time point (Fig. 2B).
Fig. 2. Hormonal regulation of STAT1 expression is specific to estrogen and mediated through estrogen receptor (ER)α.

(A) Relative fold change in STAT1 mRNA expression in human hematopoietically derived cell lines K562 and THP-1 after 48 h estrogen (E2; 10 nM) stimulation compared to untreated (media) controls. (B) Fold change in STAT1 transcript expression in K562 cells over time following treatment with prolactin (PLC), progesterone (PGN), dihydrotestosterone (DHT), or E2 relative to baseline levels. (C-D) THP-1 cells were treated with E2 and transfected with siRNA targeting ERα to measure (C) ERα or (D) STAT1 expression by qPCR. Results are expressed as fold changes relative to nonsense (siScramble) controls. Representative results from experiments run in triplicate are shown. * p ≤ 0.05.
To confirm that estrogen-stimulated STAT1 expression occurs via ERα, siRNA constructs were transfected into THP-1 cells to block the production of ERα (siERα). As expected, relative to non-sense control siRNA treatment (siScramble), siERα significantly suppressed ERα transcript expression in a transient manner over multiple time points in the presence of estrogen (Fig. 2C). The kinetics of the siRNA knockdown are correlative with mathematical modeling considering the cells and conditions used here [24]. Additionally, knockdown of ERα also transiently inhibited estrogen-mediated induction of STAT1 expression. While STAT1 mRNA transcripts were reduced 33% (p < 0.02) following 24 h estrogen stimulation and 51% at 48 h (p < 0.002), no observable difference was detected at 72 h (Fig. 2D).
3.4 STAT1 is overexpressed in SLE and activated with estrogen stimulation
To investigate estrogen regulation of STAT1 expression in primary cells, freshly isolated PBMCs from healthy volunteers or SLE patients were treated with estrogen. While estrogen induced STAT1 mRNA transcript expression 1.2-fold (p < 0.003) in healthy subjects, this response was upregulated 1.4-fold (p < 0.01) in SLE PBMCs (Fig. 3A). Western blotting of whole cell lysates taken from these cells not only confirmed STAT1 upregulation with estrogen treatment at the protein level 1.46-fold in healthy controls and 1.35-fold in SLE, but also demonstrated enhanced phosphorylation to its activated form (p-STAT1; Fig. 3B). Interestingly, the quantitation of p-STAT1 levels showed no activation in healthy controls, but a 2-fold enhancement in PBMCs derived from SLE patients (Fig. 3B).
Fig. 3. Estrogen stimulates STAT1 expression in primary human cells and is upregulated in SLE.
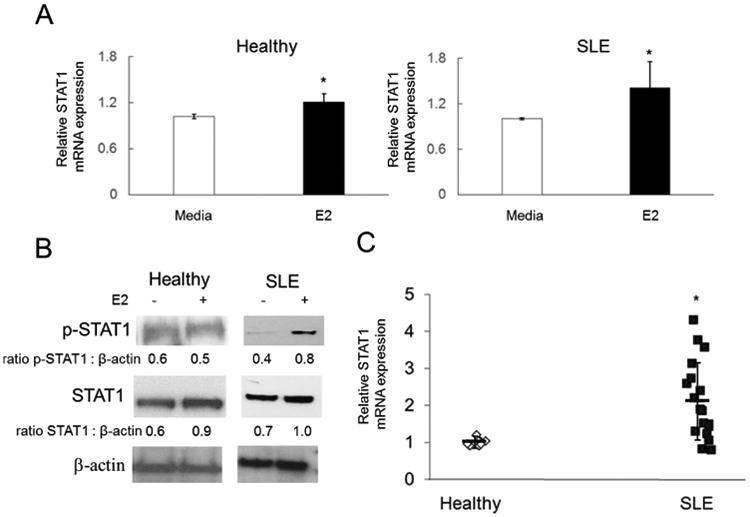
(A-B) PBMCs were stimulated with estrogen (E2; 10nM) for 48 h. (A) Fold change in STAT1 mRNA expression with E2 treatment relative to untreated (media) controls from SLE patients (n = 10) or healthy controls (n = 10). (B) Western blot of total cell lysates from SLE patients (n = 3) or healthy controls (n = 3). (C) RNA was isolated from whole blood samples of SLE patients (n = 20) and healthy controls (n = 10) to measure the relative fold change in STAT1 transcript expression. Reproducible results demonstrated in triplicate. Representative experiments are shown. * p ≤ 0.05.
To evaluate the relationship between STAT1 expression and disease, publicly available gene chip data sets from GEO accession: GSE11909 [25], including 156 SLE patients and 19 healthy controls were compared using Ingenuity software. Results from gene array analysis show that STAT1 expression is elevated 1.75-fold (p < 0.002) in SLE patients relative to healthy controls (Supplemental Table 1). In concordance, RNA isolated from whole blood of SLE patients also displayed significant enhancement of STAT1 transcript expression (2.14-fold; p < 0.02) relative to age and sex-matched healthy controls (Fig. 3C).
3.5 Estrogen induces STAT1 transcriptional activity proximal to TLR8
Since estrogen stimulation has been shown to enhance DNA binding of STAT1 in mouse splenocytes [26], we examined the possibility of estrogen-mediated induction of STAT1 transcriptional activity in human cells. The promotion of TLR8 expression via STAT1 transcriptional activation was specifically examined in this regard because i) our previous observation showing enhanced TLR8 expression with estrogen treatment [6] and ii) recent studies identifying a bona fide STAT1 binding region located 24 kb from the 3′ end of the TLR8 gene following treatment with a synthetic agonist (R-848) [18]. Using radio-labeled probes containing the sequences of this previously established STAT1 transcriptional binding site, THP-1 cells were stimulated with estrogen and EMSA was performed on nuclear extracts at various time points. While no DNA-protein complexes were observed at time zero, enhancement of complex formation was observed over time (Fig. 4A). Furthermore, when compared directly to untreated cells at the time points of 1 h, 2 h, and 4 h, E2 treatment also enhanced DNA-protein complexes in THP-1 cells (Fig. 4B).
Fig. 4. Estrogen-mediated induction of STAT1 regulates TLR8 expression by direct transcriptional activation.

THP-1 cells were stimulated with estrogen (E2; 10nM). (A-B) EMS A analysis of nuclear lysates from THP-1 cells with or without E2 treatment for the indicated time. Lysates were incubated with 32P-labeled probes corresponding to a bona fide STAT1 binding region 24 kb from the 3′ end of the of the TLR8 genetic locus. (C) Fold change in TLR8 mRNA expression following siRNA (siScramble) transfection relative to untreated (media) controls. (D-E) Fold change in (D) STAT1 or (E) TLR8 transcript expression using siRNA targeting STAT1 (siSTAT 1) relative to nonsense siRNA control (siScramble). (F) Western blot of total cell lysates with or without E2 treatment and siRNA-mediated knock down of STAT1 or ERα. Representative experiments are shown from experiments performed in triplicate. * p < 0.05.
3.6 Both ERα and STAT1 are required for estrogen-mediated upregulation of TLR8 expression
To demonstrate that both ERα and STAT1 are necessary for estrogen-induced of TLR8 expression, siRNAs targeting STAT1 and ERα were transfected into THP-1 cells that were treated with estrogen. As a negative control, non-sense siRNA (siScramble) was used, which did not inhibit the estrogen-induced expression of TLR8 in THP-1 cells; here, estrogen still up-regulated TLR8 transcripts by 1.35-fold (p < 0.05; Figure 4C). To confirm that siRNA blocking STAT1 (siSTAT1) significantly inhibited its expression in THP-1 cells, STAT1 expression was measured over time. Relative to siScramble-transfected cells, siSTAT1 transiently suppressed STAT1 expression with estrogen treatment according to the predicted kinetics under these conditions [24] (Fig. 4D). With STAT1 expression suppressed in THP-1 cells, estrogen-mediated TLR8 expression was also significantly inhibited. Relative to siScramble controls, detection of TLR8 transcripts showed a reduction of 38% at 24 h (p < 0.05), 49% at 48 h (p < 0.02), and 21% at 72 h following estrogen stimulation (Fig. 4E). To demonstrate this effect at the protein level, whole cell lysates were collected from estrogen-treated THP-1 cells. Both un-transfected and negative controls (siScramble) displayed enhanced TLR8 expression with estrogen stimulation by 1.38 and 1.33-fold, respectively (Fig. 4F). However, siRNA targeting either STAT1 or ERα suppressed this response back to untreated control levels (Fig. 4F).
3.7 miR-21 stimulates TLR8 activation
In the absence of TLR8 activation, estrogen-mediated upregulation would be inconsequential and without downstream signal transduction. In lieu of ssRNA of viral origin, recent studies have shown that miR-21 can also function as an endogenous agonist for TLR8 to promote carcinogenesis by being packaged and secreted in EVs [9]. Since this signaling pathway utilizes miRs that are packaged in EVs, synthetically produced vesicles (pseudoexosomes) were designed by encapsulating ssRNA conjugated to cyanine (Cy)3 in liposomes. Following 6 h incubation with THP-1 cells, these small vesicles containing miR-21 or nonsense control (miR-control) can be visualized using fluorescence microscopy in the medium and in close proximity to cells (Figure 5A). Subsequently, TLR8 expression and cytokine activation were examined to characterize the downstream effects of vesicle-encapsulated miR-21 signaling in macrophages. Expression of TLR8 was measured specifically because we have previously demonstrated that treatment of hematopoetic cell lines and primary PBMCs with synthetic agonist (R-848) results in significantly enhanced expression [6]. After 24 h, stimulation of THP-1 cells with miR-21 pseudoexosomes or R-848 significantly induced transcript expression of TLR8 by 1.4-fold (p < 0.05) and 1.5-fold (p < 0.05) relative to treatment with miR-control pseudoexosomes, respectively (Fig. 5B). To demonstrate a direct association with TLR8 signaling in this response, THP-1 cells were stimulated with liposome encapsulated miR-21 and treated with a protein inhibitor for myeloid differentiation primary response gene (MyD)88, which is an adaptor molecule that interacts with TLR8 immediately downstream [27]. Compared to treatment with control peptide, TLR8 mRNA expression levels were reduced by 58% (p < 0.001) with MyD88 inhibition (Fig. 5B).
Fig. 5. miR-21 stimulation induces TLR8 expression and cytokine production.
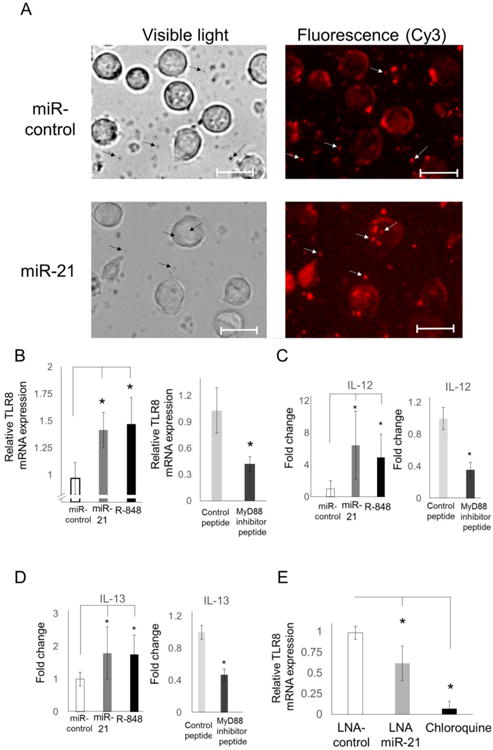
(A) Liposome-encapsulated miR-21 or a nonsense control sequence (miR-control) containing a Cy3 fluorescent label conjugate was incubated with THP-1 cells and visualized using fluorescent microscopy. Arrows highlight Cy-3 detection within liposomal vesicles; scale bar = 25 μ m. Fold change in (B) TLR8 expression and cytokine secretion of (C) IL-12 or (D) IL-13 in THP-1 cells following stimulation with miR-control and miR-21 in liposomal complexes, TLR8 agonist (R-848), miR-21 liposomes + control peptide, or miR-21 liposomes + MyD88 inhibitor peptide. (E) Primary human macrophages were isolated from healthy blood samples, stimulated with autologous serum, and treated with chemically modified, locked nucleic acid (LNA) sequences of control miR and anti-miR-21, or with chloroquine. Results representative of duplicated experiments. * p < 0.05.
According to previous studies, agonist-mediated TLR8 signaling leads to the production of IL-12 and IL-13 [28, 29]. Therefore, the secretion of these cytokines was analyzed in THP-1 cells by ELISA following stimulation with either miR-21 pseudoexosomes or R-848. IL-12 expression was induced 6.4-fold (p < 0.02) by miR-21 and 5-fold (p < 0.05) by R-848 compared to control treatment (Fig. 5C). Furthermore, inhibition of MyD88 led to a 64% (p < 0.02) reduction in miR-21-induced IL-12 expression (Fig. 5C). Additionally, miR-21 and R-848 treatment upregulated IL-13 expression 1.8-fold (p < 0.05) and 1.75-fold (p < 0.05) relative to cells treated with miR-control pseudoexosomes, respectively (Figure 5D). However, when THP-1 cells were stimulated with miR-21-contining vesicles and treated with MyD88 inhibitor, IL-13 secretion was reduced by 29% (p < 0.001; Fig. 5D).
To examine the effects of EV-derived miR-21 in primary cells, EVs were isolated from pre-menopausal SLE patients and age/sex-matched healthy female controls. In addition, miR-21 expression levels were also measured from whole blood samples. miR-21 was detected in both analyses and the expression did not change significantly in SLE patients relative to healthy controls after normalization to total RNA (Supplemental Fig. 2). To determine the effect of antagonizing miR-21, primary human macrophages derived from healthy donors were treated with liposomal complexes containing locked nucleic acid (LNA) sequences designed to block miR-21 (LNA antagomiR-21). LNAs are RNA nucleotides containing a modified ribose moiety and were used to antagonize miR functionality here because they are significantly more resistant to enzymatic degradation than RNA [30]. Cells were incubated with autologous serum as an endogenous source of EV-derived miR-21 for 24 h. Relative to nonsense control treatment (LNA-control), inhibition of miR-21 with LNA antagomiR-21 reduced the expression of TLR8 mRNA by 46% (p < 0.05; Fig. 5E).
While antimalarial drugs, including chloroquine, have been used to treat patients with SLE for over 70 years, the mechanism of action has never been fully understood. Recent evidence suggests that chloroquine is not functioning by altering endosomal pH to prevent intracellular TLR activation as previously hypothesized, but rather is binding to nucleic acids directly to mask antigenic epitopes [31]. To assess the effectiveness of chloroquine in suppressing TLR8 expression induced by EV-derived miRs in autologous serum, transcript levels were measured in primary human macrophages following 24 h incubation. Chloroquine treatment resulted in a reduction of TLR8 expression by over 95% (p < 0.005) compared to the LNA-control condition (Fig. 5E).
3.8 miR-21 stimulates extracellular vesicle secretion
Given the newfound cell-to-cell communication and signaling functionality of EVs by delivering RNA to recipient cells, we examined the extracellular fractions isolated from blood of SLE patients to determine the precise localization of small RNA sequences. Following EV isolation and total RNA purification procedures allowing for efficient recovery of small RNA (< 200 nt) species, samples were analyzed by nanofluidics to measure RNA quantity, size, and integrity. While the micro (0 – 40 nt) and small (0 – 325 nt) RNA recovered from non-EV extracellular fractions was almost undetectable (maximum of 4.8 pg/μL), that which was found in the EV fraction was approximately 20 times greater (90 pg/μL) (Fig. 6A). To ensure that the non-EV RNA fractions were not degraded or lost during experimental processing, samples were supplemented (spike) with cellular RNA isolated with the same protocol and recovery was confirmed (Fig. 6B). Furthermore, the RNA recovered from the EV fraction was not degraded, as demonstrated by distinct bands on the electrophoretic gel image (Fig. 6C).
Fig. 6. Extracellular miRs are detected primarily within vesicles and liposome encapsulated miR-21 stimulation induces extracellular vesicle (EV) secretion.

(A-C) EV and non-EV fractions were isolated from blood of SLE patients. RNA size and concentration was measured on the Bioanalyzer system. (B) RNA concentrations of microRNA (miR; 0-40 nt) and small RNA (0-325 nt). Purified intracellular RNA isolated from cells was added to the non-EV fraction as a control (non-EV spike). (C) Digital electrophoretic gel image of purified RNA. (D) Extracellular particle profiles and images recorded by nanoparticle tracking analysis from conditioned media collected from THP-1 cells treated with miR control and miR-21 liposomal vesicles or R-848. (E) Area under the curve (0 - 160nm) calculations from (D) made using the linear trapezoidal method. Results duplicated in individual expriments. * p < 0.05.
The key role that EVs may play in regulating inflammation through the delivery of bioactive molecular cargo has only recently been proposed in the past decade. Furthermore, although exosome biogenesis originates from intracellular endosomes, which is the precise cellular localization of all nucleic acid-binding TLRs (TLR3, TLR7, TLR8, and TLR9), the effect of TLR activation on EV production has yet to be investigated. THP-1 cells were treated with miR-21 pseudoexosomes or R-848 and extracellular particle profiles (EPPs) were measured using NTA to quantitate EV production. Relative to treatment with miR-control, stimulation by miR-21 and R-848 significantly induced particles ranging from 0-160 nm in diameter (Fig. 6D). Specifically, the cumulative EPPs resulting from miR-21 and R-848 induction were increased by 2.0-fold (p < 0.05) and 3.7-fold (p < 0.01), respectively (Fig. 6E).
4. Discussion
Epidemiological data shows that the incidence of SLE peaks in females when levels of estrogen are highest. Specifically, disease predilection for women is nine times higher in pre-menopausal females when compared to age-matched males, but drops significantly during pre-adolescence or post-menopause [32, 33]. Consequently, it has been suggested that hormones, particularly estrogen, may be one of the contributing factors leading to disease pathogenesis [34].
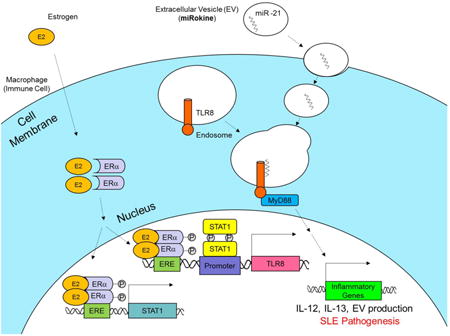
While our previous studies have demonstrated that estrogen can induce TLR8 upregulation through ERα and identified a novel ERE proximal to the TLR8 genetic locus [6], here we provide a more comprehensive mechanistic understanding through an association with STAT1 expression and transcriptional activity. In our proposed model of TLR8 activation and signaling in SLE, estrogen (E2) enters the cell and binds to estrogen receptor ERα. The resulting dimers translocate to the nucleus and promote either STAT1 or TLR8 expression by transcriptional activation through ERE binding. STAT1 expression and activation by estrogen leads to transcriptional activation of TLR8 expression, which can be triggered by an endogenously-derived and EV-encapsulated miR-21 ligand. While the conventional role of miRs is to function as a complimentary sequence targeting specific cytoplasmic mRNAs to neutralize expression, the signaling pathway through TLR8 activation represents a non-conventional role for miRs to function within cells. TLR8-mediated signal transduction through the MyD88 pathway can ultimately result in production of EVs and enhanced expression of IL-12, IL-13, and other inflammatory genes that may function to promote SLE pathogenesis (graphical abstract). Thus, intracellular miRs are packaged and secreted in EVs to facilitate autocrine or paracrine immunomodulatory responses through communication as extracellular mediators. Considering the evolution of nomenclature following the discovery and characterization of cytokines, which resulted in the establishment of terminology including chemokines, myokines, and adipokines, we propose using the term miRokine to describe this signaling process. In this manner, EV-derived miRs can function as secreted inflammatory mediators, or miRokines, to signal between cells.
While the biogenesis and secretion of EVs was characterized nearly 30 years ago [35], packaging and secretion of miRs in EVs to induce changes in recipient cells has only been described in the last decade [36]. Aside from being contained within EVs, extracellular RNA can presumably exist freely or can be bound into ribonucleoprotein complexes. EVs and chaperone proteins offer protection against enzymatic degradation, which is critical to extracellular stability considering that free RNA is completely degraded within minutes due to the high level of ribonuclease activity physiologically [37]. Results from primary human samples have been contradictory in demonstrating whether extracellular miRs are found in greatest abundance in EVs [38] or associated with proteins outside of EVs [39], but this may be attributable to the methodology of EV isolation, disease state, and the limitations associated with analyzing only specific RNA sequences in these studies. Here, we isolated EVs from human SLE samples and investigated the total recovery of all small RNA sequences (0 – 325 nt). While RNA was also detected in the non-EV fraction, the greatest recovery was observed to be EV-associated. In concordance with our results, treatment with lipid destabilizing detergents has previously shown a significantly reduced detection of miRs from conditioned media of THP-1 cells [40] and RNA from human plasma samples [41]. In addition to miRs, the small RNA sequences detected in this study include long non-coding (ln)RNA, which also has the potential to epigenetically regulate gene expression and represents an intriguing area of future investigation that may provide an association with SLE. Since RNA sequencing data has shown the selective sorting of a variety of RNA species (mRNA, miR, and lnRNA) into EVs [42, 43], the future profiling and characterization of these RNA signatures could provide valuable therapeutic targets or identify biomarkers of inflammation in SLE.
In addition to regulating the expression of many genes, estrogen also has the potential to transcriptionally modulate miR production [44, 45]. Interestingly, of the many miRs observed to be induced by estrogen in the study by Bhat-Nakshatri et al., miR-21 was up-regulated 2-fold. Our results demonstrate that treatment with liposomal encapsulated miR-21 significantly stimulated IL-12, IL-13, and TLR8 expression and that this was suppressed with MyD88 inhibition, which suggests a direction association with the TLR8-mediated signaling pathway. Considering that levels of IL-12 and IL-13 are elevated in SLE patient serum [46] and have been associated with disease activity [47, 48], these data indicate that this could be a consequence of EV-encapsulated miR-21 activation of TLR8 signaling. Therefore, the pleotropic effects of estrogen could promote immune activation both by upregulating TLR8 and the in vivo-generated ligand. Considering the strong association of dysregulated miR expression in SLE [11] and that miR-21 deficiency has been shown to protect from lupus-like autoimmunity in a mouse model [49], targeting miR-21 and any additional miRs potentially functioning as TLR ligands represents a novel therapeutic strategy to suppress inflammation in SLE.
Antimalarial drugs have been shown to reduce disease activity and have been used routinely to treat SLE for over half a century, but the mechanism of action has yet to be conclusively elucidated [50]. Suppression of TLR activation by chloroquine was initially attributed to the inhibition of endosome acidification [51], but recent data demonstrates that endosomal TLR activation was inhibited by chloroquine through the direct binding of nucleic acids within endosomal compartments [31]. Our data shows that while suppression of TLR8 expression was observed with chloroquine or a miR-21 antagonist, chloroquine significantly reduced TLR8 expression to a much greater extent than by blocking miR-21 alone. Collectively, these data suggest that chloroquine may be binding to miRs to prevent TLR8 induction within endosomal compartments and that multiple miRs are most likely capable of TLR8 activation in this system. To suppress the effect of miR-21, a miR antagonist was designed with a modified LNA backbone, which enhances resistance to degradation when compared to RNA and has been shown to persist in vivo for over a week [30]. Our future investigations will be directed toward the identification of additional EV-derived miR agonists for TLR8 that are associated with SLE and the therapeutic development of LNA-based antagonists to block miR-induced inflammatory responses in vivo using SLE animal models.
Supplementary Material
Supplemental Figure 1. GenePattern analysis combining the effects of PBMC stimulation with estrogen in both healthy and SLE samples reveals unique regulation patterns. Primary PBMCs were stimulated with estrogen (E2; 10 nM) for 48 h. RNA was isolated and gene arrays were analyzed using GenePattern software. Plots are representative of the fold change in expression with E2 treatment in healthy samples (x-axis) vs. that of SLE patients (y-axis). (A) Unique genes significantly (p < 0.05) up (green) and down (pink) regulated with E2 treatment in healthy PBMCs. (B) Unique genes significantly (p < 0.05) up (green) and down (pink) regulated with E2 treatment in SLE PBMCs. Red lines indicate a 2-fold change in expression.
Supplemental Figure 2. Expression of miR-21 does not change significantly in cells or extracellular vesicles (EV) in SLE. Blood was collected from SLE patients (n = 8) and healthy controls (n = 8) into PaxGene tubes for analysis of miR-21 expression in whole blood by qPCR (left). EVs were isolated from SLE (n = 10) and healthy (n = 10) serum samples for RNA purification and qPCR analysis of miR-21 expression (right). ns = not significant.
Supplemental Table 1. Analysis of publicly available gene chip data sets for SLE (n = 156) and healthy subjects (n = 19) from GEO accession: GSE11909. Genes up-regulated in SLE patients at least 1.5-fold and with a p < 0.01 are listed from highest to lowest fold change values. STAT1 values are indicated in bold print.
Highlights.
Estrogen induces STAT1 transcription of TLR8; both genes are overexpressed in lupus
microRNA-21 in liposomes induces TLR8 signaling and extracellular vesicle secretion
Extracellular microRNAs (miRs) are predominately contained within vesicles
Antagonizing miR-21 inhibits TLR8 activation in primary human macrophages
Thus, this study identifies a novel inflammatory pathway to target in lupus
Acknowledgments
We would like to extend our gratitude to the Clinical Research Center and the Research Match Program through CCTS at OSUWMC as well as the volunteers that participated in this study. We also thank Steffi Bösh from Université de Nantes, Immuno-endocrinologie Cellulaire et Moléculaire, and Matthew Young of the Inflammation Foundation for their encouraging support and critical review of this study. Funding provided through OSUWMC, R00-ES019918 from the NIH, and the CCTS is supported by UL1TR001070 from the National Center for Advancing Translational Science. Wael Jarjour is also supported by funding through the Lupus Research Alliance.
Footnotes
Publisher's Disclaimer: This is a PDF file of an unedited manuscript that has been accepted for publication. As a service to our customers we are providing this early version of the manuscript. The manuscript will undergo copyediting, typesetting, and review of the resulting proof before it is published in its final citable form. Please note that during the production process errors may be discovered which could affect the content, and all legal disclaimers that apply to the journal pertain.
References
- 1.Kumar V, et al. Functional domains of the human estrogen receptor. Cell. 1987;51(6):941–51. doi: 10.1016/0092-8674(87)90581-2. [DOI] [PubMed] [Google Scholar]
- 2.Welboren WJ, et al. Identifying estrogen receptor target genes. Mol Oncol. 2007;1(2):138–43. doi: 10.1016/j.molonc.2007.04.001. [DOI] [PMC free article] [PubMed] [Google Scholar]
- 3.Svenson JL, et al. Impact of estrogen receptor deficiency on disease expression in the NZM2410 lupus prone mouse. Clin Immunol. 2008;128(2):259–68. doi: 10.1016/j.clim.2008.03.508. [DOI] [PMC free article] [PubMed] [Google Scholar]
- 4.Cunningham MA, et al. Estrogen receptor alpha modulates Toll-like receptor signaling in murine lupus. Clin Immunol. 2012;144(1):1–12. doi: 10.1016/j.clim.2012.04.001. [DOI] [PMC free article] [PubMed] [Google Scholar]
- 5.Feng F, et al. The induction of the lupus phenotype by estrogen is via an estrogen receptor-alpha-dependent pathway. Clin Immunol. 2010;134(2):226–36. doi: 10.1016/j.clim.2009.10.004. [DOI] [PubMed] [Google Scholar]
- 6.Young NA, et al. Estrogen modulation of endosome-associated toll-like receptor 8: an IFNalpha-independent mechanism of sex-bias in systemic lupus erythematosus. Clin Immunol. 2014;151(1):66–77. doi: 10.1016/j.clim.2014.01.006. [DOI] [PMC free article] [PubMed] [Google Scholar]
- 7.Zarember KA, Godowski PJ. Tissue expression of human Toll-like receptors and differential regulation of Toll-like receptor mRNAs in leukocytes in response to microbes, their products, and cytokines. J Immunol. 2002;168(2):554–61. doi: 10.4049/jimmunol.168.2.554. [DOI] [PubMed] [Google Scholar]
- 8.Aringer M, Gunther C, Lee-Kirsch MA. Innate immune processes in lupus erythematosus. Clin Immunol. 2013;147(3):216–22. doi: 10.1016/j.clim.2012.11.012. [DOI] [PubMed] [Google Scholar]
- 9.Fabbri M, et al. MicroRNAs bind to Toll-like receptors to induce prometastatic inflammatory response. Proc Natl Acad Sci U S A. 2012;109(31):E2110–6. doi: 10.1073/pnas.1209414109. [DOI] [PMC free article] [PubMed] [Google Scholar]
- 10.Carlsen AL, et al. Circulating microRNA expression profiles associated with systemic lupus erythematosus. Arthritis Rheum. 2013;65(5):1324–34. doi: 10.1002/art.37890. [DOI] [PMC free article] [PubMed] [Google Scholar]
- 11.Amarilyo G, La Cava A. miRNA in systemic lupus erythematosus. Clin Immunol. 2012;144(1):26–31. doi: 10.1016/j.clim.2012.04.005. [DOI] [PubMed] [Google Scholar]
- 12.Hochberg MC. Updating the American College of Rheumatology revised criteria for the classification of systemic lupus erythematosus. Arthritis Rheum. 1997;40(9):1725. doi: 10.1002/art.1780400928. [DOI] [PubMed] [Google Scholar]
- 13.Jablonski KA, et al. Novel Markers to Delineate Murine M1 and M2 Macrophages. PLoS One. 2015;10(12):e0145342. doi: 10.1371/journal.pone.0145342. [DOI] [PMC free article] [PubMed] [Google Scholar]
- 14.Young NA, et al. Novel estrogen target gene ZAS3 is overexpressed in systemic lupus erythematosus. Mol Immunol. 2013;54(1):23–31. doi: 10.1016/j.molimm.2012.10.026. [DOI] [PMC free article] [PubMed] [Google Scholar]
- 15.Burd CJ, et al. Analysis of chromatin dynamics during glucocorticoid receptor activation. Mol Cell Biol. 32(10):1805–17. doi: 10.1128/MCB.06206-11. [DOI] [PMC free article] [PubMed] [Google Scholar]
- 16.Heinz S, et al. Simple combinations of lineage-determining transcription factors prime cis-regulatory elements required for macrophage and B cell identities. Mol Cell. 38(4):576–89. doi: 10.1016/j.molcel.2010.05.004. [DOI] [PMC free article] [PubMed] [Google Scholar]
- 17.Robinson JT, et al. Integrative genomics viewer. Nat Biotechnol. 29(1):24–6. doi: 10.1038/nbt.1754. [DOI] [PMC free article] [PubMed] [Google Scholar]
- 18.Zannetti C, et al. C/EBP{delta} and STAT-1 are required for TLR8 transcriptional activity. J Biol Chem. 2010;285(45):34773–80. doi: 10.1074/jbc.M110.133884. [DOI] [PMC free article] [PubMed] [Google Scholar]
- 19.Kasperkovitz PV, et al. Activation of the STAT1 pathway in rheumatoid arthritis. Ann Rheum Dis. 2004;63(3):233–9. doi: 10.1136/ard.2003.013276. [DOI] [PMC free article] [PubMed] [Google Scholar]
- 20.Gysemans CA, et al. Disruption of the gamma-interferon signaling pathway at the level of signal transducer and activator of transcription-1 prevents immune destruction of beta-cells. Diabetes. 2005;54(8):2396–403. doi: 10.2337/diabetes.54.8.2396. [DOI] [PubMed] [Google Scholar]
- 21.Schreiber S, et al. Activation of signal transducer and activator of transcription (STAT) 1 in human chronic inflammatory bowel disease. Gut. 2002;51(3):379–85. doi: 10.1136/gut.51.3.379. [DOI] [PMC free article] [PubMed] [Google Scholar]
- 22.Dong J, et al. Activation of the STAT1 signalling pathway in lupus nephritis in MRL/lpr mice. Lupus. 2007;16(2):101–9. doi: 10.1177/0961203306075383. [DOI] [PubMed] [Google Scholar]
- 23.Klinge CM. Estrogen receptor interaction with estrogen response elements. Nucleic Acids Res. 2001;29(14):2905–19. doi: 10.1093/nar/29.14.2905. [DOI] [PMC free article] [PubMed] [Google Scholar]
- 24.Bartlett DW, Davis ME. Insights into the kinetics of siRNA-mediated gene silencing from live-cell and live-animal bioluminescent imaging. Nucleic Acids Res. 2006;34(1):322–33. doi: 10.1093/nar/gkj439. [DOI] [PMC free article] [PubMed] [Google Scholar]
- 25.Chaussabel D, et al. A modular analysis framework for blood genomics studies: application to systemic lupus erythematosus. Immunity. 2008;29(1):150–64. doi: 10.1016/j.immuni.2008.05.012. [DOI] [PMC free article] [PubMed] [Google Scholar]
- 26.Dai R, et al. Estrogen regulates transcription factors STAT-1 and NF-kappaB to promote inducible nitric oxide synthase and inflammatory responses. J Immunol. 2009;183(11):6998–7005. doi: 10.4049/jimmunol.0901737. [DOI] [PMC free article] [PubMed] [Google Scholar]
- 27.Akira S, Takeda K. Toll-like receptor signalling. Nat Rev Immunol. 2004;4(7):499–511. doi: 10.1038/nri1391. [DOI] [PubMed] [Google Scholar]
- 28.Ghosh TK, et al. Toll-like receptor (TLR) 2-9 agonists-induced cytokines and chemokines: I. Comparison with T cell receptor-induced responses. Cell Immunol. 2006;243(1):48–57. doi: 10.1016/j.cellimm.2006.12.002. [DOI] [PubMed] [Google Scholar]
- 29.Berger M, et al. TLR8-driven IL-12-dependent reciprocal and synergistic activation of NK cells and monocytes by immunostimulatory RNA. J Immunother. 2009;32(3):262–71. doi: 10.1097/CJI.0b013e318198bd2a. [DOI] [PubMed] [Google Scholar]
- 30.Laxton C, et al. Selection, optimization, and pharmacokinetic properties of a novel, potent antiviral locked nucleic acid-based antisense oligomer targeting hepatitis C virus internal ribosome entry site. Antimicrob Agents Chemother. 2011;55(7):3105–14. doi: 10.1128/AAC.00222-11. [DOI] [PMC free article] [PubMed] [Google Scholar]
- 31.Kuznik A, et al. Mechanism of endosomal TLR inhibition by antimalarial drugs and imidazoquinolines. J Immunol. 2011;186(8):4794–804. doi: 10.4049/jimmunol.1000702. [DOI] [PubMed] [Google Scholar]
- 32.Lockshin MD. Sex differences in autoimmune disease. Lupus. 2006;15(11):753–6. doi: 10.1177/0961203306069353. [DOI] [PubMed] [Google Scholar]
- 33.Tedeschi SK, Bermas B, Costenbader KH. Sexual disparities in the incidence and course of SLE and RA. Clin Immunol. 2013;149(2):211–8. doi: 10.1016/j.clim.2013.03.003. [DOI] [PubMed] [Google Scholar]
- 34.Yoachim SD, et al. Estrogen receptor alpha signaling promotes Sle1-induced loss of tolerance and immune cell activation and is responsible for sex bias in B6.Sle1 congenic mice. Clin Immunol. 2015;158(2):153–66. doi: 10.1016/j.clim.2015.03.026. [DOI] [PMC free article] [PubMed] [Google Scholar]
- 35.Johnstone RM, et al. Vesicle formation during reticulocyte maturation. Association of plasma membrane activities with released vesicles (exosomes) J Biol Chem. 1987;262(19):9412–20. [PubMed] [Google Scholar]
- 36.Valadi H, et al. Exosome-mediated transfer of mRNAs and microRNAs is a novel mechanism of genetic exchange between cells. Nat Cell Biol. 2007;9(6):654–9. doi: 10.1038/ncb1596. [DOI] [PubMed] [Google Scholar]
- 37.Mitchell PS, et al. Circulating microRNAs as stable blood-based markers for cancer detection. Proc Natl Acad Sci U S A. 2008;105(30):10513–8. doi: 10.1073/pnas.0804549105. [DOI] [PMC free article] [PubMed] [Google Scholar]
- 38.Gallo A, et al. The majority of microRNAs detectable in serum and saliva is concentrated in exosomes. PLoS One. 2012;7(3):e30679. doi: 10.1371/journal.pone.0030679. [DOI] [PMC free article] [PubMed] [Google Scholar]
- 39.Arroyo JD, et al. Argonaute2 complexes carry a population of circulating microRNAs independent of vesicles in human plasma. Proc Natl Acad Sci U S A. 2011;108(12):5003–8. doi: 10.1073/pnas.1019055108. [DOI] [PMC free article] [PubMed] [Google Scholar]
- 40.Zhang Y, et al. Secreted monocytic miR-150 enhances targeted endothelial cell migration. Mol Cell. 2010;39(1):133–44. doi: 10.1016/j.molcel.2010.06.010. [DOI] [PubMed] [Google Scholar]
- 41.El-Hefnawy T, et al. Characterization of amplifiable, circulating RNA in plasma and its potential as a tool for cancer diagnostics. Clin Chem. 2004;50(3):564–73. doi: 10.1373/clinchem.2003.028506. [DOI] [PubMed] [Google Scholar]
- 42.Guduric-Fuchs J, et al. Selective extracellular vesicle-mediated export of an overlapping set of microRNAs from multiple cell types. BMC Genomics. 2012;13:357. doi: 10.1186/1471-2164-13-357. [DOI] [PMC free article] [PubMed] [Google Scholar]
- 43.Nolte-'t Hoen EN, et al. Deep sequencing of RNA from immune cell-derived vesicles uncovers the selective incorporation of small non-coding RNA biotypes with potential regulatory functions. Nucleic Acids Res. 2012;40(18):9272–85. doi: 10.1093/nar/gks658. [DOI] [PMC free article] [PubMed] [Google Scholar]
- 44.Bhat-Nakshatri P, et al. Estradiol-regulated microRNAs control estradiol response in breast cancer cells. Nucleic Acids Res. 2009;37(14):4850–61. doi: 10.1093/nar/gkp500. [DOI] [PMC free article] [PubMed] [Google Scholar]
- 45.Di Leva G, et al. MicroRNA cluster 221-222 and estrogen receptor alpha interactions in breast cancer. J Natl Cancer Inst. 2010;102(10):706–21. doi: 10.1093/jnci/djq102. [DOI] [PMC free article] [PubMed] [Google Scholar]
- 46.Zhao M, et al. Hypomethylation of IL10 and IL13 promoters in CD4+ T cells of patients with systemic lupus erythematosus. J Biomed Biotechnol. 2010;2010:931018. doi: 10.1155/2010/931018. [DOI] [PMC free article] [PubMed] [Google Scholar]
- 47.Xu Z, Chen Y. Determination of serum interleukin-13 and nerve growth factor in patients with systemic lupus erythematosus and clinical significance. J Huazhong Univ Sci Technolog Med Sci. 2005;25(3):360–1. doi: 10.1007/BF02828168. [DOI] [PubMed] [Google Scholar]
- 48.Hagiwara E, et al. Disease severity in patients with systemic lupus erythematosus correlates with an increased ratio of interleukin-10:interferon-gamma-secreting cells in the peripheral blood. Arthritis Rheum. 1996;39(3):379–85. doi: 10.1002/art.1780390305. [DOI] [PubMed] [Google Scholar]
- 49.Garchow B, Kiriakidou M. MicroRNA-21 deficiency protects from lupus-like autoimmunity in the chronic graft-versus-host disease model of systemic lupus erythematosus. Clin Immunol. 2016;162:100–6. doi: 10.1016/j.clim.2015.11.010. [DOI] [PMC free article] [PubMed] [Google Scholar]
- 50.Rainsford KD, et al. Therapy and pharmacological properties of hydroxychloroquine and chloroquine in treatment of systemic lupus erythematosus, rheumatoid arthritis and related diseases. Inflammopharmacology. 2015;23(5):231–69. doi: 10.1007/s10787-015-0239-y. [DOI] [PubMed] [Google Scholar]
- 51.Hacker H, et al. CpG-DNA-specific activation of antigen-presenting cells requires stress kinase activity and is preceded by non-specific endocytosis and endosomal maturation. EMBO J. 1998;17(21):6230–40. doi: 10.1093/emboj/17.21.6230. [DOI] [PMC free article] [PubMed] [Google Scholar]
Associated Data
This section collects any data citations, data availability statements, or supplementary materials included in this article.
Supplementary Materials
Supplemental Figure 1. GenePattern analysis combining the effects of PBMC stimulation with estrogen in both healthy and SLE samples reveals unique regulation patterns. Primary PBMCs were stimulated with estrogen (E2; 10 nM) for 48 h. RNA was isolated and gene arrays were analyzed using GenePattern software. Plots are representative of the fold change in expression with E2 treatment in healthy samples (x-axis) vs. that of SLE patients (y-axis). (A) Unique genes significantly (p < 0.05) up (green) and down (pink) regulated with E2 treatment in healthy PBMCs. (B) Unique genes significantly (p < 0.05) up (green) and down (pink) regulated with E2 treatment in SLE PBMCs. Red lines indicate a 2-fold change in expression.
Supplemental Figure 2. Expression of miR-21 does not change significantly in cells or extracellular vesicles (EV) in SLE. Blood was collected from SLE patients (n = 8) and healthy controls (n = 8) into PaxGene tubes for analysis of miR-21 expression in whole blood by qPCR (left). EVs were isolated from SLE (n = 10) and healthy (n = 10) serum samples for RNA purification and qPCR analysis of miR-21 expression (right). ns = not significant.
Supplemental Table 1. Analysis of publicly available gene chip data sets for SLE (n = 156) and healthy subjects (n = 19) from GEO accession: GSE11909. Genes up-regulated in SLE patients at least 1.5-fold and with a p < 0.01 are listed from highest to lowest fold change values. STAT1 values are indicated in bold print.