Abstract
The processes that lead to changes in the propagation and maintenance of the Madden‐Julian Oscillation (MJO) as a response to increasing CO2 are examined by analyzing moist static energy budget of the MJO in a series of NASA GISS model simulations. It is found changes in MJO propagation is dominated by several key processes. Horizontal moisture advection, a key process for MJO propagation, is found to enhance predominantly due to an increase in the mean horizontal moisture gradients. The terms that determine the strength of the advecting wind anomalies, the MJO horizontal scale and the dry static stability, are found to exhibit opposing trends that largely cancel out. Furthermore, reduced sensitivity of precipitation to changes in column moisture, i.e., a lengthening in the convective moisture adjustment time scale, also opposes enhanced propagation. The dispersion relationship of Adames and Kim, which accounts for all these processes, predicts an acceleration of the MJO at a rate of ∼3.5% K−1, which is consistent with the actual phase speed changes in the simulation. For the processes that contribute to MJO maintenance, it is found that damping by vertical MSE advection is reduced due to the increasing vertical moisture gradient. This weaker damping is nearly canceled by weaker maintenance by cloud‐radiative feedbacks, yielding the growth rate from the linear moisture mode theory nearly unchanged with the warming. Furthermore, the estimated growth rates are found to be a small, negative values, suggesting that the MJO in the simulation is a weakly damped mode.
Keywords: Madden‐Julian Oscillation, tropical convection, climate change, moist static energy
Key Points
The moisture mode framework of Adames and Kim is used to understand the MJO's response to increasing CO2 in the GISS GCM
The moisture mode framework successfully predicts the rate of MJO's phase speed increase with the warming
The acceleration of the MJO in a warmer climate is due to the changes in the mean state, moisture‐convection coupling, and the MJO's scale
1. Introduction
The Madden‐Julian Oscillation (Madden & Julian, 1971, 1972) dominates tropical rainfall variability at the intraseasonal (30–90 day) time scale (Lau & Waliser, 2011; Zhang, 2005). It is characterized by a large‐scale envelope of deep convection several thousand kilometers across which propagates eastward at ∼5 m s−1. The convective anomalies are coupled to planetary‐scale circulation features which modulate weather patterns across the globe (Zhang, 2013, and references therein). Furthermore, the structure and propagation of the MJO, and the character of its global impacts are in turn modulated by low‐frequency, background state (Jones & Carvalho, 2011), including the magnitude and spatial distribution of sea surface temperature, moisture, and winds (Arnold et al., 2013; Jones & Carvalho, 2011; Wolding et al., 2017). While the impact, the MJO has on global weather is well documented, many questions remain on how the MJO's properties are controlled by the climatological environment.
The Earth's surface temperature has exhibited a positive long‐term trend since the industrial revolution mainly due to increasing anthropogenic greenhouse gases, and it is likely that this greenhouse gas‐induced global warming will continue in the 21st century (IPCC, 2013). Given the global impacts, the MJO has understanding the likely changes in the MJO as a response to greenhouse gas‐induced global warming is of great importance.
Global climate models (GCMs) are primary tools in this endeavor. GCMs with various degrees of MJO simulation fidelity have been used to examine the response of the MJO to warming. While an accurate simulation of the MJO is a challenging task for many contemporary GCMs (Ahn et al., 2017; Jiang et al., 2015), many of these modeling studies have suggested an amplification of MJO variability and an increase in the frequency of the MJO in a warmer climate (Arnold et al., 2015, 2013; Carlson & Caballero, 2016; Chang et al., 2015; Liu, 2013; Liu et al., 2013; Song & Seo, 2016; Subramanian et al., 2014; Pritchard & Yang, 2016). With an atmosphere‐only GCM, Arnold et al. (2013) found MJO variability more than tripled as a response to an imposed 9°C SST increase. Using a coupled GCM, Chang et al. (2015) found that the period of the MJO changes from ∼50 days in a 20th century simulation to ∼30 days in a 21st.
The goal of the current study is to examine and understand the changes in the MJO associated with the greenhouse gas‐induced warming represented in the NASA GISS GCM. In a companion study (Adames et al., 2017), we examined a set of simulations conducted with the NASA GISS GCM by varying CO2 concentration from 0.5 to 4 times the preindustrial level. It was found that the MJO exhibits faster eastward propagation, a larger zonal scale and deeper moisture anomalies in warmer climates. These changes are generally consistent with those obtained in many previous studies, suggesting that understanding the changes represented in the NASA GISS GCM may be relevant to interpretations of previous studies.
In this study, we seek to understand the changes in the MJO documented in Adames et al. (2017) by using the moisture mode theoretical framework of the MJO (e.g., Adames & Kim, 2016; Raymond, 2001; Raymond & Fuchs, 2009; Sobel & Maloney, 2012, 2013). This view, in which the propagation and maintenance of convective anomalies associated with the MJO are explained by those of column moisture, has stimulated analysis of column moisture or moist static energy (MSE) budget of the MJO in reanalysis and GCM simulations. The results of those budget analyses have provided useful insights into the propagation and maintenance mechanism of the MJO, which in turn provided a ground for theoretical models for the MJO (Adames & Kim, 2016; Sobel & Maloney, 2012, 2013).
Specifically, we aim at identifying parameters whose changes accompanied by the greenhouse gas‐induced warming are tightly related with the changes in the MJO characteristics. To do this, we make use of the dispersion relationship for the MJO derived in Adames and Kim (2016) (from here on referred to as AK16) as a framework for our examination. According to AK16, the phase speed, group velocity, and growth rate of the MJO are determined by a set of key parameters: the convective adjustment time scale (Bretherton et al., 2004), the moisture advection parameter, the normalized gross moist stability (Raymond & Fuchs, 2009), and the greenhouse enhancement factor (Kim et al., 2015). The moisture advection parameter defined in AK16 is proportional to the horizontal and vertical gradients of background moisture distribution and the magnitude of wind anomalies field per unit heating anomaly.
While it is demonstrated by AK16 that their dispersion relationship is capable of realistically representing the salient features of the MJO in the current climate (section 4 in AK16), the framework has not been used to understand the behavior of the MJO and its change across different climates. It will be shown that changes in four variables can characterize most of the changes in MJO propagation. These are the dry static stability, the horizontal distribution of moisture, the convective moisture adjustment time scale, and the MJO's zonal scale.
The paper is structured as follows: the model used in this study and the methods of analysis are described in section 2. Section 3 covers the theoretical background for this study. Section 4 focuses on how the relationship between column moisture and precipitation changes with increasing CO2. In section 5, changes in the MJO are analyzed through the use of a MSE budget. In section 6, we quantitatively estimate changes in the maintenance and propagation of the MJO‐related rainfall anomalies using the framework presented in section 3. The results of this study are discussed in section 7. Finally, a few concluding remarks are offered in section 8.
2. Data and Methods
To investigate the effect of CO2 changes on the characteristics of the MJO, we make use of the NASA GISS Model E2 coupled to a mixed layer ocean model. Four simulations are run with CO2 concentrations ranging from 0.5 to 4 times preindustrial levels, at a 2.5° (longitude) × 2.0° (latitude) × 40 (levels) resolution. The depth of the mixed layer is fixed at 65 m. After reaching an equilibrium (i.e., steady global mean surface temperature), each experiment was carried out for additional 30–50 years, and last 20 years of simulations are used in the current study. Further details on the model are provided in Adames et al. (2017).
The following fields are used in this study. The wind components in isobaric coordinates (u, v, ω), specific humidity (q), temperature (T) and geopotential ( ), precipitation (P), surface and top of the atmosphere shortwave and longwave radiative fluxes, and surface sensible H, and latent heat fluxes E. Temperature is also used in the calculation of the saturation specific humidity (qs). Fields involving products of individual field variables are also used in section 5. These products are calculated with each daily averaged field, and afterward the procedure is identical to the analysis of the individual field variables. The Eulerian temporal tendency of the fields analyzed here are calculated through a 2 day centered differencing scheme.
Many of the fields described in this study correspond to intraseasonal anomalies, obtained by removing the mean and first three harmonics of the annual cycle based on the 20 year simulation. Additionally, a 101 point Lanczos filter (Duchon, 1979) is used to retain anomalies within the 20–100 day time scale. As in Adames et al. (2017), several of the figures shown here correspond to linear regressions upon an MJO‐filtered (filtered to retain only the eastward‐propagating, zonal wave number 1–5 signal) time series of OLR, averaged over th e western Pacific basin (15°N/S 140°E–180°E). We have verified that the results presented here are reproducible using a reference time series corresponding to other regions of the warm pool (see Appendix B), or through the use of principal component time series arising from EOF analysis. The contour and shading intervals in the plots shown in section 5 correspond to the 95% confidence interval based on a two‐sided t test. As in Adames et al. (2017), errorbars in the scatterplots are obtained by repeating the analysis with a 10 member ensemble of 5 years subsamples taken from the 20 year time series.
This study makes use of several of the main results from Adames et al. (2017), which are summarized in Table 1. Of particular importance are the calculations of phase speed, group velocity, and zonal scale. Details of the procedure is presented in Adames et al. (2017), but it is summarized here for convenience. The phase speeds and group velocities were estimated from the time‐longitude diagrams in Figure B1 of Adames et al. (2017) following the method described in Adames and Kim (2016). For the phase speed calculation, we choose extrema (maxima and minima) that occur within 25 days of the reference time (lag day 0). The phase speeds are calculated for each time‐longitude section by averaging the MJO‐filtered anomaly fields across several longitude intervals. For each field, the time when a statistically significant extremum occurs is calculated within each longitude band. Phase speed is then calculated by linear least squares fit of the time in which an extremum occurs within each longitude band. The group velocities were using the zonal and temporal position of a local extremum of each field. A local extremum is defined here as a local maximum/minimum occurring within 25 days of the reference time. After all the local extrema are identified, the group velocity is calculated through a linear least squares fit in the longitude‐time space.
Table 1.
Percentage Change for Different Fields With Increasing Greenhouse Gases as Inferred From the Four GISS Simulations, Summarized From Adames et al. (2017 )
| Variable name | Symbol | % Change per Kelvin | |
|---|---|---|---|
| MJO‐related column moisture anomalies |
|
9.1 (±1.6)% K−1 | |
| MJO‐related precipitation anomalies |
|
5.5(±0.8)% K−1 | |
| Mean MJO phase speed |
|
3.3 (±1.9)% K−1 | |
| Mean MJO group velocity |
|
−2.6(±1.4)% K−1 | |
| Mean MJO zonal wave number |
|
−2.8(±0.8)% K−1 | |
| East/west power ratio for column moisture | 0.6(±2.0)% K−1 | ||
| East/west power ratio for precipitation | 1.8(±1.5)% K−1 |
The mean zonal wave number was obtained through a longitudinal fast Fourier transform in the time‐longitude diagrams in Adames et al. (2017). The zonal power spectrum is then averaged for all the latitudes and days included and then normalized using the formula . The approximate wave number k is obtained by summing the zonal wave numbers, weighting each one by its normalized power .
3. Theoretical Background
In Adames et al. (2017), we showed how the MJO‐related moisture and precipitation anomalies changed as surface temperatures increased. In this part, we will extent those results to show how the maintenance and propagation of the MJO‐related precipitation anomalies change with increasing greenhouse gases. In order to understand these changes, we define the intraseasonal (20–100 day filtered, denoted by primes) moist static energy (MSE) budget
| (1) |
where J kg−1 is the latent energy of vaporization, v is the horizontal wind field, and are the anomalous surface sensible and latent heat fluxes, respectively, and the primed angle brackets denote the mass‐weighted vertical integral of the anomaly fields
| (2) |
and is an MSE equivalent of the so‐called “column process” term of Chikira (2014), defined as the sum of anomalous vertical MSE advection and anomalous column‐integrated radiative heating
| (3) |
As shown in previous studies, it is the horizontal advection of MSE induced by the MJO flow acting upon the mean MSE gradient that dominates the propagation of the moisture/MSE anomalies (Adames & Wallace, 2015; Kim et al., 2014; Pritchard & Bretherton, 2014). These wind anomalies are a response to the apparent heating arising from the intraseasonal precipitation anomalies. Because of this, it may be useful to turn equation (1) into a prognostic precipitation equation, as was done by Inoue and Back (2015) and Adames (2017). It was shown by Bretherton et al. (2004) that precipitation is related to column water vapor through the following exponential relationship:
| (4) |
where is the column relative humidity, and P 0 and ad are constants. Note that we use the notation RH for column relative humidity to be consistent with using capital letters or angle brackets for column‐integrated variables, and to distinguish it from column radiative heating R.
We can linearize equation (4) to obtain a relationship for the intraseasonal precipitation anomalies. Following Bretherton et al. (2004), Sobel and Maloney (2012), and Adames (2017), we can describe these anomalies in terms of a convective moisture adjustment time scale
| (5) |
| (6) |
where PL and are low‐frequency (100 day low‐pass filtered) values of precipitation and column‐integrated saturation specific humidity, respectively, and ad is a constant. The low‐pass filter is used to capture covariance between the MJO and the seasonal cycle that is missed if a climatological‐mean average is used. Thus, τc varies in space and time, which differs from previous studies where τc is treated as a constant (Adames & Kim, 2016).
We can interpret τc as being the time scale required for precipitation to relax column moisture back to its climatology value. τc can also be interpreted as being inversely proportional to the sensitivity of precipitation to changes in . This is identical to the simplified Betts‐Miller scheme (Betts, 1986; Betts & Miller, 1986; Neelin & Zeng, 2000), except its value its obtained from a linearization of equation (4), as shown in Appendix A.
Following Adames (2017), we divide the column‐integrated moist static energy budget by the convective moisture adjustment time scale and turn it into a “precipitation equation”
| (7) |
where we have scaled the equation by Lv so it is in the same units as MSE. From here on corresponds to the precipitation estimated from Note that in defining this prognostic precipitation equation, we are assuming that MSE is dominated by the latent energy contribution , satisfying the weak‐temperature gradient approximation (WTG) (Sobel & Bretherton, 2000; Sobel et al., 2001). It was shown by Wolding et al. (2016) that WTG balance is an appropriate approximation at intraseasonal time scales. Equation (7) can also be thought as a budget for scaled by the low‐frequency, background PL
| (8) |
Equation (7) provides a useful framework for understanding the physical processes responsible for changes in the MJO with increasing CO2. However, it does not quantitatively explain the changes in the phase speed of the MJO. We can use the linear wave solution from Adames and Kim (2016) (AK16 from here on) to interpret the changes in MJO propagation from a “moisture mode” perspective. AK16 simplified equation (7) by assuming that the propagation of the rain area occurs predominantly through large‐scale horizontal and vertical advection of mean moisture by the MJO flow. The MJO wind field is represented as the steady state response to an equatorial heating field (Gill, 1980; Matsuno, 1966). While we make this assumption for simplicity, it does not fully capture the horizontal structure of the MJO in observations, in which the propagation of the MJO causes the Rossby wave response to be weaker. Furthermore, the mean state is assumed to be zonally symmetric, and the vertical structure of the MJO is assumed to be dominated by a first baroclinic mode (deep convective ascent). With these approximations, the propagation of the wave disturbance can be described with the following relations:
| (9a) |
| (9b) |
where k is the zonal wave number. AKR is the rate at which the wind anomalies in the MJO‐related wind anomalies moisten/dry the region to the east/west of the anomalous rain area, thereby inducing eastward propagation of the rain anomalies. AKR is expressed as follows:
| (10) |
where is the sum of all the moistening processes associated with the MJO‐related winds. These processes include horizontal advection by the MJO winds, frictionally induced moisture convergence, meridional moisture advection by high‐frequency eddy activity and surface latent heat fluxes. is a constant that describes the projection of the vertical structure of the horizontal wind field onto the vertical structure of moisture ( in Table 1 of AK16). and are free‐tropospheric dissipation weighting functions of the form:
| (11a) |
| (11b) |
where
| (12) |
is the distance that free Kelvin waves travel in the presence of Rayleigh damping in the free troposphere, c is the free Kelvin wave group velocity and ɛ is a Rayleigh drag coefficient for the free troposphere. c is defined as:
| (13) |
where Rd is the dry gas constant, Cp is the specific heat of dry air, and kg m−2 is the column integral of the vertical structure of temperature in Kelvin waves, as in Neelin and Zeng (2000). Finally, is the mean gross dry stability, a measure of the dry static stability of the troposphere
| (14) |
where Ω is a structure function corresponding to deep convection and overbars correspond to a temporal average. To facilitate comparison, we will define a and Ω in the same way as AK16, although using structure functions corresponding to the leading EOFs of vertical velocity in each GISS model simulation yields similar results (not shown).
Although the framework used in AK16 may be too simple to fully understand the dynamics of the MJO in this model, it may nonetheless provide useful insights as to how the MJO responds to greenhouse gas‐induced warming. That the propagation of the MJO in Adames et al. (2017) shows an eastward phase speed and a westward group velocity, similar to the dispersion relation defined in equations (9a) and (9b), encourages the use of this framework to understand how the MJO responds to increasing CO2 in this model.
4. Moist Processes
In order to understand how the convectively coupled structure of the MJO changes with increasing CO2, understanding how the relationship between RH and P changes is of critical importance. This relationship can be understood in terms of the exponential curve in equation (4) and the convective moisture adjustment time scale (equation (6)).
Figure 1 shows probability distributions of and RH over the warm pool (60°E–120°W, 15°N/S). It is clear that the probability distribution of not only exhibits a shift toward higher value as CO2 concentrations increase, but the distribution also widens, suggesting greater variance in with increasing surface temperatures. In the 4CO2 simulation, water vapor values range from 30 to 90 mm, a range of 60 mm, while in the 0.5CO2 simulation they range from ∼15 to 55 mm, a range of 40 mm. Remarkably, the change in range is approximately of the same amount as the change in the mean magnitude of (∼ 7% K−1, as shown in Adames et al., 2017). In contrast, the probability density distributions for RH are similar for all four simulations, suggesting that RH variability remains approximately fixed with increasing CO2; which indicates that increases at the same rate as , as mentioned in previous studies of water vapor feedbacks (Held & Soden, 2006; Soden & Held, 2006). This result contrasts those of Arnold and Randall (2015), who found a change in the RH distribution as surface temperature increases. However, their simulation setup of globally constant SSTs is very different from ours.
Figure 1.
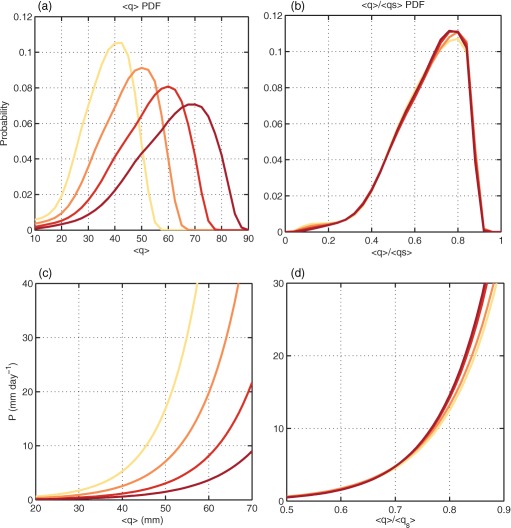
Plots (a) and (b) show probability density distributions of (a) and (b) RH over the Indo‐Pacific warm pool (60–180°, 15°N/S). Values of and RH have been binned at intervals 2.5 mm and 0.05, respectively. Plots (c) and (d) show the nonlinear least squares fit of the relationship between (c) column water vapor , (d) column relative humidity and precipitation P. Darker shadings of red depict simulations with higher CO2 concentrations, ranging from 0.5, 1, 2, 4 times preindustrial levels.
Daily mean precipitation as a function of and RH is shown in plots (c) and (d) of Figure 1. The curves are obtained from a nonlinear least squares fit. As in the probability distributions shown in plots (a) and (b), a large spread is seen in the curves, while the P–RH curves remains relatively fixed, with only a slight increase in the steepness of the curve with increasing CO2 observed at high RH bins.
The left plot of Figure 2 is as in Figure 1c, but showing values of shifted such that they are centered around the value of that corresponds to the mean value PL, shown as the zeroth value in the x axis. As CO2 concentrations increase, it is clear that the slope in the curves becomes less steep, indicating a weaker precipitation response to the addition or removal of column water vapor. We can interpret this result as a lengthening of the convective moisture adjustment time scale (equation (6)).
Figure 2.
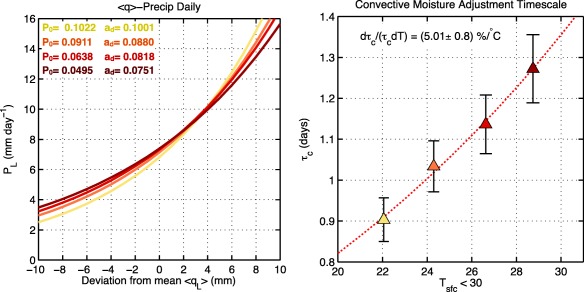
(left) Nonlinear least squares fit of the relationship between and PL, as described by equation (4). The values of have been shifted such that the zeroth value corresponds to the value of that corresponds to the warm‐pool averaged value of PL. (right) Scatterplot of warm‐pool averaged (60°E–180°E, 15°N/S) convective moisture adjustment time scale τc, obtained from equation 6 for each simulation. Darker shadings of red depict higher concentrations of CO2, ranging from 0.5, 1, 2, 4 times preindustrial levels. The nonlinear least squares fit is shown as a dashed line.
Values of τc as obtained using equation (6) are shown in the scatterplot in the right plot of Figure 2. An increase in the time scale is evident, changing from ∼0.9 days in the 0.5CO2 simulation to ∼1.3 days at 4CO2, with a rate of increase of ∼5.0% K−1, indicative of a longer time scale in the removal of excess column moisture by precipitation. Note that this time scale is longer than that obtained from observations (Adames, 2017). An alternative method for calculating τc is shown in Appendix A. While different values of τc are obtained, qualitatively similar trends (4.4% K−1) are observed.
We can further understand why τc lengthens with increasing CO2 by differentiating equation (6) with respect to the mean surface temperature. The rate of change of with respect to increasing mean surface temperatures due to increasing CO2 concentrations takes the following form:
| (15) |
where the first term on the right‐hand side indicates the percentage change in low‐frequency (100 day low‐pass filtered) column saturation specific humidity with increasing surface temperatures, the second term indicates changes in low‐frequency precipitation, and the third term can be thought of as a change in the sensitivity of precipitation to changes in RH (ad corresponds to the constant in the exponential in equation (4)). increases ∼7.6% K−1, qualitatively agreeing with the Clausius‐Clapeyron equation (not shown), while PL increases at ∼1.2%K−1. A weak positive trend in ad of ∼1.4% K−1 is also observed (not shown), indicative of a faster pickup of P with increasing RH in warmer climates, as seen in Figure 1d. Thus, changes in τc are largely driven by increasing , with small offsets from increasing low‐frequency precipitation and ad.
The increasing convective moisture adjustment time scale can explain the changes in MJO precipitation in terms of changes in column moisture. By differentiating equation (5) with respect to surface temperature, we obtain the following relationship:
| (16) |
By using the calculated trends for τc and , this equation indicates that MJO‐related precipitation will increase at ∼4.1(±1.8)% K−1, smaller but within the range of uncertainty of the rate of increase of 5.5(±0.8)% K−1 found in Adames et al. (2017).
5. MJO Propagation and Maintenance
We can examine the processes that contribute to changes in the maintenance and propagation of the MJO by examining the intraseasonal, vertically integrated “precipitation” budget as defined in equation (7). Horizontal maps of the terms in equation (7) are shown in Figure 3. These are regression maps obtained by scaling each MSE budget term by a temporally and spatially varying τc, as in Adames (2017). Each term is then regressed to a filtered OLR time series centered over the western Pacific (Appendix B describes regression maps centered over the Maritime Continent and the Indian Ocean). It is clear that amplifies with warming, as seen in the shading in Figure 3a. Amplification of is less clear, with the near‐equatorial anomalies exhibiting amplification, and the anomalies centered in the Southern Hemisphere exhibiting some weakening.
Figure 3.
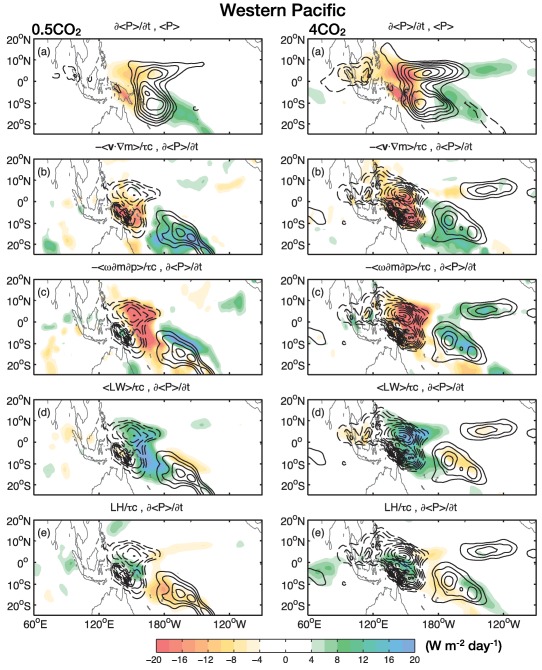
Precipitation maintenance and propagation of an MJO regressed over the western Pacific sector for the (left) 0.5CO2 simulation and (right) 4CO2 simulation. (a) Estimated precipitation ( ) anomalies (contours) and its temporal tendency (shaded). Plots (b)–(e) show the column precipitation tendency and its contribution by (b) horizontal MSE advection, (c) vertical MSE advection, (d) longwave radiative heating, and (e) surface latent heat fluxes. Shading is in units of W m−2 d−1. Contour interval is every 15 W m−2 starting at 30 W m−2 for plot (a) and every 2 W m−2 d−1 starting at 4 W m−2 d−1 for plots (b)–(e).
The processes that lead to the propagation of is shown in plots (b)–(e). Horizontal MSE advection (Figure 3b) is colocated with the MSE tendency and amplifies with increasing CO2. Vertical MSE advection, shown in Figure 3c, is shifted slightly to the west of the precipitation anomalies, and exhibits an amplification with increasing CO2. Column longwave heating (Figure 3d) exhibits the same horizontal structure as vertical MSE advection, but of the opposite polarity. Surface latent heat fluxes (Figure 3e) are weaker and do not show any clear relation to the MSE tendency.
Figure 4 shows the dominant precipitation budget terms averaged over the 15°N/S latitude belt. An increase in zonal scale in the estimated precipitation anomalies is seen, as was shown in Adames et al. (2017). A modest amplification is seen in horizontal MSE advection and in the column process (the sum of vertical MSE advection and column LW heating). The column process exhibits the same polarity as , indicating that the column is effectively unstable in regions of moistening, and stable in regions of drying, contributing to the propagation of the MJO. In comparison to horizontal MSE advection, is shifted slightly eastward. It is noteworthy that when inspecting in Figure 4, a clear zonal asymmetry is observed, indicative of a slow buildup of MSE to the east of the precipitation anomalies, and a rapid discharge to the west.
Figure 4.

Precipitation estimate (solid black line, divided by a factor of 10 to facilitate comparison), its tendency (dashed black line), horizontal MSE advection (gray dot dashed line), and the sum of vertical MSE advection and longwave radiative heating (gray solid) for the 0.5CO2 (left) and 4CO2 simulations (right), averaged over the 15°N/S latitude belt. Lines are in units of W m−2 d−1, except , which is in units of W m−2.
We can assess the relative importance of the terms in equation (7) to the maintenance and propagation of the rainfall anomalies by comparing the strength of their projections upon the and tendency, following the methods of Andersen and Kuang (2012) and Arnold et al. (2013)
| (17a) |
| (17b) |
where F corresponds to a term in equation (7), and is the integral of over the domain 15°N/S, 60°E–120°W. These contributions are shown in the top plot of Figure 5. The main contributors to the maintenance of the precipitation anomalies are vertical MSE advection and longwave radiative heating. The reduction in damping by vertical MSE advection can be understood as an increase in the vertical moisture gradient, as shown in Figure 2 in Adames et al. (2017), consistent with Arnold et al. (2015, 2013).
Figure 5.
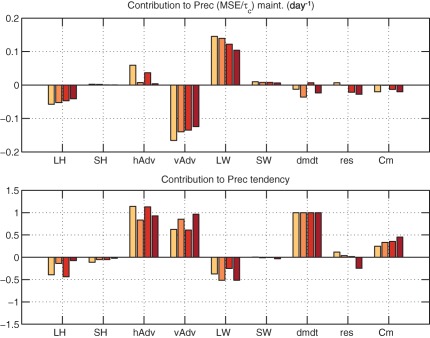
Normalized contribution of the individual terms in the column‐integrated precipitation budget (equation (1)) to the (top plot) maintenance and (bottom plot) propagation of the MSE anomalies for an MJO regressed over the western Pacific. The terms are obtained by projecting (top plot) and (bottom) onto the individual contributions to the MSE budget using equation (17). The individual contributions include (from left to right) surface latent heat fluxes, sensible heat fluxes, horizontal MSE advection, vertical MSE advection, column longwave radiative heating, column shortwave radiative heating, MSE tendency, the residual of the sum of the rhs terms in equation (1), and the sum of longwave heating and vertical MSE advection, defined as an estimate of the effective gross moist stability. The bars for each term corresponds to the simulations with 0.5, 1, 2, and 4 times preindustrial levels of CO2, with darker red shading indicating higher CO2 concentrations.
Similarly, the relative contribution of longwave radiative heating is reduced with warming. This reduction can be confirmed by estimating the value of the greenhouse enhancement factor r from scatterplots of anomalous longwave heating and precipitation. A sample scatterplot is shown in the left plot of Figure 6 for the 0.5CO2 run. When all four simulations are considered together, it is clear that the greenhouse enhancement factor decreases with warming at a rate of ∼3.7% K−1. This weakening is likely a result of the moistening of the upper troposphere as CO2 increases, as indicated by the changes in relative humidity in Figure 2 of Adames et al. (2017). A moister upper troposphere would lead to increased absortion of longwave radiation in the upper troposphere which would reduce the impact of anomalous upper‐tropospheric cloud cover.
Figure 6.
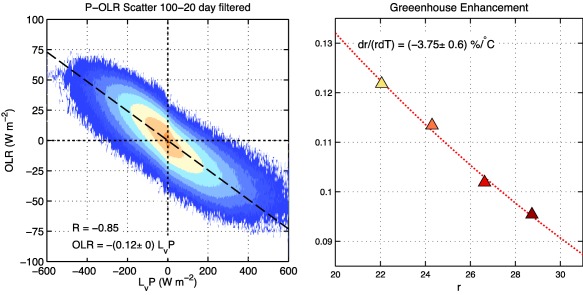
(left) Scatterplot of 20–100 day filtered precipitation (in W m−2) against OLR anomalies. The shaded field in the scatterplot corresponds to the base‐10 logarithm of the amount of points located within 2 W m−2 × 2 W m−2 bins. The linear least squares fit regression is depicted as a dashed line, where the slope corresponds to the greenhouse enhancement factor r. The best fit regression equation and the correlation coefficient are shown in the bottom‐left corner. (right) Greenhouse enhancement factor r as a function of tropical surface temperature, for all four simulations. The nonlinear least squares fit is shown as a red dotted line and the rate of change per degree of warming is shown in the top‐left corner.
The sum of vertical MSE advection and longwave radiation is shown in the rightmost bar in Figure 5. It is found that the contribution of to MJO maintenance is weakly negative, and no clear trend is observed. Other processes do not seem to play a significant role in maintaining the anomalies.
When it comes to the processes that contribute to the propagation of the MSE anomalies, shown in the bottom plots of Figure 5, both horizontal and vertical MSE advection contribute significantly. However, neither process shows a clear trend with increasing CO2, although their absolute magnitudes increase (Figures 3 and 4). When vertical MSE advection and LW heating are considered together ( ), it becomes clear that there is an increasing relative contribution from the combined processes to propagation.
6. Understanding the Changes in the MJO Using AK16 Theory
6.1. Changes in MJO Propagation
We will now use the results from the previous two sections to understand changes in the propagation of the MJO. In Adames et al. (2017), we showed that both the phase speed and the group velocity increase with surface temperature, as summarized in Table 1. Here we will use equations (9a) and (9b) to understand the physical mechanisms behind the increase in MJO propagation speed. We differentiate the terms in equations (9a) and (9b) with respect to the mean surface temperature. The equation for changes in mean MJO phase speed as mean surface temperature increases takes the following form:
| (18) |
From the Hovmoller diagrams in Adames et al. (2017), it is estimated that the phase speed increases at a rate of % K−1 (Table 1). We can verify whether the RHS in equation (18) is consistent with these changes by analyzing each term independently. It was shown in section 4 that τc increases at a rate of 5.0% K−1. Results from Adames et al. (2017) indicate that the MJO's mean zonal wave number decreases at a rate of % K−1 (Table 1).
In AK16, was defined as the sum of the horizontal and vertical moisture gradients and the bulk aerodynamic formula for latent heat fluxes, weighted by parameters that account for the tendencies that the wind anomalies would induce through moisture advection (see section 3 in AK16). It was shown in section 5 (Figures 3, 4, 5) that both horizontal and vertical MSE advection contribute to the propagation of the intraseasonal precipitation anomalies. However, vertical MSE advection covaries with LW radiative heating, and largely cancel one another such that their combined contribution is smaller than that of horizontal MSE advection in all simulations. Horizontal MSE advection is dominated by the meridional moisture advection component (not shown), consistent with previous studies of the observed MJO (Adames et al., 2016; Kim et al., 2014). Thus, we can roughly approximate as being proportional to the climatological‐mean meridional moisture gradient over the warm‐pool region, that is
| (19) |
Figure 7a shows the meridional structure of warm‐pool averaged for the four simulations. An increase in magnitude is observed over all regions of the warm pool. It is found that the root‐mean‐squared amplitude of increases at 6.9% K−1 (Figure 7b), approximately the same rate as . The observed rate of change indicates that the near‐equatorial column moisture (within ∼10°N/S) increases at a faster pace than the off equatorial (10°N/S–20°N/S) mean moisture does, consistent with Clausius‐Clapeyron scaling and Figure 2 of Adames et al. (2017). Moreover, from Figure 7 we can infer that changes in are mainly due to changes in the magnitude of , with little contribution from changes in the meridional structure of (see also Figures 1 and 3 in Adames et al., 2017).
Figure 7.
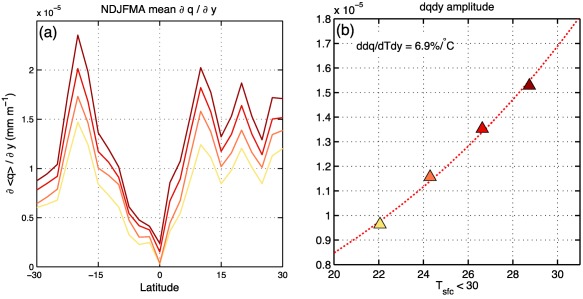
(a) Warm‐pool average (60°E–180°E) of the NDFJMA mean meridional gradient of column moisture for each of the four GISS simulations. Simulations with higher CO2 concentrations are shown as a darker shade of red. (b) Scatterplot of the root‐mean‐square value of of the NDFJMA mean over the Indo‐Pacific warm pool. The nonlinear least squares fit is shown as a red dotted line and the rate of change per degree of warming is shown in the top‐left corner.
Horizontal moisture advection also depends on the magnitude of the wind anomalies. It was found by Maloney and Xie (2013) that changes in static stability, in addition to changes in diabatic heating, dominate changes in the wind anomalies in the MJO as CO2 concentrations increase. We can estimate changes in the static stability by analyzing changes in the gross dry stability . Scatterplots of changes in over the warm pool are shown in Figure 8a. It is found that gross dry stability increases at a rate of ∼4.0% K−1.
Figure 8.

Scatterplot of warm‐pool averaged (a) gross dry stability , (b) Kelvin wave dissipation lengthscale L, and (c) the free‐tropospheric dissipation weight (see equation (11a)). The nonlinear least squares fit is shown as a red dotted line and the rate of change per degree of warming is shown in each plot.
We can obtain values of and by estimating L, which is estimated as in AK16 by using the ratio of phase speed and group velocity in equations (9a) and (9b). The values of L obtained this way are shown in Figure 8b. An increasing trend in L is observed, implying that dry equatorial waves travel longer distances in warmer climates in the presence of dissipation. This yields an approximately fixed value of 0.73 and 0.36 for and , respectively as shown in Figure 8c. It is worth noting that the method of estimating L this way yields values of d−1. While this value is considered large for the free troposphere, it is similar to the values found in AK16. This may be a limitation of the method used to calculate L.
The final term can be shown to vary little percentagewise with increasing CO2, due to . Thus, contributes little to changes in MJO propagation. Because the last two terms in equation (18) vary little with warming, we can drop them and arrive at the following relation for the MJO phase speed:
| (20) |
By adding the trends in the terms in the right‐hand side in equation (20), we obtain that the magnitude of the phase speed and group velocity increase at a rate of 3.5 ± 1.8% K−1, which is consistent with the change in phase speed and group velocity estimated in Adames et al. (2017) (Table 1). The large uncertainty in the estimated values arises from the uncertainties in the estimation of k and τc. We can also use equations (9a) and (9b) to make estimates of the phase speed and group velocity and compare them to the propagation of the MJO in the four simulations. For this we use , the value of τc from Figure 2 and the mean values of k from Figure 11a of Adames et al. (2017). Figure 9 compares the calculated phase speed and group velocity from the time‐longitude diagrams in Figure 10 of Adames et al. (2017) (see Table 1) with those estimated from Equations (9a) and (9b). While there are some differences, both fields compare reasonably, and exhibit similar trends with increasing CO2.
Figure 11.
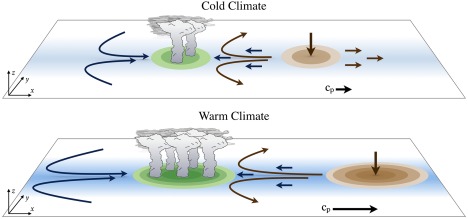
Schematic summarizing the results found in this study. Blue shading along the horizontal plate represents mean column moisture, with darker shading indicating higher concentrations. Green and brown patches correspond to enhanced or suppressed moisture, respectively, with darker shading representing larger anomalies. The clouds correspond to anomalous precipitation. The wind anomalies corresponding to the region of enhanced and suppressed convection are shown in dark blue and dark brown, respectively. The curved horizontal arrows correspond to the Rossby wave response to equatorial heating and the straight horizontal arrows correspond to the Kelvin wave. As the climate warms the MJO‐related moisture anomalies become stronger and the zonal scale of the MJO increases. The horizontal moisture gradients increase, the convective adjustment time scale increases, while the amplitude of the wind anomalies changes little. The sum of the contribution from these changes leads to enhanced eastward propagation.
Figure 9.
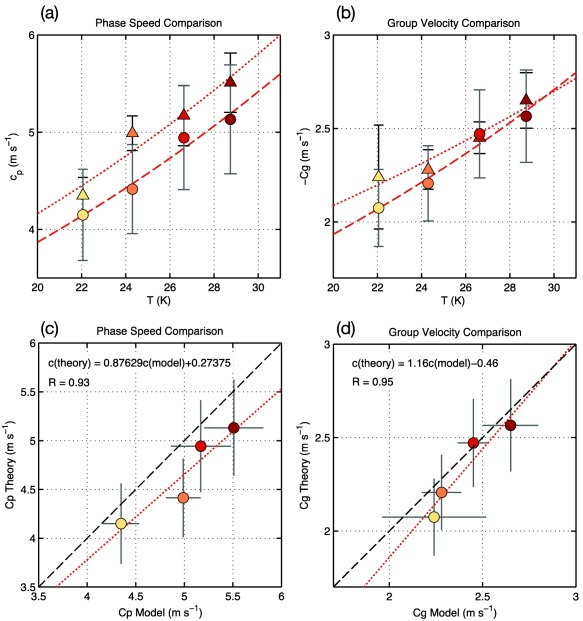
Comparison of the (a) phase speed and (b) group velocity inferred from the time‐longitude diagrams of Adames et al. (2017) (triangles) and estimated from equations (9a) and (9b) (circles). The corresponding nonlinear least squares fit are shown as red dotted and dashed lines, respectively. The confidence interval for each estimate is shown as an error bar. (c) and (d) Scatterplots of the phase speed and group velocity estimated from theory (y axis) with those inferred from Adames et al. (2017) (x axis). The 1‐1 line is shown as a dashed line and the linear least squares fit is shown as a red line. The linear regression coefficients and the correlation are shown in the top left.
Figure 10.
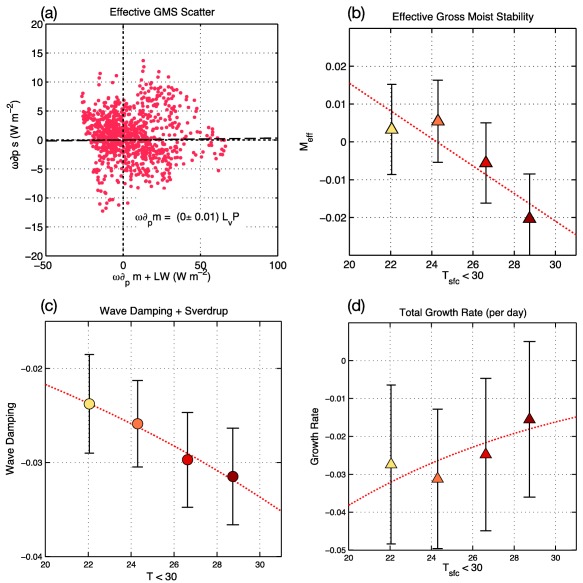
(a) Scatterplots vertical MSE advection plus longwave radiative heating versus vertical DSE advection for the regression maps shown in section 5. The slope in the scatterplots correspond to the effective gross moist stability (GMS). The corresponding values of effective GMS, as inferred from the slopes of the scatterplots for each simulation, are shown in plot (b). (c) Damping rate of the MJO‐related anomalous rain area arising from wind‐driven damping (from advection) and (c) the total growth rate as inferred from (22a). The nonlinear least squares fit is shown as a dashed line.
6.2. Changes in MJO Maintenance and Growth
As in the previous subsection, we can use the results from sections 4 and 5 within the context of the AK16 framework to further understand how the processes that maintain the MJO change with warming. It is clear from Figure 5 that the central processes to the maintenance of the MSE anomalies are vertical MSE advection and longwave radiative heating. Vertical MSE advection can be normalized by vertical dry static energy advection to produce the normalized gross moist stability (NGMS) (Inoue & Back, 2015; Raymond et al., 2009). The sum of vertical MSE advection and radiative heating can be thought of as proportional to the effective vertical gross moist stability (Adames & Kim, 2016; Sobel & Maloney, 2012, 2013). The effective GMS can be thought of as the normalized difference between vertical moisture advection and loss of moisture from precipitation. Following these studies, we define the effective vertical GMS in a manner similar to Inoue and Back (2017)
| (21) |
A scatterplot of Cm versus vertical dry static energy advection is shown in Figure 10a. In this plot, corresponds to the linear least squares fit of the cloud of points. has a value that is close to zero in all simulations, with hints of a negative trend. While the points in the scatterplot exhibit a large scatter, we have verified other methods of calculating (Inoue & Back, 2017; Sobel & Maloney, 2012) and have found that all methods yield values that are close to 0. This is consistent with Figure 5, which shows that the MSE column process contributes very little to MJO maintenance.
The growth rate of the moist wave was written in AK16 as:
| (22a) |
| (22b) |
where α is the phase angle between the equatorial wind anomalies and column moisture (see equation (29) in AK16) and is the total GMS, defined in equation (22a) of AK16 as augmented by meridional moisture advection by the component of the meridional wind field that satisfies Sverdrup balance .
Changes in are not the only cause of changes in the MJO's growth rate. The contribution to growth by horizontal MSE advection, which constitute the other terms in equation (22a), is shown in Figure 10c. These are calculated in the same way the estimated phase speed was calculated in section 6. Increased damping is observed as CO2 increases. This differs from the MSE budget presented in section 5, in which horizontal MSE advection plays little role in the maintenance of the MJO. When considered along with (Figure 10d), a weak positive trend is observed, but the MJO is weakly damped in all four simulations. The damping time scale is long, ranging from 200 to 600 days. We have tried other methods to calculate the growth rate and they all yield weak damping, with time scales ranging from 50 to 600 days (not shown).
It is possible that the weak damping found in this section is due to missing processes in the AK16 model. It could also be due to limitations in the calculation of terms such as L, which was indirectly determined from the Hovmoller diagrams in Adames et al. (2017). However, from inspecting Figure 5 (see also Appendix B) it is clear that the MJO in the GISS model is, on average, weakly damped to neutrally stable. Thus, the result that the MJO is weakly damped is not necessarily inconsistent with the simulations analyzed here.
7. Summary and Discussion
In this study, we made use of the column‐integrated MSE budget, the relationship between precipitation and column relative humidity, and a moisture mode theoretical framework to analyze how the MJO changes with increasing greenhouse gases in the NASA GISS general circulation model. While many previous studies have analyzed how the MJO changes with increasing CO2 (Arnold et al., 2015; Carlson & Caballero, 2016; Chang et al., 2015; Subramanian et al., 2014, among others), a quantitative analysis of the processes that are responsible for these changes has not been carried out.
It is found that four fields are of central importance for changes in the eastward propagation of the MJO. The horizontal and vertical gradients in climatological‐mean moisture are found to steepen with increasing CO2. Because of this steepening, horizontal and vertical moisture advection amplify and induce faster eastward propagation of the MJO. While horizontal advection dominates propagation, it is found that vertical moisture advection contributes an increasing fraction of the MSE tendency with warming. The effect of steepening moisture gradients is opposed by a lengthening convective moisture adjustment time scale τc, which is inversely related to the sensitivity of precipitation to changes in column water vapor. It is found that this is a consequence of precipitation requiring to remove larger amounts of water vapor in order to reduce the column relative humidity RH. Consistent with results from Maloney and Xie (2013), increasing dry static stability, defined here as the gross dry stability, acts to weaken the wind anomalies in the MJO. This effect is largely offset by the increasing zonal scale in the MJO, which strengthens the wind anomalies (see equation (6) in Sobel and Maloney, 2013 and Appendix C in AK16). A schematic summarizing some of the major findings in this study is shown in Figure 11.
We also investigated how the processes that maintain the MJO‐related precipitation anomalies change with increasing CO2. We have found that damping due to vertical MSE advection weakens with warming. This reduction is a result of the climatological‐mean vertical moisture gradient steepening at a faster rate than the increase in dry stability (i.e., the vertical stratification of dry static energy, see Figure 2 in Adames et al., 2017). The reduction in vertical MSE advection is largely offset by a weakening of longwave radiative feedbacks as CO2 concentrations increase. This weakening is possibly a result of an increasing upper‐tropospheric water vapor concentration causing the presence of anomalous upper‐level clouds to have a smaller impact on outgoing longwave radiation.
A result of this study that requires further discussion is the increase in amplitude and zonal scale of the MJO with warming. These changes might be explained in a linear stability problem (e.g., the AK16 model) if the growth rates of the waves increase, preferentially for lower wave number waves. We investigated the processes that destabilized the MJO within the moisture mode framework (equation (29b) in AK16). While the diagnosed theoretical linear growth rate revealed that the MJO is weakly damped in all simulations, showing results that are qualitatively consistent with the MSE budget shown in section 5, it did not predict either the amplitude increase or the zonal scale increase of the MJO with warming. This result suggests that the theoretical framework presented in AK16 is incomplete, and may need to be expanded upon in order to explain how the MJO's amplitude and scale respond to increasing CO2 in the GISS model. Below we enumerate several hypotheses that may explain the scale selection of the MJO.
Uncertainty in the terms used to calculate the growth rate in the AK16 model. Some of the terms in the model, for example L, are indirectly estimated from GISS data and thus may be highly uncertain.
Processes not included in AK16. For example, the temperature and momentum tendencies were not included in the SM and AK16 models. It was shown by Fuchs and Raymond (2017) that including these tendencies can lead to growth and planetary‐scale selection of their WISHE‐moisture mode. Furthermore, their dispersion relation is qualitatively similar to that of AK16 without the inclusion of linear damping, which is the main cause of damping in the AK16 model. While the AK16 model is linearized with respect to a zonally uniform background state, the observed and simulated MJO occur over a zonally varying warm pool. Zonal variations in column moisture may play an important role in the MJO's amplitude and scale.
The MJO is stochastically driven in the GISS model. In Adames et al. (2017), it was found that both eastward and westward propagating intraseasonal moisture anomalies strengthen at roughly 9% K−1, faster than the rate of change of anomalies of shorter spatial and temporal scales. That MJO variability increased at this rate while the east/west power ratio showed little change suggests that increase in MJO variability with increasing CO2 in the GISS model is not due to a destabilization of the MJO. Instead, its amplitude might be scaling in accordance to the red noise background spectrum (see Figure 8 in Adames et al., 2017). This result may suggest that the MJO is stochastically driven, at least in the GISS model. In this case, the amplitude and shape of the background noise spectrum can determine which wave numbers will be seen more frequently in the system. If the background noise variability is stronger at low‐wave numbers, for example, those large waves will be triggered more frequently and strongly than smaller waves. This suggests that changes in the background noise spectrum could affect the amplitude and zonal scale of the MJO. The reddening of the background moisture spectrum is likely caused by the lengthening of the convective moisture adjustment time scale. A longer τc implies an increase in the moisture residence time, which in turn would cause moisture anomalies to organize in larger horizontal scales at the expense of smaller scales perturbations. If the MJO is a marginally stable wave, which is stochastically triggered by background noise, this will lead larger MJO waves to be triggered more often than smaller waves. As a result, the overall MJO zonal scale would increase without changes in the growth rate of the MJO.
Point (3) is not contradictory to the linear stability theory of SM and AK16, but it is complementary to them by providing a missing component in the original moisture mode theory for the MJO: the role of background noise spectrum. As is true for any other linear stability theory, the AK16 model cannot explain how the MJO initiates. In reality, MJO initiation might be affected by the background noise variability. In this sense, the role of background noise variability on the initiation of the MJO has remained unexplored.
While the amplitude and zonal scale of the MJO may be explained by points (1) to (3) independently, it is also possible that several of these points combined may be necessary to fully understand the MJO's response to warming in the GISS model. Furthermore, we cannot discard the possibility that some of the results discussed here are unique to the GISS model, and that the MJO will respond differently in other GCMs. Nonetheless, results from this study indicate that linear theory can be a useful tool that can be used to understand how the MJO responds to climate change.
8. Concluding Remarks
Several questions arise from this study, in addition to several directions in which the analysis presented here could be extended:
Further research is needed to further understand how precipitation and column moisture covary. For example, determining if the convective moisture adjustment time scale, as defined here, is tied to the constraints on the global hydrological cycle may lead to insights on how the amplitude of the MJO is determined.
While we show that longwave radiative feedbacks weaken with increasing CO2, a quantitative analysis of how changes in upper‐tropospheric cloud cover and humidity affects this feedback was not performed.
It is unclear whether the humidity perturbations associated with MJO initiation are stochastiscally forced, or if they are forced by a signal. Future work may be able to shed some light as to how the initial amplitude of the MJO is determined.
Results from this study indicate that studying the MJO in simulations with different climates could provide a framework for testing and evaluating MJO theories. While only the moisture mode model of SM and AK16 was used in this study, other theoretical treatments of the MJO such as those discussed by Wang and Chen (2016) could be used. Using other theories may also provide useful insights on how the MJO responds to increasing CO2.
Many of the results here can be used for model intercomparison on how the MJO responds to climate change. In section 6, we showed that these changes in MJO propagation can be qualitatively understood in terms of four key parameters: the climatological‐mean column moisture, the convective moisture adjustment time scales, the gross dry stability, and the MJO's zonal scale. It would be interesting to see if these parameters can also describe changes in the MJO in other models, such as the suite from CMIP‐5 database.
Acknowledgments
This work was supported by National Aeronautics and Space Administration grant NNX13AM18G. The first author would like to thank Kuniaki Inoue and Nadir Jeevanjee for discussions that helped in the interpretation of some of the results in this manuscript. We also thank David Raymond and an anonymous reviewer for comments that have helped improve the contents of the manuscript. D. Kim was also supported by the Korea Meteorological Administration Research and Development Program under grant KMIPA 2016–6010 and the startup grant from the University of Washington. Model output and data used to create the plots in this paper can be downloaded from https://sites.google.com/view/afadames/supplements. For additional output from the version of the GISS model used here may be obtained by contacting Daehyun Kim at daehyun@uw.edu.
Appendix A. Calculation of Τc
The calculation of the convective moisture adjustment time scale τc follows the methods described by Sobel and Maloney (2012) and Adames et al. (2017). This method involves a linearization of equation (4) through a Taylor series expansion, truncating over the second term
| (A1) |
where the L subscript corresponds to a low‐frequency background, obtained through a 100 day low‐pass filter, and the primed terms are intraseasonal deviations from this background state. The second term defines the intraseasonal precipitation anomalies, which can be written as follows:
| (A2) |
where and we have approximated the column relative humidity anomalies as . With these approximations, τc takes on the form shown in equation (6). It was shown by Adames (2017) that using this definition yields estimates of the intraseasonal precipitation anomalies that are largely in agreement with satellite observations.
An alternate method of calculating τc involves finding the linear regression slope of a scatterplot of and P. The time scale obtained through this method is shown in Figure A1. The values are slightly larger, but still comparable to those obtained using equation (6). A slightly smaller trend of ∼ 4.4% K−1 is found this way, which is within the error margin of those obtained using equation (6).
We can also directly estimate τc by using the moisture‐precipitation curve as described by Bretherton et al. (2004), which involves evaluating the exponential curve in Figure 1c at a reference . We have used this method and found that τc varies widely depending on the reference value of moisture used (not shown). If the climatological‐mean is used, the resulting value of τc is nearly twice as long as those in Figures 2 and A1. However, if the value of that corresponds to the mean precipitation is used instead, then τc exhibits similar values to those shown in this study. Because of these wide variations, we regard the other two methods presented here as more reliable estimates of τc.
Figure A1.
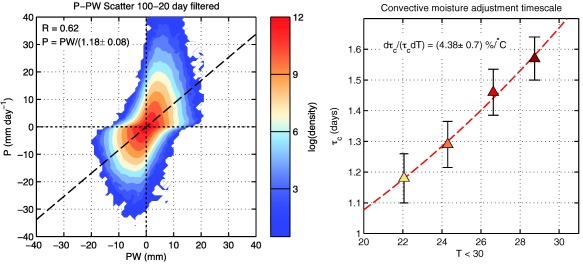
As in Figure 6 but showing precipitation and column moisture in the left plot and the convective moisture adjustment time scale estimated through linear regression , as in Jiang et al. (2016).
Appendix B. MSE Budget Over the Indian Ocean and Maritime Continent
In this section, we document the MSE budget for OLR anomalies regressed over the Indian Ocean (70°E–100°E, 10°N/S) and over the Maritime Continent (100°E–130°E, 10°N/S). Figure B1 shows the relative contribution to the maintenance and propagation of the rainfall anomalies for the regression maps centered over the Indian Ocean (top) and Maritime Continent (bottom). The results reveal notable difference to the regression maps centered over the western Pacific (Figure 5). For example, no clear change in the relative contribution of vertical MSE advection as surface temperature increase is seen neither for MJO maintenance or propagation in these two domains. However, when the budgets from all three regions are averaged together, shown in Figure B1, the same trends seen of Figure 5 are observed. Thus, the regressions centered over the central Pacific approximately represent the average MJO activity over the warm pool.
Figure B1.
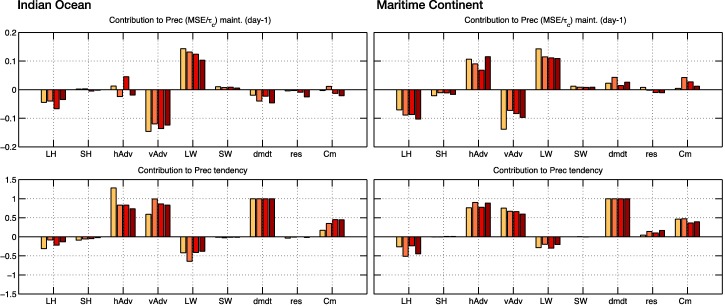
As in Figure 5 but showing the column‐integrated MSE budget of the MJO regressed over the Indian Ocean (70°E–100°E, 10°N/S, left plots) and over Maritime continent (100°E–130°E, 10°N/S, right plots).
Figure B2.
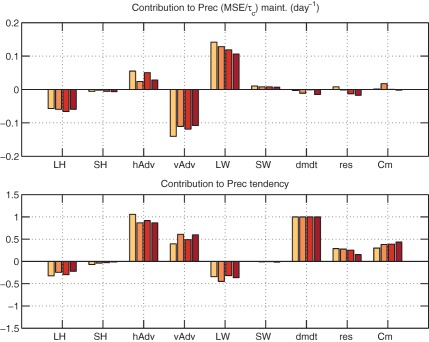
As in Figure 5 but for the average of regression maps centered over the Indian Ocean, Maritime Continent and western Pacific.
Appendix C. Correlation Between MJO Scale and Dissipation Lengthscale
In section 6, we found that the parameters and , which characterize free‐tropospheric dissipation, vary little with increasing CO2. Based on equations (11a) and (11b), this suggests that the MJO's mean zonal wave number varies in inverse proportion to the dissipation lengthscale , where c is the group velocity of free Kelvin waves, and ɛ is a free‐tropospheric Rayleigh dissipation coefficient, which can be thought as being the dissipation from processes such as convection. If we assume that is approximately constant with CO2 concentrations, as suggested by Figure 8b, then an expression that relates k and L can be obtained. For the four simulations analyzed here, it can be shown that . We can simplify equation (11a) (or similarly equation (11b), using ), and obtain the following expression for
| (C1) |
For values of L ranging from 9,000 km to 10,000 km, the MJO's zonal scale would range from 2.3 to 2.8, consistent with the results found by Adames et al. (2017). It can be argued that that ɛ does not significantly change with increasing CO2. If ɛ is defined as the Rayleigh dissipation imparted by small‐scale cloud processes such as cumulus entrainment rates, then it can be approximated as fixed within the temperature range analyzed here (see Singh & O'Gorman, 2013). Thus, is approximately covarying with changes in c. A similar relation for the MJO zonal scale was found by Yang and Ingersoll (2014). This relation may not be specific to the model of Yang and Ingersoll (2014), but could be generic to any MJO model in which the convection propagates slowly compared to the dry Kelvin and Rossby waves so that the wind field resembles the response to stationary heating.
We can test the robustness of equation (C1) by comparing the MJO's mean zonal wave number with the phase speed of dry Kelvin waves c. A comparison of and c is shown in Figure 1. A strong correspondence is observed. It is worth mentioning that equation (C1) can also approximate the scale of the MJO in observations, whereby using m yields , comparable to the value of obtained in AK16. Similar results were also found with a set of GISS model simulations with different parameters in the convective scheme. It is important to note that this correlation does not elucidate any physical processes that could cause L and to be correlated. Future work is required in order to understand if there is any physical basis behind this correlation.
Figure C1.
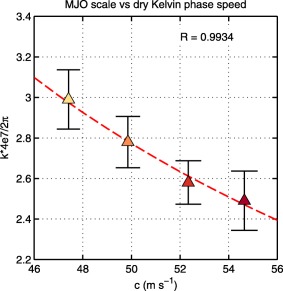
Scatterplot of the phase speed of free Kelvin waves c, calculated using equation (13) versus the zonal wave number of the MJO estimated in Adames et al. (2017). The correlation coefficient is shown in the top‐right corner. Error bars correspond to the uncertainty in the estimate of the MJO's scale.
Adames, Á. F. , Kim, D. , Sobel, A. H. , Del Genio, A. , & Wu, J. (2017). Characterization of moist processes associated with changes in the propagation of the MJO with increasing CO2 . Journal of Advances in Modeling Earth Systems, 9, 2946–2967. https://doi.org/10.1002/2017MS001040
References
- Adames, A. F. (2017). Precipitation budget of the Madden‐Julian Oscillation. Journal of Atmospheric Science, 74(6), 1799–1817. [Google Scholar]
- Adames, Á. F. , & Kim, D. (2016). The MJO as a dispersive, convectively coupled moisture wave: Theory and observations. Journal of Atmospheric Science, 73(3), 913–941. [Google Scholar]
- Adames, A. F. , Kim, D. , Sobel, A. H. , Genio, A. D. , & Wu, J. (2017). Changes in the structure and propagation of the MJO with increasing CO2 . Journal of Advances in Modeling Earth Systems, 9, 1251–1268. https://doi.org/10.1002/2017MS000913 [DOI] [PMC free article] [PubMed] [Google Scholar]
- Adames, Á. F. , & Wallace, J. M. (2015). Three‐dimensional structure and evolution of the moisture field in the MJO. Journal of Atmospheric Science, 72(10), 3733–3754. [Google Scholar]
- Adames, A. F. , Wallace, J. M. , & Monteiro, J. M. (2016). Seasonality of the structure and propagation characteristics of the MJO. Journal of Atmospheric Science, 73(9), 3511–3526. https://doi.org/10.1175/JAS-D-15-0232.1 [Google Scholar]
- Ahn, M.‐S. , Kim, D. , Sperber, K. R. , Kang, I.‐S. , Maloney, E. , Waliser, D. , & Hendon, H. (2017). MJO simulation in CMIP5 climate models: MJO skill metrics and process‐oriented diagnosis. Climate Dynamics, 49(11–12), 4023–4045. [Google Scholar]
- Andersen, J. A. , & Kuang, Z. (2012). Moist static energy budget of MJO‐like disturbances in the atmosphere of a zonally symmetric aquaplanet. Journal of Climate, 25(8), 2782–2804. [Google Scholar]
- Arnold, N. P. , Branson, M. , Kuang, Z. , Randall, D. A. , & Tziperman, E. (2015). MJO Intensification with warming in the superparameterized CESM. Journal of Climate, 28(7), 2706–2724. [Google Scholar]
- Arnold, N. P. , Kuang, Z. , & Tziperman, E. (2013). Enhanced MJO‐like variability at high SST. Journal of Climate, 26(3), 988–1001. [Google Scholar]
- Arnold, N. P. , & Randall, D. A. (2015). Global‐scale convective aggregation: Implications for the Madden‐Julian Oscillation. Journal of Advances in Modeling Earth Systems, 7, 1499–1518. https://doi.org/10.1002/2015MS000498 [Google Scholar]
- Betts, A. K. (1986). A new convective adjustment scheme. Part I: Observational and theoretical basis. Quarterly Journal of the Royal Meteorological Society, 112(473), 677–691. [Google Scholar]
- Betts, A. K., & Miller, M. (1986). A new convective adjustment scheme. Part II: Single column tests using GATE wave, BOMEX, ATEX and arctic air‐mass data sets. Quarterly Journal of the Royal Meteorological Society, 112(473), 693–709. [Google Scholar]
- Bretherton, C. S. , Peters, M. E. , & Back, L. E. (2004). Relationships between water vapor path and precipitation over the tropical oceans. Journal of Climate, 17(7), 1517–1528. [Google Scholar]
- Carlson, H. , & Caballero, R. (2016). Enhanced MJO and transition to superrotation in warm climates. Journal of Advances in Modeling Earth Systems, 8, 304–318. https://doi.org/10.1002/2015MS000615 [Google Scholar]
- Chang, C.‐W. J. , Tseng, W.‐L. , Hsu, H.‐H. , Keenlyside, N. , & Tsuang, B.‐J. (2015). The Madden‐Julian Oscillation in a warmer world. Geophysical Research Letters, 42, 6034–6042. https://doi.org/10.1002/2015GL065095 [Google Scholar]
- Chikira, M. (2014). Eastward‐propagating intraseasonal oscillation represented by Chikira‐Sugiyama cumulus parameterization. Part II: Understanding moisture variation under weak temperature gradient balance. Journal of Atmospheric Science, 71(2), 615–639. [Google Scholar]
- Duchon, C. E. (1979). Lanczos filtering in one and two dimensions. Journal of Applied Meteorology, 18(8), 1016–1022. [Google Scholar]
- Gill, A. E. (1980). Some simple solutions for heat‐induced tropical circulation. Quarterly Journal of the Royal Meteorological Society, 106(449), 447–462. [Google Scholar]
- Fuchs, T. , & Raymond, D. J. (2017). A simple model of intraseasonal oscillations. Journal of Advances in Modeling Earth Systems, 9, 1195–1211. https://doi.org/10.1002/2017MS000963 [Google Scholar]
- Held, I. M. , & Soden, B. J. (2006). Robust responses of the hydrological cycle to global warming. Journal of Climate, 19(21), 5686–5699. https://doi.org/10.1175/JCLI3990.1 [Google Scholar]
- Inoue, K. , & Back, L. E. (2015). Gross moist stability assessment during TOGA COARE: Various interpretations of gross moist stability. Journal of Atmospheric Science, 72(11), 4148–4166. [Google Scholar]
- Inoue, K. , & Back, L. E. (2017). Gross moist stability analysis. Part I: Assessment of satellite‐based products in the GMS plane. Journal of Atmospheric Science, 74(6), 1819–1837. [Google Scholar]
- IPCC (2013). Summary for policymakers (book section SPM, p. 130) Cambridge, UK: Cambridge University Press; https://doi.org/10.1017/CBO9781107415324.004 [Google Scholar]
- Jiang, X. , Waliser, D. E. , Xavier, P. K. , Petch, J. , Klingaman, N. P. , Woolnough, S. J. , … Zhu, H. (2015). Vertical structure and physical processes of the Madden‐Julian Oscillation: Exploring key model physics in climate simulations. Journal of Geophysical Research: Atmospheres, 120, 4718–4748. https://doi.org/10.1002/2014JD022375 [DOI] [PMC free article] [PubMed] [Google Scholar]
- Jiang, X. , Zhao, M. , Maloney, E. D. , & Waliser, D. E. (2016). Convective moisture adjustment time scale as a key factor in regulating model amplitude of the Madden‐Julian Oscillation. Geophysical Research Letters, 43, 10412–10419. https://doi.org/10.1002/2016GL070898 [Google Scholar]
- Jones, C. , & Carvalho, L. (2011). Will global warming modify the activity of the Madden‐Julian Oscillation? Quarterly Journal of the Royal Meteorological Society, 137(655), 544–552. [Google Scholar]
- Kim, D. , Ahn, M.‐S. , Kang, I.‐S. , & Del Genio, A. D. (2015). Role of longwave cloud‐radiation feedback in the simulation of the Madden‐Julian Oscillation. Journal of Climate, 28(17), 6979–6994. [Google Scholar]
- Kim, D. , Kug, J.‐S. , & Sobel, A. H. (2014). Propagating versus nonpropagating Madden‐Julian Oscillation events. Journal of Climate, 27(1), 111–125. [Google Scholar]
- Lau, W. K.‐M. , & Waliser, D. E. (2011). Intraseasonal variability in the atmosphere‐ocean climate system. Berlin: Springer. [Google Scholar]
- Liu, P. (2013). Changes in a modeled mjo with idealized global warming. Climate Dynamics, 40(3), 761–773. https://doi.org/10.1007/s00382-012-1323-2 [Google Scholar]
- Liu, P. , Li, T. , Wang, B. , Zhang, M. , Luo, J‐J. , Masumoto, Y. , … Roeckner, E. (2013). MJO change with a1b global warming estimated by the 40‐km echam5. Climate Dynamics, 41(3), 1009–1023. https://doi.org/10.1007/s00382-012-1532-8 [Google Scholar]
- Madden, R. , & Julian, P. (1971). Detection of a 40–50 day oscillation in the zonal wind in the tropical Pacific. Journal of Atmospheric Science, 28, 702–708. https://doi.org/10.1175/1520-0469(1971)028<0702:DOADOI>2.0.CO;2 [Google Scholar]
- Madden, R. , & Julian, P. (1972). Description of global scale circulation cells in the tropics with a 40–50 day period. Journal of Atmospheric Science, 29, 1109–1123. https://doi.org/10.1175/1520-0469(1972)029<1109:DOGSCC>2.0.CO;2 [Google Scholar]
- Maloney, E. D. , & Xie, S.‐P. (2013). Sensitivity of tropical intraseasonal variability to the pattern of climate warming. Journal of Advances in Modeling Earth Systems, 5, 32–47. https://doi.org/10.1029/2012MS000171 [Google Scholar]
- Matsuno, T. (1966). Quasi‐geostrophic motions in the equatorial area. Journal of the Meteorological Society of Japan, 44, 25–43. [Google Scholar]
- Neelin, J. D. , & Zeng, N. (2000). A quasi‐equilibrium tropical circulation model—Formulation. Journal of Atmospheric Science, 57(11), 1741–1766. [Google Scholar]
- Pritchard, M. S. , & Bretherton, C. S. (2014). Causal evidence that rotational moisture advection is critical to the superparameterized Madden‐Julian Oscillation. Journal of Atmospheric Science, 71(2), 800–815. [Google Scholar]
- Pritchard, M. S. , & Yang, D. (2016). Response of the superparameterized Madden‐Julian Oscillation to extreme climate and basic state variation challenges a moisture mode view. Journal of Climate, 29(7), 4995–5008. https://doi.org/10.1175/JCLI-D-15-0790.1 [Google Scholar]
- Raymond, D. J. (2001). A new model of the Madden‐Julian Oscillation. Journal of Atmospheric Science, 58(18), 2807–2819. [Google Scholar]
- Raymond, D. J. , & Fuchs, Ž. (2009). Moisture modes and the Madden‐Julian Oscillation. Journal of Climate, 22(11), 3031–3046. [Google Scholar]
- Raymond, D. J. , Sessions, S. L. , Sobel, A. H. , & Fuchs, Ž. (2009). The mechanics of gross moist stability. Journal of Advances in Modeling Earth Systems, 1, 9. https://doi.org/10.3894/JAMES.2009.1.9 [Google Scholar]
- Singh, M. S. , & O'gorman, P. A. (2013). Influence of entrainment on the thermal stratification in simulations of radiative‐convective equilibrium. Geophysical Research Letters, 40, 4398–4403. https://doi.org/10.1002/grl.50796 [Google Scholar]
- Sobel, A. , & Maloney, E. (2012). An idealized semi‐empirical framework for modeling the Madden‐Julian Oscillation. Journal of Atmospheric Science, 69(5), 1691–1705. [Google Scholar]
- Sobel, A. , & Maloney, E. (2013). Moisture modes and the eastward propagation of the MJO. Journal of Atmospheric Science, 70(1), 187–192. [Google Scholar]
- Sobel, A. H. , & Bretherton, C. S. (2000). Modeling tropical precipitation in a single column. Journal of Climate, 13(24), 4378–4392. [Google Scholar]
- Sobel, A. H. , Nilsson, J. , & Polvani, L. M. (2001). The weak temperature gradient approximation and balanced tropical moisture waves. Journal of Atmospheric Science, 58(23), 3650–3665. [Google Scholar]
- Soden, B. J. , & Held, I. M. (2006). An assessment of climate feedbacks in coupled ocean? Atmosphere models. Journal of Climate, 19(14), 3354–3360. https://doi.org/10.1175/JCLI3799.1 [Google Scholar]
- Song, E.‐J. , & Seo, K.‐H. (2016). Past‐ and present‐day Madden‐Julian Oscillation in cnrm‐cm5. Geophysical Research Letters, 43, 4042–4048. https://doi.org/10.1002/2016GL068771 [Google Scholar]
- Subramanian, A. , Jochum, M. , Miller, A. J. , Neale, R. , Seo, H. , Waliser, D. , & Murtugudde, R. (2014). The MJO and global warming: A study in CCSM4. Climate Dynamics, 42(7–8), 2019–2031. [Google Scholar]
- Wang, B. , & Chen, G. (2016). A general theoretical framework for understanding essential dynamics of Madden‐Julian Oscillation. Climate Dynamics, 49(7–8), 2309–2328. https://doi.org/10.1007/s00382-016-3448-1 [Google Scholar]
- Wolding, B. O. , Maloney, E. D. , & Branson, M. (2016). Vertically resolved weak temperature gradient analysis of the Madden‐Julian Oscillation in SP‐CESM. Journal of Advances in Modeling Earth Systems, 8, 1586–1619. https://doi.org/10.1002/2016MS000724 [Google Scholar]
- Wolding, B. O. , Maloney, E. D. , Henderson, S. , & Branson, M. (2017). Climate change and the Madden‐Julian Oscillation: A vertically resolved weak temperature gradient analysis. Journal of Advances in Modeling Earth Systems, 9, 307–331. https://doi.org/10.1002/2016MS000843 [Google Scholar]
- Yang, D. , & Ingersoll, A. P. (2014). A theory of the MJO horizontal scale. Geophysical Research Letters, 41, 1059–1064. https://doi.org/10.1002/2013GL058542 [Google Scholar]
- Zhang, C. (2005). Madden‐Julian Oscillation. Reviews of Geophysica, 43, RG2003. https://doi.org/10.1029/2004RG000158 [Google Scholar]
- Zhang, C. (2013). Madden‐Julian oscillation: Bridging weather and climate. Bulletin of the American Meteorological Society, 94(12), 1849–1870. [Google Scholar]


