

Abstract
The structural and functional integrity of subgenual cingulate area 25 (A25) is crucial for emotional expression and equilibrium. A25 has a key role in affective networks, and its disruption has been linked to mood disorders, but its cortical connections have yet to be systematically or fully studied. Using neural tracers in rhesus monkeys, we found that A25 was densely connected with other ventromedial and posterior orbitofrontal areas associated with emotions and homeostasis. A moderate pathway linked A25 with frontopolar area 10, an area associated with complex cognition, which may regulate emotions and dampen negative affect. Beyond the frontal lobe, A25 was connected with auditory association areas and memory-related medial temporal cortices, and with the interoceptive-related anterior insula. A25 mostly targeted the superficial cortical layers of other areas, where broadly dispersed terminations comingled with modulatory inhibitory or disinhibitory microsystems, suggesting a dominant excitatory effect. The architecture and connections suggest that A25 is the consummate feedback system in the PFC. Conversely, in the entorhinal cortex, A25 pathways terminated in the middle-deep layers amid a strong local inhibitory microenvironment, suggesting gating of hippocampal output to other cortices and memory storage. The graded cortical architecture and associated laminar patterns of connections suggest how areas, layers, and functionally distinct classes of inhibitory neurons can be recruited dynamically to meet task demands. The complement of cortical connections of A25 with areas associated with memory, emotion, and somatic homeostasis provide the circuit basis to understand its vulnerability in psychiatric and neurologic disorders.
SIGNIFICANCE STATEMENT Integrity of the prefrontal subgenual cingulate cortex is crucial for healthy emotional function. Subgenual area 25 (A25) is mostly linked with other prefrontal areas associated with emotion in a dense network positioned to recruit large fields of cortex. In healthy states, A25 is associated with internal states, autonomic function, and transient negative affect. Constant hyperactivity in A25 is a biomarker for depression in humans and may trigger extensive activation in its dominant connections with areas associated with emotions and internal balance. A pathway between A25 and frontopolar area 10 may provide a critical link to regulate emotions and dampen persistent negative affect, which may be explored for therapeutic intervention in depression.
Keywords: connectome, cortical systematic variation, inhibitory neurons, mood disorders, subgenual cingulate, tract-tracing
Introduction
Area 25, found deep in the ventral and posterior aspect of the subgenual cingulate region of the ventromedial prefrontal cortex (vmPFC), has a significant role in emotion and visceromotor function (Drevets et al., 2008a,b; Hamani et al., 2011; Myers-Schulz and Koenigs, 2012; Gold, 2015; Palomero-Gallagher et al., 2015). Classical studies have shown that stimulation of A25 elicits changes in autonomic function (Kaada et al., 1949; Showers and Crosby, 1958), consistent with its dense projections to the hypothalamus (Nauta, 1971; Ongür et al., 1998; Rempel-Clower and Barbas, 1998) and brainstem monoaminergic systems (Freedman et al., 2000; Chiba et al., 2001). These structures have global effects on the brain and somatic states, such as the stress response.
Unlike most of the PFC, A25 has both a very strong sender and receiver relationship with the amygdala (Ghashghaei et al., 2007), which is associated with affective states and projects to autonomic structures as well (Sah et al., 2003; Salzman and Fusi, 2010; Pessoa, 2017). Further, A25 receives direct input from the hippocampus (Rosene and Van Hoesen, 1977; Barbas and Blatt, 1995; Insausti and Muñoz, 2001), a region known for its essential role in long-term and contextual memory (for review, see Murray and Wise, 2010; Schiller et al., 2015), and heavily innervates the ventral striatum, associated with motivation and reward-driven behavior (Heimer and Van Hoesen, 2006; Heilbronner et al., 2016). Dysfunction of A25 is associated with psychiatric disorders characterized by abnormal affect and emotional expression. Accordingly, accumulating evidence has highlighted a role of A25 in major depression, accompanied by functional and morphological pathology (Mayberg, 1997; Drevets, 2001; Mayberg et al., 2005; Drevets et al., 2008a).
Despite the involvement of A25 in vital autonomic systems and its relevance for affective processes, its cortical connections have yet to be investigated systematically. Limited information on the cortical connections of A25 has been obtained incidentally from studies with a focus elsewhere (for review, see Hamani et al., 2011; Yeterian et al., 2012), leaving several questions unaddressed. Which cortical areas are connected with A25, and what are their relative strengths? Do these pathways interact with specific cortical layers in a systematic way and within functionally distinct local environments of inhibitory neurons? We addressed these questions at the areal and laminar level in rhesus monkeys. What emerges is a comprehensive and quantitatively based cortical map at high resolution that positions A25 within the substrate circuitry for interoception, emotion, and memory, and provides insight into the circuitry that becomes disrupted in psychiatric and neurologic diseases.
Materials and Methods
Experimental design and statistical analysis overview
Figure 1 depicts the experimental design. The goal was to map the cortical pathways of A25 in rhesus monkeys and investigate their laminar pattern of connections. To map incoming and outgoing pathways of A25, we injected four distinct neural tracers in medial or orbital A25 (Table 1). The tracers labeled neurons (incoming) and boutons (outgoing) in cortical areas connected with the injection site (Fig. 1A). The extent of each injection site was reconstructed from serial coronal sections, as described in Results.
Figure 1.

Experimental design. A, Bidirectional tracer transport to study connections. B, Exhaustive mapping of tracer-labeled neurons in sections of cortex, a small portion of which is depicted by the thick black outline. Arrowhead indicates a BDA neuron visualized with DAB. Scale bar, 250 μm. C, Strategy for unbiased, systematic stereologic sampling in cortical areas of interest (thick black outline) to quantify density of tracer-labeled terminations (axon boutons) from A25. Terminations in blank squares are not counted. Arrowheads indicate BDA boutons visualized with DAB. Scale bar, 75 μm. D, Schematic depicts five different cortical types based on architectural differences. Agranular areas are three layered cortices with poorly defined lamination, whereas eulaminate II+ depicts areas with the highest level of laminar definition within areas with label in this study.
Table 1.
Cases and neural tracers used
| Case | Sex | Age | Hemi | Injection site | Tracer | Analysis |
|---|---|---|---|---|---|---|
| BP | Female | 3.5 | Left | Anterior orbital | FB | Retrograde |
| BR | Female | 3 | Left | Posterior medial | BDA | Bidirectional |
| BS | Female | 3.5 | Left | Anterior medial | LY | Bidirectional |
| BU | Male | 4 | Right | Anterior orbital | FE | Bidirectional |
| BB | Female | — | Right | NA | NA | Nissl and SMI-32 (areal architecture) |
| AN | — | — | Right | NA | NA | Nissl, SMI-32, and myelin (areal architecture) |
| AQ | — | — | Right | NA | NA | Nissl and SMI-32 (areal architecture) |
The rhesus monkeys were young adult (age 3–4 years old, n = 4, 3 female). Cortical connections in this species are already in place within the first postnatal year in visual as well as prefrontal cortices (Goldman and Nauta, 1977; Schwartz and Goldman-Rakic, 1991; Rodman, 1994). White matter changes continue until ∼4 years (Malkova et al., 2006) and may be associated with the protracted myelination in primates (Yakovlev and Lecours, 1967). After perfusion and coronal sectioning of each brain, we used systematic sampling of coronal series to map labeled neurons by cortical area in the entire cortex using exhaustive plotting (Fig. 1B; n = 42–88 sections/case; the sampling rate was determined by case based on labeling distribution). Cortical areas were parcellated using matched series stained with architectural markers (n = 3, 1 female; Table 1). We used the coronal plots from each section to compute labeled neuron density for each cortical area. We then used the normalized densities from sections to reconstruct detailed quantitative maps on the brain surfaces for each case; this method allowed direct comparison across cases.
Because cortical connections are reciprocal but differ across directions in strength and laminar distribution, we also quantified several complementary outgoing pathways through quantitative analysis of bouton density from A25 axons in areas of interest that had moderate or heavy label. We used unbiased stereologic methods (Fig. 1C) to map the distribution of axon boutons and categorize them as small or large (n = 3–17 sections/area, based on pilot studies).
We then tested whether differences in the laminar distribution of connections across areas were systematic. This analysis is based on a theoretical framework that relates connections to the structural relationship of the linked areas (Barbas and Rempel-Clower, 1997). This framework is based on the systematic laminar variation of the cortical mantle to assign areas into cortical types based on their laminar structure. Figure 1D depicts a schematic of cortical types. The simplest structural type is “agranular,” which describes areas that lack layer IV. Dysgranular includes areas that have an incipient layer IV. Eulaminate areas have six cortical layers but can vary by the thickness of layer IV as well as the distinction of the other layers. Thus, even though there are many cortical areas, they can be reduced to a low dimension by cortical type across the entire cerebral cortex (for review, see Barbas, 2015). We used ANOVA (or nonparametric version) and linear regression to detect trends in the laminar pattern of connections based on cortical type. We conducted analyses across cases, as well as for individual cases to investigate the generality of the findings (for further details of statistical analyses and approach, see below and Results).
Finally, multiple labeling methods allowed qualitative analysis of the overlap of A25 terminations with neurochemically and functionally distinct classes of inhibitory neurons in primates. To differentiate inhibitory neuron populations, we used the calcium binding proteins parvalbumin (PV), calbindin (CB), and calretinin (CR), which label largely nonoverlapping neurochemical classes of inhibitory neurons in primates (DeFelipe, 1997).
Surgery, tracer injection, and tissue processing
Experiments were conducted on 7 rhesus monkeys (Macaca mulatta, 3–4 years, n = 4 female) for tracing, architectonic parcellation, and photography (Table 1). Experiments were conducted according to the National Institutes of Health Guide for the care and use of laboratory animals (publication 80–22 revised, 1996). Protocols were approved by the Institutional Animal Care and Use Committee at Boston University School of Medicine, Harvard Medical School, and New England Primate Research Center. Procedures were designed to minimize animal suffering. In all cases, injections of multiple distinct tracers were placed in each case to address questions in this and other studies, to reduce the number of animals needed for research.
We first obtained high-resolution MRI scans on animals sedated (ketamine hydrochloride, 10–15 mg/kg, i.m.), anesthetized (propofol, loading dose 2.5–5 mg/kg, i.v.; continuous infusion rate 0.25–0.4 mg/kg/min), and placed in a stereotaxic apparatus (1430M; David Kopf Instruments). MRI scans were used to calculate stereotaxic coordinates using the interaural line as reference for injection of neural tracers.
We performed surgery under general anesthesia (isoflurane, to a surgical level) with continuous monitoring of vital signs. We injected one tracer in each monkey, as shown in Table 1. The dyes injected included: Fast Blue (FB, Case BP, 3% dilution, 2 μl; Polysciences), biotinylated dextran amine (BDA, Case BR, equal parts 10% 10 kDA and 10% 3 kDA, 5 μl; Invitrogen), Lucifer yellow (LY, Case BS, 10% dilution, 4 μl, 10 kDA; Invitrogen), and Fluoroemerald (FE, Case BU, fluorescein dextran/Oregon Green, equal parts 10% 10 kDA and 10% 3 kDA, 5 μl; Invitrogen). The 10 kDA dextran amine (BDA, LY, FE) variant is optimal for labeling axonal terminations, whereas the 3 kDA variant is optimal for labeling cell bodies and proximal dendrites (Veenman et al., 1992; Richmond et al., 1994; Reiner et al., 2000). Mixing molecular weight variants allows for bidirectional tracing, whereas FB is only a retrograde tracer. To avoid dye leakage along the needle trajectory, we loaded needles with a small bubble of air after aspiration of the dye and left the syringe at the site of injection for 5–10 min to allow local diffusion and prevent backward suction of the dye during needle withdrawal. Animals were monitored postoperatively and given antibiotics and analgesics.
After a survival period of 18–20 d, the animals were anesthetized with a lethal dose of sodium pentobarbital (∼50 mg/kg, i.v., to effect) and perfused transcardially with 4% PFA and 0.2% glutaraldehyde in 0.1 m PBS, pH 7.4 (Cases BP, BR, BS, BU) or 4% PFA in cacodylate buffer in 0.1 m at pH 7.4 (Cases AN, AQ, BB). The brains were removed, photographed, cryoprotected in ascending concentrations of sucrose solutions (10%–25% sucrose in 0.1 m PBS, pH 7.4, with 0.05% sodium azide; Sigma-Aldrich), frozen in −80°C isopentane (Rosene et al., 1986), and sectioned on a freezing microtome (AO Scientific Instruments/Reichert Technologies) in 50 μm coronal sections (40 μm for Cases AN, AQ, BB). Sections were collected systematically into 10 matched series and stored in antifreeze (30% ethylene glycol, 30% glycerol, 0.05% sodium azide in 0.05 m phosphate buffer, pH 7.4). One of the 10 series was mounted directly from the microtome blade onto gelatin-coated slides and placed in cold storage (4°C) for mapping labeled neurons directly using epifluorescence, as described previously (Barbas et al., 2005).
Visualization and imaging of markers of interest
To visualize tracers for mapping and quantification, we began with an immunohistochemistry protocol for two tracers (LY, FE). Free-floating sections were rinsed in 0.1 m phosphate buffer and incubated in 0.01 m sodium citrate buffer (pH 8.5, 80°C, 30 min) for antigen retrieval (Jiao et al., 1999). Sections were incubated in 0.05 m glycine (4°C, 1 h) to bind free aldehydes, and then in 0.3% H2O2 in 0.01 m PBS (30 min) to quench endogenous peroxidases. Sections were preblocked (1 h, 4°C) in 5%–10% NGS (Vector Laboratories), 5%–10% BSA (Sigma-Aldrich), 0.1%–0.2% BSA-C (Aurion), and 0.2%–0.4% Triton-X (Sigma-Aldrich) in 0.01 m PBS. Primary antibodies (LY, FE: rabbit polyclonal, 1:800, RRID:AB_2536190 and RRID:AB_221562, respectively) were incubated overnight (4°C) in antibody stock solution (1% NGS, 1% BSA, 0.1% BSA-C, and 0.1% Triton-X in 0.1 m PB). Tissue was then incubated (3 h, room temperature) in a biotin-conjugated goat anti-rabbit secondary antibody (1:200 in antibody stock solution, RRID:AB_2313606). Antibody penetration was enhanced during incubation steps by runs in a temperature-controlled variable wattage microwave oven (6–8 min, 150 W, 4°C; Pelco Biowave with ColdSpot and ThermoCube; Ted Pella). Sections were then incubated in AB HRP (Vectastain Elite ABC kit, Vector Laboratories, diluted 1:100 in 0.01 m PBS) and visualized via the immunoperoxidase reaction using DAB (1–3 min, DAB substrate kit, Vector Laboratories). For the BDA injection (Case BR), sections underwent antigen retrieval, glycine incubation, H2O2 incubation, AB-HRP incubation, and finally DAB.
Sections were then mounted on gelatin-coated glass slides, dried, counterstained with Nissl (thionin stain, every other section) as previously described (García-Cabezas et al., 2016), and coverslipped with Entallan (Sigma-Aldrich). In the fourth case with an injection of FB, sections were mounted from the microtome blade, dried, coverslipped with Krystalon (Millipore), and labeled neurons were mapped directly using epifluorescence.
To process tissue for architectural markers used to further aid cortical parcellation, and for photography (Cases AN, AQ, BB), full series were stained with thionin as described above, myelin (Gallyas, 1979; Zikopoulos et al., 2016; García-Cabezas et al., 2017), or with an antibody for SMI-32 (mouse monoclonal, 1:5000, Sternberger Monoclonals).
To view overlap of tracers (BDA, FE) and inhibitory neurons (PV, CB, or CR; Cases BR, BU), we used double- or single-labeling immunohistochemistry in matched sections. Sections underwent antigen retrieval, glycine incubation, preblock incubation, and were placed in primary antibody (FE, as above; PV, CB, CR: mouse monoclonal, 1:200, RRID:AB_10000343, RRID:AB_10000347, RRID:AB_10000320, 40–48 h incubation), as described above. Sections were placed in secondary antibodies (FE: AlexaFluor-488 goat anti-rabbit, 1:100, RRID:AB_143165; PV, CB, CR: AlexaFluor-647 goat anti-mouse 1:100, RRID:AB_141693, 20–24 h incubation), and BDA was amplified using an ABC kit before sections were incubated in fluorescently conjugated streptavidin (Streptavidin 647, catalog #S32357, Invitrogen, 20–24 h incubation). Sections were washed, dried, and coverslipped using Fluorosave (Calbiochem).
Sections that were processed for tracers and inhibitory neurons were imaged on a laser-scanning confocal microscope (Axio Observer Z1, LSM 880, Carl Zeiss) at 200× using a z-stack tiling function (Zen 2.1 package, RRID:SCR_013672). FE was visualized with a 488 nm argon laser (Zeiss); inhibitory neurons and BDA were visualized with a 633 helium neon laser (Zeiss). Tiling effects were minimized by stitching algorithms (Zen Blue 2.1). Images were superimposed to show all four labeled populations (PV, CB, CR, and tracer terminations) and pseudocolored using Adobe Photoshop (RRID:SCR_014199) and ImageJ (RRID:SCR_003070) (Rasband, 1997–2014).
For colocalization analysis of tracers with VAChT (for control experiments) or vesicular glutamate transporters (VGLUT1, VGLUT2), we used double-labeling immunofluorescence. Antibodies for tracers (BDA: ABC amplification with Streptavidin 647, as above; FE: rabbit polyclonal, as above, and goat anti-rabbit 488 Fab, 1:100, RRID:AB_2338058) were coincubated with an antibody for VAChT (rabbit anti-VAChT, 1:2000, Phoenix Pharmaceuticals, H-V005; secondary, Case BU: AlexaFluor-405 goat anti-rabbit 1:100 RRID:AB_221605, secondary, Case BR: AlexaFluor-488 goat anti-rabbit 1:100) and otherwise processed as above. For VGLUTs, antibodies for tracers (as above) were coincubated with VGLUT1 and VGLUT2 antibodies (rabbit anti-VGLUT1 or VGLUT2, 1:2000, RRID:AB_2315551 and RRID:AB_2315569, respectively; then biotinylated goat anti-rabbit Fab, 1:200, RRID:AB_2337971; then Streptavidin 647, as above), using a protocol we have described previously (Timbie and Barbas, 2015). Stacks were obtained using laser-scanning confocal microscopy at 630×. VAChT was visualized with a 405 nm diode laser (Zeiss), and green and far red fluorophores were visualized using the lasers described above. Colocalization analysis was performed using ImageJ and Reconstruct (RRID:SCR_002716) (Fiala, 2005).
Brightfield photography was obtained via an Olympus optical microscope (BX51) with a CCD camera (Olympus DP70) connected to a commercial imaging system (DP Controller, Olympus). Figures were assembled in Adobe Illustrator CC software (RRID:SCR_010279). Brightness, contrast, and saturation adjustments were made overall without retouching.
Pathway mapping and data analysis
Mapping incoming pathways to A25.
We used exhaustive plotting to map cortical pathways directed to A25 in a series of coronal sections through the entire cortex (Fig. 1B). In 3 cases (BP, BS, BU), we examined a half series of coronal sections through the ipsilateral hemisphere (1 in every 20 sections: a total of 42–49 sections spaced at 1 mm), and in the fourth case (BR), we examined a full series (1 in every 10 sections: 88 sections spaced at 500 μm). In each series, we mapped all labeled cortical neurons at 200× using brightfield (BR, BS, BU) or epifluorescence (BP) microscopy and a semiautomated commercial system (Neurolucida, RRID:SCR_001775; Olympus BX60). Labeled neurons were included in one of two laminar categories: superficial (layers II–III) or deep (layers V–VI), according to the lower boundary of layer III.
To place architectonic borders, we used Nissl-counterstained sections (thionin) from each mapped series and compared them with SMI-32 or Nissl series from other cases (AN, AQ), according to the prefrontal map of Barbas and Pandya (1989). We used several maps to determine architectonic boundaries for regions with label outside the PFC. For medial temporal areas (areas 28, 35, 36, TH, TF), we relied on maps from previous studies (Suzuki and Amaral, 2003; Saleem et al., 2007), with some modifications, mainly not subdividing TF, based on the extent of label in our material. We adhered to temporal pole nomenclature as previously described (Rempel-Clower and Barbas, 2000; Höistad and Barbas, 2008). We parcellated the superior temporal gyrus (STG) and STS according to previous maps (Pandya and Sanides, 1973; Seltzer and Pandya, 1978; Galaburda and Pandya, 1983; Barbas et al., 1999; Medalla and Barbas, 2014). Areas Ts3, PaAlt, and Tpt overlap with parabelt and belt areas (Hackett et al., 1998). We parcellated the posterior cingulate, retrosplenial areas, and area prostriata based on previous maps (Morris et al., 1999; Morecraft et al., 2000, 2004; Ding et al., 2003; Ding, 2013).
We used the parcellated raw plot of each coronal section to compute the pathway density for every cortical area present on a section (number of labeled projection neurons divided by surface area sampled). Densities were log-transformed, in accord with reports that the strength of corticocortical connections tends to be distributed lognormally, being either very dense or sparse to absent (Scannell et al., 2000; Hilgetag et al., 2016). For each case, the range of log-density was divided equally into six bins and each was assigned a color (weakest connections, coldest color; strongest connections, warmest color), producing coronal heatmaps according to the density of labeled neurons in each cortical area.
The heatmaps from individual coronal sections were then reconstructed topographically on the medial, lateral, and basal surfaces using photographs with the sulcal morphology in each case. This method produced a unique heatmap of the cortical connections of A25 for each case at the resolution of single sections. The normalization approach allowed each case to be its own control, in view of likely variation across cases in the size of injection sites, tracer transport dynamics, and immunolabeling, even when identical procedures are used.
We then overlaid dots representing a scaled number of counted labeled neurons on each heatmap, to create a topographic histogram. Scaling was performed by a factor appropriate for the order of magnitude of each injection (1 dot: 5 neurons, Case BR; 10 neurons, Case BS; 100 neurons, Cases BP, BU). The figures thus convey both relative density and absolute magnitude of each pathway, as well as the injection sites, whose volume was estimated using the Cavalieri method (Howard and Reed, 1998).
To compare laminar characteristics of pathways within and across cases, we aggregated labeled neurons across sections for each cortical area in each case. Pathways ranging from dense to light were included for the laminar analysis when present in at least 3 cases, and if within each case the cortical area in aggregate contained >20 labeled neurons, as previously described (Hilgetag et al., 2016), and >0.2% of the total cortical neurons per case. We combined labeled neurons across some similar and neighboring areas (e.g., areas PaI/Ia/Id; areas 24a/medial periallocortex [MPAll]; areas 25/32). This approach made it possible to include light but consistent pathways while excluding pathways that were too sparse to allow reliable laminar analysis of label. We expressed laminar specificity as the percentage of labeled neurons originating in the upper layers (II–III). Percentages were averaged across cases and expressed with SEM. We also analyzed data from each case separately to test the consistency of the findings.
Quantifying outgoing pathways from A25.
We used unbiased stereologic methods (Fig. 1C) to quantify A25 terminations (boutons) in cortical areas across a range of systems, including prefrontal (areas 32, 10, orbital 12), auditory association areas of the superior temporal region (areas Ts1–3, TAa), polymodal areas of the superior temporal sulcus (areas TPO, PGa, IPa), and medial temporal areas (areas 28, 35, 36, TH, TF).
We performed stereology using the optical fractionator method via a semiautomated commercial system (StereoInvestigator, RRID:SCR_002526; Olympus BX60). The optical fractionator method extrapolates a density for the region of interest based on section thickness and systematic sampling at regular intervals (Howard and Reed, 1998). We used a disector of 50–75 μm2, a grid size of 274–450 μm2, and a disector height of 6–11 μm with a guard zone of 2 μm at the top and bottom of each section. This sampling rate yielded a coefficient of error <10%, as recommended (Gundersen, 1986). Boutons were counted at 1000× with oil immersion. We systematically sampled the entirety of each area in every 20th section (spaced at 1 mm interval) through the auditory STG (10–12 sections), polymodal STS (8–11 sections), agranular medial temporal lobe (MTL; 12–17 sections), dysgranular MTL (12–16 sections), area 10 (3–4 sections), orbital area 12 (7–11 sections), and mid-to-posterior area 32 (3 sections).
We computed the density of terminations separately for laminar groups and expressed data as percentage of boutons found in the superficial layers (I–III). Boutons were counted as either large (largest diameter >1 μm) or small (<1 μm) and expressed as a percentage of large boutons per pathway, as described previously (Bunce and Barbas, 2011). Percentages were averaged across cases and expressed with SEM.
Statistical analysis of laminar data.
We averaged the percentage of neurons or boutons found in the superficial layers across cases for each pathway direction. We tested for normality using the Shapiro–Wilk test and for homoscedasticity using the Levene Statistic to determine whether parametric or nonparametric tests were appropriate. For laminar specificity of pathways to A25, we used a Jonckheere–Terpstra test to determine whether variance could be explained by architectonic type. For laminar specificity of pathways from A25, we used a one-way ANOVA with post hoc Tukey test to determine whether the variance could be explained by architectonic type. We also performed linear regressions for each direction of pathways to test whether cortical type is associated with the proportion of neurons or boutons found in the superficial layers. Regressions were performed by cortical type on cortical areas pooled across cases and also for each case separately to study individual variability. We used the Kruskal–Wallis H test to determine whether the variance in the proportion of large boutons could be explained by cortical type or pathway. Significance was set at p = 0.05. Descriptive statistics and analysis were performed using SPSS (RRID:SCR_002865).
Controls
We used neuroanatomic and analytical controls to determine whether any labeling could be attributed to inadvertent invasion of unintended structures en route to the deeply situated A25. In the posterior medial A25 injection (Case BR), we controlled for impingement on cholinergic fibers arising from the caudally situated cholinergic nuclei. We used double immunohistochemical labeling to test for possible colocalization of the tracer and the VAChT in A32, which is heavily innervated by cholinergic nuclei in the basal forebrain (Mesulam et al., 1983; Ghashghaei and Barbas, 2001). We found no evidence that neural tracer terminations in A32 colocalized with VAChT (ImageJ, ColocalizeRBG plugin).
In the anterior medial A25 injection (BS), a small number of labeled neurons were found in layer V of motor-related cortex (areas 6DC, 6Va, SMA, and 4), sensory cortex (gustatory cortex, areas 1, 2, and 3), and parietal cortex (areas PE, PF, and PG). This labeling was not seen in the other cases in this study, or in incidental connections of A25 reported previously (Mesulam et al., 1977; Pandya and Seltzer, 1982; Petrides and Pandya, 1984; Cavada and Goldman-Rakic, 1989; Bates and Goldman-Rakic, 1993; Barbas et al., 1999; Morecraft et al., 2004, 2012). Moreover, these areas showed no labeled A25 terminations in any layers, a pattern inconsistent with reciprocal corticocortical connections and transport by bidirectional tracers. Because the neurons were found in layer V with an absence of labeled terminations, we concluded that the above label was due to spread of dye to some fibers leading to the striatum; thus, these neurons were not included in the analysis.
Areas 9 and pre-SMA were excluded from the laminar analyses because they are situated along the needle trajectory, and we could not rule out the possibility of a small amount of tracer seepage during retraction of the needle from the ventrally positioned A25. Reported connections of pre-SMA (Pandya and Kuypers, 1969; Morecraft et al., 2012) and lateral area 9 (Barbas and Pandya, 1989; Barbas et al., 1999) do not include A25.
Finally, in immunohistochemical protocols, primary antibodies were omitted in control sections of tissue, which showed no labeling.
Results
Architecture and parcellation of A25
In primates, A25 is located in the most ventral and posterior part of the vmPFC, in the subgenual cingulate region (SGC) found below the genu of the corpus callosum. The SGC includes A25 and a strip of areas 24a and the MPAll. Figure 2 shows coronal sections through A25 stained with Nissl (top) and with SMI-32 and myelin (bottom). Anterior A25 extends from the medial wall over the tip of the gyrus rectus, past the olfactory sulcus, and toward the border of area 13 (Fig. 2A). As the anterior olfactory nucleus fuses with the orbital cortex, it marks the orbital boundary of posterior A25 (Fig. 2C) (García-Cabezas and Barbas, 2014).
Figure 2.

Architecture of A25. A, Nissl-stained coronal section through anterior A25 (Case BB). B, Higher-magnification inset of anterior medial A25. C, Nissl-stained coronal section through mid-level A25. D, Nissl-stained coronal section through posterior A25. E, Higher-magnification inset of posterior medial A25. F, Coronal section stained for SMI-32 through anterior A25 and area 13 (Case BB). Gray arrowhead indicates the transition from A25 to area 13. G, Higher-magnification inset of anterior orbital A25. H, Higher-magnification inset of area 13. Black arrowheads indicate the increase in SMI-32-labeled neurons and processes in layer III of area 13. I, Coronal section stained for myelin through anterior A25 and area 13 (Case AN). Gray arrowhead indicates the transition from A25 to area 13. J, Higher-magnification inset of anterior orbital A25. K, Higher-magnification inset of area 13. Black arrowheads indicate the increase in myelin labeling in area 13 layers III–VI. Scale bars: regional photomicrographs, 1 mm; column insets, 250 μm. All, Allocortex; aon, anterior olfactory nucleus; cc, corpus callosum; cd, caudate; gr, gyrus rectus; lot, lateral olfactory tract; mo, medial orbital sulcus; OPAll, orbital periallocortex (agranular); OPro, orbital proisocortex (dysgranular); o, olfactory sulcus; WM, white matter; 25m, medial A25; 25o, orbital A25.
A25 is a dysgranular type of cortex (Barbas and Pandya, 1989), with a thin layer IV at its anterior extent (Fig. 2B) that is even sparser at its posterior extent (Fig. 2E). Layers II/III and V/VI appear, respectively, fused and their internal boundaries are difficult to parse. Effectively, this produces a minimally layered cortex with layers I, II/III, V/VI, and a sparse layer IV. Among prefrontal cortices, A25 stands out by a distinctively dense band of layer V-VI neurons (Dombrowski et al., 2001), especially compared with the upper cellular layer II/III (Fig. 2A,C,D).
On the orbital surface, anterior A25 abuts dysgranular area 13. The boundary between A25 and area 13 can be discerned with the SMI-32 marker (Fig. 2F), a nonphosphorylated intermediate neurofilament protein that labels pyramidal projection neurons prominently in layers III and V (Campbell et al., 1991; Barbas and García-Cabezas, 2015, 2016), or a myelin stain (Fig. 2I). Both SMI-32 and myelin are sparse in A25 (Fig. 2G,J). As the cortex winds onto the orbital surface past the olfactory sulcus, these two markers help to identify the transition to area 13. The border is determined by a prominent increase in SMI-32 neurons in layer III (Fig. 2H) and higher myelin content in layers III–VI in area 13 (Fig. 2K).
The orbital extent of A25 has been considered as a caudal part of area 14 in some maps (Preuss and Goldman-Rakic, 1991; Carmichael and Price, 1994), based on the map of Walker (1940). However, Walker's map did not extend into the most posterior part of the vmPFC. Orbital A25 has also been called POdg in another study, consistent with the type of cortex in this region and its continuation with medial A25 (Morecraft et al., 1992).
The rationale for including orbital A25 as a continuation of medial A25 in the map of Barbas and Pandya (1989) relies on a cluster of salient features used in classical and current architectonic studies used to determine what constitutes an architectonic area, despite small architectonic variation across an area. For example, the medial and lateral parts of M1 (area 4) are widely accepted to belong to one area, as are the medial and lateral parts of several visual areas, despite focal differences in architecture. We used a similar approach to map A25 based on reliable architectonic features, including the cytoarchitecture and myeloarchitecture (Barbas and Pandya, 1989) as well as the more recently introduced marker SMI-32 (Fig. 2).
In a paper by Carmichael and Price (1994), the orbital part of A25 is labeled area 14c. However, the descriptions and figures of this region in their paper indicate that area 14c (our orbital A25) differs markedly from the rostral part of area 14 (14r) by the distribution of PV neurons and AChE, another salient architectonic marker (see their Fig. 8, PV and their Fig. 20A,C, AChE). On account of both markers, as well as the cytoarchitecture and myeloarchitecture, orbital A25 appears to be continuous with the medial part of A25. Our parcellation is further substantiated by a detailed quantitative architecture of the region (Dombrowski et al., 2001). Quantitative analysis based on 17 parameter dimensions of architectonic features (including laminar densities of PV, CB, CR, all neurons, etc.) placed area 14 and A25 at a considerable distance from each other, indicating individuality in these areas. These findings were based on two independent analyses, namely, multidimensional scaling and cluster analysis, which yielded identical results. This objective quantitative architectonic analysis provided evidence that area 14 and A25 are distinct areas. Further, this analysis showed that A25 is a unique area, distinguished from other prefrontal areas, including its closest neighbors (Dombrowski et al., 2001).
Figure 8.

Examples of laminar patterns of labeled projection neurons directed to A25. A, Wide column through area 28 shows darkly labeled neurons in the deep layers (arrowheads, Case BU). B, Higher-magnification inset from layer V shows labeled neurons (arrowheads). C, Higher-magnification inset from B shows labeled axon terminations in layer V (e.g., arrowheads). D, Grayscale epifluorescence shows wide column through area 14 with brightly labeled neurons in layers III and V–VI (e.g., arrowheads, Case BP). E, Wide column through area 12 shows darkly labeled neurons in the superficial layers (arrowheads, Case BU). F, Higher-magnification inset of layer III shows labeled neuron (arrowhead). G, Higher-magnification inset of labeled axon terminations in layer III (e.g., arrowhead). Dotted lines indicate laminar boundaries. ld, Lamina dissecans; WM, white matter.
Injection sites
The extent and reconstruction of the injection sites in A25 are shown in Figure 3. Two injection sites were situated in medial A25 (Fig. 3A), one posterior (Fig. 3B, Case BR), and one anterior (Fig. 3C, Case BS). In the posterior medial injection site, BDA spread through all layers and included area MPAll (Fig. 3B, Case BR). In the anterior case, LY was found in all layers and prominently occupied the deep layers of A25 (Fig. 3C, Case BS).
Figure 3.

Injection sites. A, Normalized coordinates of the injection sites in A25 on medial surface of the rhesus monkey PFC. B, Coronal sections show deposit of BDA in deep layers of MPAll and all layers of posterior medial A25 (Case BR). C, Coronal sections show deposit of LY in deep and upper layers of anterior medial A25 (Case BS). D, Normalized coordinates of the injection sites in A25 on the orbital (basal) surface of the rhesus monkey PFC. E, Coronal sections show deposit of FE in all layers of anterior orbital A25 (Case BU). F, Coronal sections show deposit of FB in all layers of anterior orbital A25 (Case BP). G, There was no relationship between the size of the injection site and the number of labeled neurons in cortex. Scale bars, 1 mm. Arrowheads indicate injection sites. ac, Anterior commissure; All, allocortex; cd, caudate; cg, cingulate sulcus; gr, gyrus rectus; lot, lateral olfactory tract; mo, medial orbital sulcus; olf, olfactory nuclei; o, olfactory sulcus; ro, rostral sulcus.
Two injection sites were situated in anterior orbital A25, and their coordinates overlapped in a normalized brain space (Fig. 3D). In one of the two orbital injections (Fig. 3E, Case BU), FE spread into all layers of A25 found just lateral to the olfactory sulcus. In the other, FB diffused into all layers of A25 found just medial to the olfactory sulcus (Fig. 3F, Case BP).
The two orbital A25 injections labeled a large number of cortical neurons (Case BU: 131,085 neurons; Case BP: 103,359; 1 in every 20 sections, separated by 1 mm), while the two medial injections labeled fewer neurons (Case BS: 8160 neurons, 1 in every 20 sections; Case BR: 3446, 1 in every 10 sections, separated by 500 μm). To determine whether injection site size affected the magnitude of labeling, we correlated the volume of each reconstructed injection site to the number of labeled neurons and found no correlation (Fig. 3G; Pearson's Correlation, r = −0.03, p = 0.97). For example, a large injection site (Case BR) produced the smallest number of labeled neurons at twice the sampling rate, whereas a comparatively small injection site (Case BU) yielded the largest number of labeled neurons. This evidence suggests that medial A25 has overall sparser connections than orbital A25.
Cortical projections to A25
We found that A25 connections were especially concentrated in the PFC. Figures 4 and 5 depict coronal sections with raw maps of retrogradely labeled neurons for each case. Figures 6 and 7 depict normalized projection neuron density across cases, reconstructed on the respective cortical surfaces of each case and overlaid with topographic histograms of raw labeled neuron counts. This quantitative analysis shows the cortical connectome of A25 for each case at the resolution of the single sections plotted and allows comparison among cases.
Figure 4.

Distribution of cortical labeled neurons directed to orbital A25. A–N, Coronal sections from rostral (A, H) through caudal (G, N) levels show distribution of retrogradely labeled neurons across cortical areas in 2 cases (A–G: Case BP; H–N: Case BU). Dotted lines on coronal sections indicate boundary between superficial and deep layers as delimited by the bottom of layer III. Most labeled projection neurons were found along the orbital and medial surfaces (B–D, I–K). O, Q, Injection sites on the basal surface of the brain and the level of the coronal sections depicted above. Scale bars, 2 mm. P, Proportion of labeled neurons found by cortical region (grouping of areas is shown below). There is striking similarity of the 2 A25 cases by injection site and distribution of labeled neurons. Grouped areas are as follows: LPFC, areas 46, 9l, 8, 12l; aOFC, 11, 12o; ACC, 32, perigenual 24a and MPAll; SGC, 25, subgenual 24a and MPAll; pOFC, 13, OPro, OPAll; Mot/Premot, 6, preSMA, SMA, 4; Insula, Ia, Id; TPole, TPro, TPAll, TPdm, TPvm; STG, PaI, PaAr, PaAlt, Ts3, Ts2, Ts1, Tpt, MST, TAa, TPO, PGa, IPa, FST; ITG, TEa, TEm, TE1, TE2, TE3, TEO; MTL, areas 28, 35, 36, TH, TF; Post Cing, 23, 30; Prostriata, agranular and dysgranular prostriata. a, Arcuate sulcus; aon, anterior olfactory nucleus; ca, calcarine sulcus; cg, cingulate sulcus; FPole, frontal pole; Ia, agranular insula; Id, dysgranular insula; ITG, inferior temporal gyrus; lf, lateral fissure; lo, lateral orbital sulcus; lot, lateral olfactory tract; mo, medial orbital sulcus; OPAll, orbital periallocortex; OPro, orbital proisocortex; p, principal sulcus; ProM, motor proisocortex; rh, rhinal sulcus; ro, rostral sulcus; st, superior temporal sulcus; TPAll, temporal periallocortex; TPdm, temporal proisocortex dorsomedial; TPvm, temporal proisocortex ventromedial.
Figure 5.

Distribution of labeled cortical neurons directed to medial A25. A–N, Coronal sections from rostral (A, H) to caudal (G, N) levels show distribution of retrogradely labeled neurons across cortical areas in 2 cases (A–G: Case BS; H–N: Case BR). Dotted lines on coronal sections indicate boundary between superficial and deep layers as delimited by the bottom of layer III. Most labeled projection neurons were found along the orbital and medial surfaces (B–D, J–K). O, Q, Injection sites on the medial surface of the brain and the level of the coronal sections depicted above. Scale bars, 2 mm. P, Proportion of labeled neurons by cortical region. Grouped areas are as follows: LPFC, areas 46, 9l, 8, 12l; aOFC, 11, 12o; ACC, 32, perigenual 24a, MPAll; SGC, 25, subgenual 24a, MPAll; pOFC, 13, OPro, OPAll; Mot/Premot, 6, preSMA; Insula, Ia, Id, Ig; TPole, TPro, TPAll, TPdm, TPvm; STG, PaI, PaAr, Ts3, Ts2, Ts1, Tpt, MST, TAa, TPO, PGa, IPa; ITG, TEa, TEm, TE1, TE2, TE3; MTL, areas 28, 35, 36, TH, TF; Par/Somatosens, 31, PEci; Post Cing, 23, 30; Prostriata, agranular and dysgranular area prostriata. a, Arcuate sulcus; aon, anterior olfactory nucleus; ca, calcarine sulcus; cg, cingulate sulcus; FPole, frontal pole; Ia, agranular insula; Id, dysgranular insula; ITG, inferior temporal gyrus; lf, lateral fissure; lo, lateral orbital sulcus; lot, lateral olfactory tract; mo, medial orbital sulcus; OPAll, orbital periallocortex; OPro, orbital proisocortex; p, principal sulcus; ProM, motor proisocortex; rh, rhinal sulcus; ro, rostral sulcus; st, superior temporal sulcus; TPAll, temporal periallocortex; TPdm, temporal proisocortex dorsomedial; TPvm, temporal proisocortex ventromedial.
Figure 6.

Density maps of projection neuron populations directed to orbital A25. A–C, Density of cortical connections to A25. Black represents injection site, Case BP. A, Basal surface. B, Medial surface. C, Lateral surface. D, Enlargement of lateral temporal cortex and surrounding areas. E–G, Density of cortical connections to orbital A25. Black represents injection site, Case BU. E, Basal surface. F, Medial surface. G, Lateral surface. H, Enlargement of lateral temporal cortex and surrounding areas. Colors represent the binned normalized density of neurons projecting to A25 from each cortical area, from least dense (1 indicates dark blue) to the most dense (6 indicates red). Dotted lines indicate areal parcellation. Black dots represent every 100 labeled neurons counted from coronal sections depicted as a topographic histogram of projection neurons directed to A25. For each area on a section, one dot was placed for the first bin of 1–100 neurons, and another dot for the next bin of 101–200, and so forth. Dots were placed only once if the area was represented on multiple surfaces, but colors were placed on every surface on which a cortical area appeared (e.g., ventrolateral 10 contains colors in A and C, but dots were placed only in A). Scale bars, 2 mm.
Figure 7.

Density maps of projection neuron populations directed to medial A25. A–C, Density of cortical connections to A25. Black represents injection site, Case BR. A, Basal surface. B, Medial surface. C, Lateral surface. D, Enlargement of lateral temporal cortex and surrounding areas. E–G, Density of cortical connections to medial A25. Black represents injection site, Case BS. E, Basal surface. F, Medial surface. G, Lateral surface. H, Enlargement of lateral temporal cortex and surrounding areas. Colors represent the binned normalized density of neurons projecting to A25 from each cortical area, with the least dense (1 indicates dark blue) to the most dense (6 indicates red). Dotted lines indicate areal parcellation. Each black dot represents a scaled number of labeled neurons (5 neurons for Case BR; 10 neurons for Case BS) counted in coronal sections, and depicted as a topographic histogram of projection neurons directed to A25. For each area on a section, one dot was placed for the first bin of 1–5 neurons for Case BR and 1–10 neurons for Case BS, and another dot for the next bin of 6–10 neurons (11–20, Case BS), and so forth. Dots were placed only once if the area was represented on multiple surfaces, but colors were placed on every surface on which a cortical area appeared (e.g., ventrolateral 10 contains colors in A and C, but dots were placed only in A). Scale bars, 2 mm.
This analysis showed that the topography of projection neurons was consistent across cases, but there was variation in their relative proportion. In all cases, a substantial majority of afferent retrogradely labeled neurons originated in the PFC (BP, BU: 90%, Fig. 4P; BS: 65%, BR: 84%, Fig. 5P). The two orbital injections (Cases BP, BU) showed a strikingly similar pattern of labeling, both in topographic distribution (Fig. 6) and relative strength across areas (Fig. 4P), as well as in the order of magnitude of overall number of labeled neurons (Fig. 3G) despite the distinct tracers used and differences in the size of the injection sites. Thus, even though the relative efficacy of the two tracers is unknown, these findings suggest that topography of the injection site was a key factor in the pattern of labeling in these cases.
In all cases, the densest populations of projection neurons were concentrated in the vmPFC (area 14, A25, and subgenual 24a and MPAll), perigenual ACC (A32, perigenual 24a and MPAll), and posterior orbitofrontal cortex (pOFC: areas 13, OPro, and OPAll; Figs. 6, 7A,B,E,F, warmest colors). The most dense (red) populations of projection neurons were found within the SGC, in MPAll/24a near the plane of the injection site, regardless of whether the injection site was situated in medial or orbital A25 (Figs. 6, 7B,F). Frontopolar area 10 (A10) also contained moderately dense populations of labeled neurons projecting to A25. Populations of labeled neurons ranging from light to moderate were also found in the anterior aspect of medial area 9 (9m; Figs. 6, 7B,F). A few retrogradely labeled neurons were found in the anterior parts of dlPFC areas 9 and 46 (Figs. 6, 7C,G). Area 12 (A12) had a weak or moderate population of labeled neurons across cases, found mostly in its orbital part (Figs. 6, 7A,E). In all cases, weak to sparse labeling was found in the pre-SMA region (Figs. 6, 7B,F) and anterior area 6 (Figs. 6, 7C,G).
Outside the frontal lobe, projection neurons directed to A25 were found mostly in temporal cortices and were distributed in the following: (1) the medial temporal lobe (Figs. 6, 7A,E; anterior agranular MTL, including entorhinal area 28, perirhinal area 35, and parahippocampal area TH; medial aspects of dysgranular MTL: perirhinal area 36, and parahippocampal area TF); (2) the temporal pole (Figs. 6, 7B,F; areas TPAll, TPro, TPdm, and TPvm); and (3) auditory association cortices of the STG (Ts1, Ts2, Ts3, TAa; Figs. 6, 7D,H, enlarged insets) and polymodal areas in STS (TPO, PGa, and IPa; Figs. 6, 7D,H, insets).
A few labeled neurons were found in the posterior cingulate and retrosplenial areas 23 and 30 (Figs. 6, 7B,F). Similarly, small proportions of labeled neurons were found in occipital area prostriata (Fig. 6B,F, area Pros; Fig. 7F) and in the anterior insula (Figs. 6, 7D,H), which were concentrated in dense hotspots.
Variation in the pattern of retrograde labeling across cases
The pattern of labeling was similar across cases, but there were some topographic and quantitative differences across cases. The two orbital cases (Cases BU, BP) had more projection neurons in orbital A25, area 14, and pOFC (compare Figs. 4P and 5P; Figs. 6, 7) than the medial cases. Carmichael and Price (1995, 1996) reported on some cortical connections of an injection in their area 14c (which overlaps with our orbital A25), but the injection site included their areas 14r, 25, and 10o (1996). The connections shown in prefrontal (Carmichael and Price, 1996) and rhinal areas (Carmichael and Price, 1995) are consistent with our findings. Notably, orbital A25 here and their area 14c were both connected with memory-related temporal areas. In a previous study, we found that connections between the rostral gyrus rectus (our area 14) and MTL connections are sparse, at best (Barbas et al., 1999), corroborated by a later study (Kondo et al., 2005). Thus, the connectional differences between area 14 and A25 are consistent with our architectonically based parcellation.
On the other hand, medial A25 had concentrated connections in the nearby midline ACC (Case BS, 22%), and especially in the posterior sector SGC (Case BR, 66%, Fig. 5P). Partial information about the cortical connections of medial A25 was provided by Chiba et al. (2001), although the tracer injection included neighboring areas, and by Kondo et al. (2005) and Saleem et al. (2008). The major focus of these studies was either on subcortical connections or temporal/insular connections of A25, and to this extent our results are consistent with these findings.
In the 3 cases with more anterior injections in A25 (Cases BP, BU, BS), projection neurons were spread out across frontal and temporal areas (Figs. 6, 7). The posterior A25 case had the largest injection site, and transport was seen in some distant regions as well, such as the posterior medial wall (Fig. 7B, area 31). This evidence suggests that topography of the injection site was a key factor in the pattern of label, rather than the type of tracer, injection size, or tracer transport.
Cortical projections of A25
Reciprocal outgoing pathways from A25 terminated in cortical areas that contained projection neurons directed to A25, as is a general rule for corticocortical connections. We used the optical fractionator method to systematically sample and quantify the reciprocal pathways of A25 by studying their terminations (boutons) in representative areas.
We quantified bouton density in three prefrontal areas: the STG, the STS, and the memory-related MTL. Reciprocal pathways from A25 were consistent with the overall pattern of projection neurons described above. Qualitative observations across all cortical areas indicated that bouton density was highest in A25 and the SGC in all cases. Densities in the sampled areas were ∼≤100,000 boutons/mm3, with two exceptions. The posterior sector of A25 (Case BR) most densely innervated A32 at >4 times the density in other areas (∼425,500 boutons/mm3), mirroring the hyperdense connectivity of the reciprocal pathway of projection neurons from ACC and SGC, described above (Fig. 5P). Orbital A25 most densely innervated orbital A12 (A12o; 135,000 boutons/mm3), in line with findings that the orbital sector of A25 receives reciprocal projections from other orbital parts of PFC.
The laminar origin and termination of A25 pathways
We then studied the laminar distribution of pathways directed to, or originating in, A25. Labeled neurons projecting to A25 were distributed in superficial and deep layers, but proportions in each varied. At one extreme, projection neurons were found mostly in the upper layers in A12 (Fig. 8E), nearly equally in the upper and deep layers, as seen in area 14 (Fig. 8D), or mostly in the deep layers of entorhinal area 28 (A28, Fig. 8A, darkly labeled neurons in layer V). Figure 9 shows the laminar distribution of labeled neurons by pathway.
Figure 9.

Laminar patterns of A25 pathways vary by cortical type: projection neurons. A, Map of cortical areas projecting to A25 are color-coded by cortical type: agranular (red) to eulaminate II+ (darkest blue). Areas outside the PFC with no A25 connections were left blank. B, Average percentage neurons (±SEM) across cases originating in superficial layers II–III, organized by system and then by laminar structure (indicated by colors that represent cortical types) within each system. Data from some similar architectonic areas within systems were combined (e.g., areas MPAll and 24a). C, Cortical areas in B were pooled across cases and regressed by cortical type. This analysis showed that the proportion of labeled neurons in the superficial layers increased as cortical structure (type) was more elaborate. Average percentage (±SEM) shown (colors) with linear fit from the regression and corresponding adjusted R2. D, Individual cases with average percentage of labeled neurons in superficial layers (±SEM) and linear fit from regression show a consistent upward trend. Black circles represent individual cortical areas and convey variability. olf, Olfactory cortex and nuclei. *significant difference.
Within a given area, the laminar pattern of A25 terminations mirrored the laminar pattern of projection neurons directed to A25. There was a bias for A25 terminations to target the superficial layers in most areas, including areas 32, 10, 12o, and multiple areas in the STG and STS (Fig. 10B). A25 targeted both laminar groups of the MTL areas, with a bias toward the deep layers of the agranular areas.
Figure 10.

Laminar patterns of A25 pathways vary by cortical type: axon terminations. A, Map of cortical areas connected with A25 are color-coded by cortical type: agranular (red) to eulaminate II+ (darkest blue). Areas outside the PFC with no A25 connections were left blank. B, Average percentage boutons across cases from A25 (±SEM) found in superficial layers (Cases BU, BS, BR; Case BP had only a retrograde tracer). C, Cortical areas from B were pooled across cases and regressed by cortical type. This analysis showed that the proportion of labeled boutons in the superficial layers increased as cortical structure (type) became more elaborate. D, Individual cases with average percentage of labeled boutons in superficial layers (±SEM) and linear fit from regression show a consistent upward trend. Black circles represent individual cortical areas and convey variability. olf, Olfactory cortex and nuclei. *significant difference.
We then investigated whether the laminar distribution of connections covaries with cortical type according to the structural model for connections. The model is based on the relationship of the type of cortices that are linked, and makes predictions about the distribution of connections when an area is linked with another area that is of a higher or lower type (Barbas and Rempel-Clower, 1997). Type refers to the overall laminar structure of an area, ranging from agranular areas to eulaminate areas that have well-delineated laminar architecture, as seen in a schematic in Figure 1D.
A25 was connected with cortices of multiple types, as depicted in Figure 9A. The simplest laminar structure is seen in agranular areas (Fig. 9, red), which have the most impoverished lamination and contain three layer groups: I, II/III, and V/VI (Fig. 1D). Layer II is indistinguishable from layer III, and layer IV is not present. Agranular areas form a ring-like structure at the base (core) of the cortex (for review, see Barbas, 2015). Next, neighboring dysgranular areas (Fig. 9, orange) display an incipient layer IV, and layers II/III and V/VI begin to separate but laminar boundaries remain difficult to discern (Fig. 1D). Eulaminate I areas (Fig. 9, light blue) have six layers, and layers in eulaminate II areas (Fig. 9, intermediate blue) are more distinctive in thickness and definition (Fig. 1D). The darkest blue shows the best delineated eulaminate areas.
Quantitative analysis of pathways by cortical type showed that A25 was preferentially innervated by neurons found mostly in the superficial layers of eulaminate areas, such as A12 (Figs. 8E, 9B). In contrast, A25 was preferentially innervated by neurons in the deep layers of agranular and dysgranular areas of the MTL (areas 28, 35, 36, TH, TF; Figs. 8A, 9B), the insula (Ia, Id), its contiguous parainsular cortex (PaI), the temporal pole, and pOFC (area OPAll; Fig. 9B). Other dysgranular and eulaminate cortices innervated A25 in varying proportions from both laminar groups (Figs. 8D, 9B). A significant portion of the variance in average laminar specificity across cases could be explained by cortical type (Fig. 9C; Jonckheere–Terpstra, Z = 2.6, p = 0.009), with a significant pairwise difference between agranular and eulaminate I cortices (p = 0.02). A linear regression showed a shift in the laminar location of labeled projection neurons toward superficial layers as cortical areas increased in laminar complexity (Fig. 9C; R2 = 0.15, R2 adjusted = 0.13, p = 0.003). The trend was seen in each case (Fig. 9D), indicating consistency of the effect across cases and distinct tracers.
Similarly, a significant portion of the variance in laminar specificity of the reciprocal pathways from A25 to other areas could be explained by cortical type, based on stereologic analysis of a large number of labeled boutons (Fig. 10B,C; one-way ANOVA, F(2,18) = 7.8, p = 0.004), with a significant difference between agranular and eulaminate I cortices (post hoc Tukey's, p = 0.004). Thus, there was a shift in the laminar location of A25 boutons toward superficial layers as cortical areas innervated by A25 increased in laminar complexity (Fig. 10C; R2 = 0.46, R2 adjusted = 0.43, p = 0.0007). As seen for the distribution of projection neurons (described above), the trend was found in each of the individual cases (Fig. 10D), suggesting a robust effect.
Boutons were categorized as large (largest diameter >1 μm) or small (<1 μm). No significant differences in bouton size were found by pathway or cortical type (data not shown; Kruskal–Wallis, H = 9.9, p = 0.13 and H = 3.2, p = 0.21, respectively).
The relationship of axon terminations to neurochemically distinct classes of inhibitory neurons
We then used multiple labeling techniques to visualize A25 terminations against three distinct neurochemical classes of inhibitory neurons labeled by the calcium binding proteins PV, CB, and CR. In primates, these neurochemically defined classes are largely nonoverlapping, and their laminar distribution is similar across areas (DeFelipe, 1997). These classes also differ in their innervation of postsynaptic sites and physiologic dynamics (DeFelipe, 1997). CR neurons are most dense in layers I–IIIa in most areas, where they often inhibit nearby inhibitory neurons (Meskenaite, 1997). In the entorhinal cortex (A28), we observed that CR neurons were also abundant in the deep layers (Fig. 11A–C,F). CB neurons are found mostly in layers II–III and frequently target the intermediate and distal dendrites of pyramidal neurons (DeFelipe, 1997; Wang et al., 2004; Barbas et al., 2005). PV neurons are found mostly in layers IV–VI, and their fast spiking dynamics and perisomatic targeting can produce strong inhibition (DeFelipe, 1997; Kawaguchi and Kubota, 1997).
Figure 11.

Examples of A25 axon terminations within distinct inhibitory microenvironments. A–C, High magnification of layer V in medial entorhinal area 28 shows A25 terminations (green) comingling with PV neurons and their processes (yellow) and with deeply situated CR neurons (blue). A, Inset from F. D, High magnification of layer III in area 32 shows A25 terminations comingling with CB (red) and CR (blue) neurons (inset from G). E, High magnification of layer III in area 12o shows A25 terminations comingling with CB (red) and CR (blue) neurons (inset from H). F, Low magnification of column through the entire depth of medial entorhinal area 28 shows A25 terminations (green) seen mostly in layer V where PV (yellow) and CR (blue) inhibitory neurons are found (Case BU). G, Low-magnification column through the cortical depth of area 32 shows A25 terminations in the superficial layers, where CB (red) and CR (blue) neurons are prominent (Case BR). H, Low magnification of column through the cortical depth of orbital area 12 shows terminations from A25 mostly in the upper layers, where CB (red) and CR (blue) neurons are found (Case BU). I, High magnification of layer I in area 32 shows A25 terminations coursing through layer I, which contains the apical dendrites from pyramidal neurons below (inset from G). Layer I contains almost no cell bodies, with the exception of CR neurons. Empty arrowheads indicate A25 terminations (green) or color-coded processes of inhibitory neurons. Filled green arrowheads indicate labeled projection neurons directed to A25. Scale bars: A, D, E, I, 100 μm; B, C, 50 μm; F–H, 200 μm. ld, Lamina dissecans.
We found that A25 terminations in the upper layers intermingled with CB and CR populations or coursed through the dense plexus of apical dendrites in the largely neuron-sparse layer I (Fig. 11D,E,G–I). Conversely, terminations of A25 in deep layers intermingled with PV neurons and especially their processes (A28, Fig. 11A–C). Differential laminar targeting by A25 terminations suggests that A25 pathways may interact with functionally distinct inhibitory microenvironments depending on the cortical area of termination.
Glutamatergic nature of A25 connections
We also conducted double-labeling experiments for the tracer and VGLUT1 or VGLUT2 to investigate the glutamatergic nature of A25 terminations. Although it is thought that corticocortical connections generally express VGLUT1, some studies suggest that there may be a small subset of corticocortical neurons in the middle layers that express VGLUT2 mRNA (De Gois et al., 2005; Hackett et al., 2011). We systematically sampled both layer groups of A32 (Cases BR, BU) and ventral A10 (Case BU) for A25 boutons. There was no evidence that A25 boutons colocalized with VGLUT2, which are larger and easier to detect (Timbie and Barbas, 2015), while a subset of A25 boutons colocalized with VGLUT1 (data not shown). This evidence suggests that there is no differential VGLUT expression for A25 pathways terminating in different cortical layers at the level of the protein.
Discussion
The principal cortical connections of A25
Our findings revealed that A25 is connected with cortices that are broadly associated with emotion, memory, and internal states, exemplified by strong connections with ventromedial and posterior orbitofrontal regions. Beyond the PFC, pathways linked A25 with the temporal pole, medial temporal areas associated with memory, and auditory association areas. Our findings provide a comprehensive cortical connectome for A25 based on novel quantitative maps, confirming and extending incidental findings in nonhuman primates (Vogt and Pandya, 1987; Barbas and Pandya, 1989; Morecraft et al., 1992; Barbas, 1993; Carmichael and Price, 1995, 1996; Barbas et al., 1999; Rempel-Clower and Barbas, 2000; Kondo et al., 2003, 2005; Medalla et al., 2007; Petrides and Pandya, 2007; Saleem et al., 2008) and humans (Johansen-Berg et al., 2008; Gutman et al., 2009; Vergani et al., 2016). Our findings of projections from STG, temporal pole, insula, and MTL are consistent with results from a few cases with injection of tracers in A25 (Chiba et al., 2001; Kondo et al., 2005; Saleem et al., 2008).
A25 had limited connections with sensory cortices outside the auditory modality, a pattern also seen for other medial prefrontal areas (Barbas et al., 1999). The auditory-related connections of A25 included the anterior STG and temporal pole, which respond to conspecific vocalizations, and complex aspects of audition and their affective significance (Poremba et al., 2004, 2013; Romanski and Averbeck, 2009; Plakke and Romanski, 2014). A novel pathway linked A25 with area prostriata, a dysgranular area in the anterior calcarine region, which may be part of the dorsal visual system adapted for quick response to spatial stimuli (Ungerleider and Mishkin, 1982; Yu et al., 2012; Ding, 2013).
Another significant contingent of A25 connections involved entorhinal, perirhinal, and parahippocampal cortices, suggesting a role in memory-related processes, along with a strong pathway from the hippocampus (Barbas and Blatt, 1995; Insausti and Muñoz, 2001). Focal connections were also noted in the agranular and dysgranular insula, which may be associated with interoceptive and visceromotor functions (An et al., 1998; Ongür et al., 1998; Rempel-Clower and Barbas, 1998; Freedman et al., 2000; Ongür and Price, 2000; Chiba et al., 2001; Drevets et al., 2008a; Gold, 2015).
Previous investigators suggested that A25 is an autonomic effector region, based on subcortical connections (Chiba et al., 2001). The present findings show how converging pathways from cortices associated with interoception, affective states, memory, and cognition provide diverse ways to trigger autonomic states through A25. The posterior medial A25 was distinguished among PFC for the strongest bidirectional connections with nearby SGC, and the most robust connections with the amygdala (Barbas et al., 1999; Ghashghaei et al., 2007), suggesting a prominent role in autonomic function. Other differences between A25 sites included somewhat stronger connections of orbital A25 with nearby orbital areas and medial A25 with neighboring cingulate cortices. The shared features in architecture and overall pattern of connections provide evidence that the medial and orbital parts of this ventromedial region in rhesus monkeys are part of A25, as also reported by others (Petrides et al., 2012).
The laminar pattern of connections and cortical recruitment
A25 pathways showed a propensity for terminating in the superficial layers of most areas, in a pattern often called feedback, by analogy with directional processing in sensory systems (Felleman and Van Essen, 1991; Hilgetag et al., 2016). Feedback connections originate in the deep layers and terminate expansively in the upper layers (Rockland and Drash, 1996). The densely populated deep layers of macaque A25 stand in sharp contrast to the sparser upper layers, forming a lopsided laminar architecture, seen also in humans (Mackey and Petrides, 2014). The laminar architecture and connections suggest that A25 may be the consummate prefrontal feedback system (Fig. 12).
Figure 12.
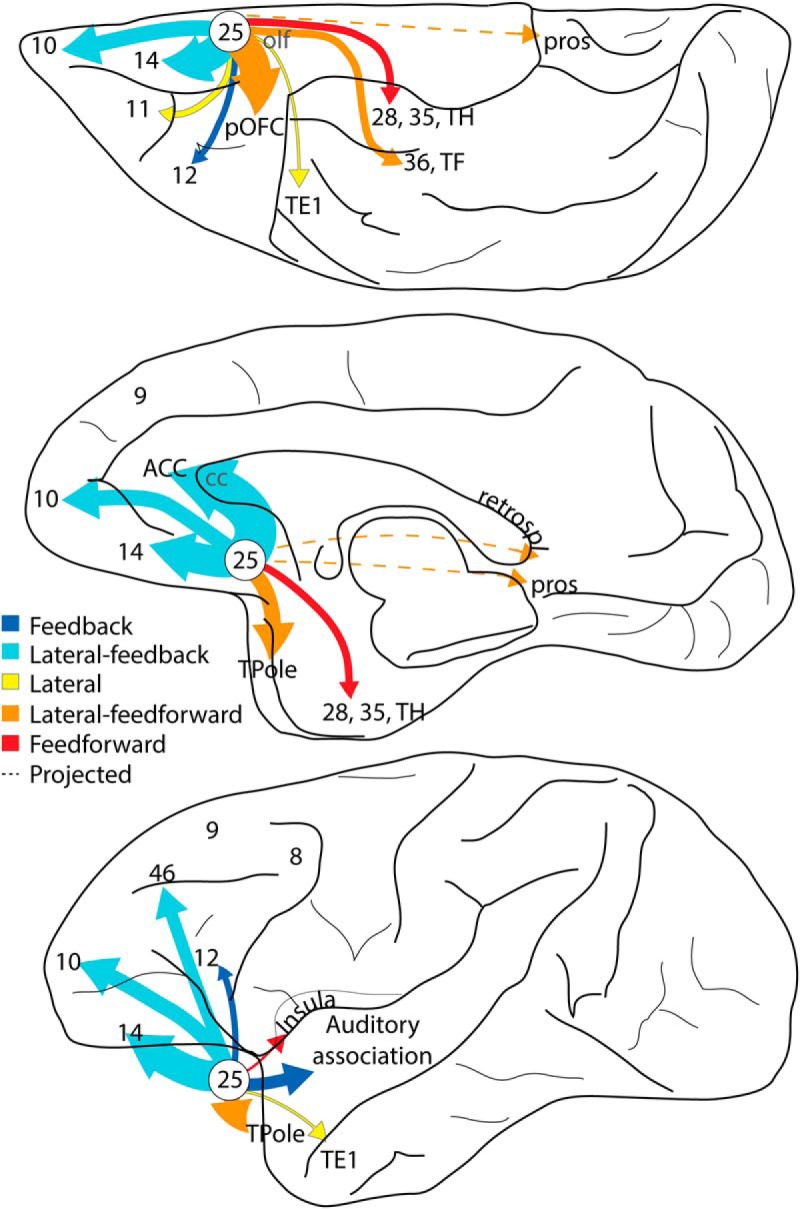
Summary of the cortical connectome of A25. Pathways are color-coded as predominantly feedback or feedforward. A25 is a preferential feedback system to most other areas. Summary schematic of strength (arrow thickness) and connectional type (color) for pathways from A25 projecting to other areas. The thickest arrows fall in the lateral-feedback category. The pattern of label in cortical areas with very sparse connections with A25 is shown with dashed lines. Data from a cortical area's projections to A25 were used in complement with terminations from A25. cc, Corpus callosum; pros, prostriata; retrospl, retrosplenial; TPole, temporal pole.
The widespread terminations in the upper layers brought A25 pathways in contact with populations of CB inhibitory neurons, which are thought to have a modulatory role (DeFelipe et al., 1989b; Wang et al., 2004) and with CR neurons, which have a disinhibitory role (Meskenaite, 1997), suggesting a predominant excitatory effect. This evidence suggests that A25 can recruit large swaths of cortex, consistent with the hypothesis that limbic cortices, such as A25, have a tonic influence on the neuraxis (Barbas, 1995, 2000).
In contrast to the feedback pattern of connections with most areas, A25 pathways terminated preferentially in the middle-deep layers of A28, where they overlapped with PV inhibitory neurons, known for their perisomatic innervation of neighboring pyramidal neurons (DeFelipe et al., 1989a; Mikkonen et al., 1997). The deep layers of A28 receive hippocampal output destined for the cortex, suggesting that A25 terminations may help gate signals leaving the hippocampus for long-term memory storage (Canto et al., 2008; Bunce and Barbas, 2011; Bunce et al., 2013; Anderson et al., 2016). Theta oscillations in the deep layers of human entorhinal A28 are associated with autobiographical memory retrieval (Steinvorth et al., 2010), processing internal mental context (von Stein et al., 2000), and transfer of salient signals from hippocampus to cortex (Kirk and Mackay, 2003). A25 terminations in MTL may thus affect the emotional valence of internal state representations for stored or retrieved memories.
The laminar connection patterns of A25 are in accord with the structural model for connections, which predicts the laminar distribution and strength of connections (Barbas, 1986; Barbas and Rempel-Clower, 1997; Goulas et al., 2014; Hilgetag et al., 2016; Beul et al., 2017). The structural model is relational, with predictions based on the relationship of the laminar architecture of linked areas, such that connections from an area with simpler laminar structure to an area with more complex structure follow a predominant feedback pattern, whereas connections proceeding in the reverse direction are mostly feedforward (Barbas, 2015). The systematic variation in cortical architecture is linked to development (Barbas and García-Cabezas, 2016), suggesting a similar developmental origin for the orderly laminar patterns of corticocortical connections.
Feedforward processing in the primate visual system has been associated with gamma oscillations, and feedback pathways with alpha/beta oscillations (e.g., Buffalo et al., 2011; Spaak et al., 2012; van Kerkoerle et al., 2014; Bastos et al., 2015; Michalareas et al., 2016). In contrast, others suggest more complex patterns in cortical rhythms (Csercsa et al., 2010; Haegens et al., 2015), which vary with task demands (Schroeder and Lakatos, 2009; Cannon et al., 2014; Wimmer et al., 2016). Oscillations depend on activation of populations of inhibitory neurons (e.g., Le Van Quyen et al., 2016; Teleńczuk et al., 2017). We suggest that shifts in cortical rhythms may occur as laminar-specific pathways are recruited in time to meet changing task demands and impinge on inhibitory microenvironments with different dynamics. The dynamic nature of cortical oscillations (Cannon et al., 2014; Kopell et al., 2014) thus may be understood in the context of the graded variability of cortical connections superimposed on functionally distinct inhibitory microenvironments (Barbas, 2015). This model provides a powerful mechanism to study shifts in cortical rhythms and helps reconcile seemingly contradictory findings in the cortical rhythm literature.
The cortical connections of A25 and psychiatric diseases
Area 25 is activated during transient healthy sadness (George et al., 1995; Mayberg et al., 1999; Liotti et al., 2002), but in depression it becomes tonically hyperactive, a phenomenon correlated with symptom severity that is normalized after successful treatment (Drevets et al., 1997, 2008b; Mayberg, 1997, 2003; Mayberg et al., 2005; Johansen-Berg et al., 2008; Hamani et al., 2009). The predominant feedback nature of A25 pathways with eulaminate areas suggests the potential to recruit widespread target fields. Heightened activity in A25 will also recruit agranular areas in the pOFC, vmPFC, MTL, and anterior insular areas, associated with emotions, interoceptive processes, and memory. The predominant feedforward nature of these connections suggests that activity is initiated in A25, akin to the feedforward pattern from early to later processing sensory areas. The persistent and inescapable effect severe depression has on patients may mirror the pervasive and widespread pattern of connections A25 has with areas associated with emotion and internal states, making it difficult to disengage attention and focus elsewhere, as circumstances demand.
Depression is associated with an attenuated ability to regulate emotion (Mayberg, 1997; Disner et al., 2011), and strategies that reduce negative affect seem to dampen SGC activity (Liotti et al., 2002; Mayberg, 2003; Mayberg et al., 2005; for review, see Phelps et al., 2004; Myers-Schulz and Koenigs, 2012). Regulation strategies may rely on interaction of A25 with areas associated with cognition. Despite limited interface with the LPFC, we found a moderate pathway that linked A25 with frontopolar A10, which has been associated with complex cognition (Koechlin et al., 1999; Dreher et al., 2008; Medalla and Barbas, 2010, 2014) and regulation of emotion (Beauregard et al., 2001; Ochsner et al., 2004; Blair et al., 2007). A10 achieves its greatest development in apes and humans (Semendeferi et al., 2001), and its volume is reduced in patients with depression (Bludau et al., 2016). Integrity of this pathway may be critical for the ability to disengage from negative affect and, consequently, may weaken in depression (Barbas and Zikopoulos, 2014; Riva-Posse et al., 2014) and anxiety disorders (Fonzo et al., 2017a,b). The pathway between A10 and A25 may thus be a promising target for therapeutic interventions.
In conclusion, A25 is positioned at a crucial intersection of systems involving emotional states, somatic responses to emotion, internal states, and memory. The predominant connections of A25 point to a role in mood and emotional equilibrium, and suggest how hyperactivation of this area can disrupt fundamental processes of the internal milieu and its fragile association with complex cognition.
Footnotes
This work was supported by National Institute of Neurological Disorders and Stroke, National Institute of Mental Health, National Institutes of Health. We thank Drs. Miguel Á. García-Cabezas, Basilis Zikopoulos, and Yohan John for helpful discussions.
The authors declare no competing financial interests.
References
- An X, Bandler R, Ongür D, Price JL (1998) Prefrontal cortical projections to longitudinal columns in the midbrain periaqueductal gray in macaque monkeys. J Comp Neurol 401:455–479. [DOI] [PubMed] [Google Scholar]
- Anderson MC, Bunce JG, Barbas H (2016) Prefrontal-hippocampal pathways underlying inhibitory control over memory. Neurobiol Learn Mem 134:145–161. 10.1016/j.nlm.2015.11.008 [DOI] [PMC free article] [PubMed] [Google Scholar]
- Barbas H. (1986) Pattern in the laminar origin of corticocortical connections. J Comp Neurol 252:415–422. 10.1002/cne.902520310 [DOI] [PubMed] [Google Scholar]
- Barbas H. (1993) Organization of cortical afferent input to orbitofrontal areas in the rhesus monkey. Neuroscience 56:841–864. 10.1016/0306-4522(93)90132-Y [DOI] [PubMed] [Google Scholar]
- Barbas H. (1995) Anatomic basis of cognitive-emotional interactions in the primate prefrontal cortex. Neurosci Biobehav Rev 19:499–510. 10.1016/0149-7634(94)00053-4 [DOI] [PubMed] [Google Scholar]
- Barbas H. (2000) Connections underlying the synthesis of cognition, memory, and emotion in primate prefrontal cortices. Brain Res Bull 52:319–330. 10.1016/S0361-9230(99)00245-2 [DOI] [PubMed] [Google Scholar]
- Barbas H. (2015) General cortical and special prefrontal connections: principles from structure to function. Annu Rev Neurosci 38:269–289. 10.1146/annurev-neuro-071714-033936 [DOI] [PubMed] [Google Scholar]
- Barbas H, Blatt GJ (1995) Topographically specific hippocampal projections target functionally distinct prefrontal areas in the rhesus monkey. Hippocampus 5:511–533. 10.1002/hipo.450050604 [DOI] [PubMed] [Google Scholar]
- Barbas H, García-Cabezas MÁ (2015) Motor cortex layer 4: less is more. Trends Neurosci 38:259–261. 10.1016/j.tins.2015.03.005 [DOI] [PMC free article] [PubMed] [Google Scholar]
- Barbas H, García-Cabezas MÁ (2016) How the prefrontal executive got its stripes. Curr Opin Neurobiol 40:125–134. 10.1016/j.conb.2016.07.003 [DOI] [PMC free article] [PubMed] [Google Scholar]
- Barbas H, Pandya DN (1989) Architecture and intrinsic connections of the prefrontal cortex in the rhesus monkey. J Comp Neurol 286:353–375. 10.1002/cne.902860306 [DOI] [PubMed] [Google Scholar]
- Barbas H, Rempel-Clower N (1997) Cortical structure predicts the pattern of corticocortical connections. Cereb Cortex 7:635–646. 10.1093/cercor/7.7.635 [DOI] [PubMed] [Google Scholar]
- Barbas H, Zikopoulos B (2014) Toward patient-specific targeting and parameter setting of deep brain stimulation for relief of depression. Biol Psychiatry 76:914–916. 10.1016/j.biopsych.2014.09.012 [DOI] [PubMed] [Google Scholar]
- Barbas H, Ghashghaei H, Dombrowski SM, Rempel-Clower NL (1999) Medial prefrontal cortices are unified by common connections with superior temporal cortices and distinguished by input from memory-related areas in the rhesus monkey. J Comp Neurol 410:343–367. [DOI] [PubMed] [Google Scholar]
- Barbas H, Medalla M, Alade O, Suski J, Zikopoulos B, Lera P (2005) Relationship of prefrontal connections to inhibitory systems in superior temporal areas in the rhesus monkey. Cereb Cortex 15:1356–1370. 10.1093/cercor/bhi018 [DOI] [PubMed] [Google Scholar]
- Bastos AM, Vezoli J, Bosman CA, Schoffelen JM, Oostenveld R, Dowdall JR, De Weerd P, Kennedy H, Fries P (2015) Visual areas exert feedforward and feedback influences through distinct frequency channels. Neuron 85:390–401. 10.1016/j.neuron.2014.12.018 [DOI] [PubMed] [Google Scholar]
- Bates JF, Goldman-Rakic PS (1993) Prefrontal connections of medial motor areas in the rhesus monkey. J Comp Neurol 336:211–228. 10.1002/cne.903360205 [DOI] [PubMed] [Google Scholar]
- Beauregard M, Lévesque J, Bourgouin P (2001) Neural correlates of conscious self-regulation of emotion. J Neurosci 21:RC165. [DOI] [PMC free article] [PubMed] [Google Scholar]
- Beul SF, Barbas H, Hilgetag CC (2017) A predictive structural model of the primate connectome. Sci Rep 7:43176. 10.1038/srep43176 [DOI] [PMC free article] [PubMed] [Google Scholar]
- Blair KS, Smith BW, Mitchell DG, Morton J, Vythilingam M, Pessoa L, Fridberg D, Zametkin A, Sturman D, Nelson EE, Drevets WC, Pine DS, Martin A, Blair RJ (2007) Modulation of emotion by cognition and cognition by emotion. Neuroimage 35:430–440. 10.1016/j.neuroimage.2006.11.048 [DOI] [PMC free article] [PubMed] [Google Scholar]
- Bludau S, Bzdok D, Gruber O, Kohn N, Riedl V, Sorg C, Palomero-Gallagher N, Müller VI, Hoffstaedter F, Amunts K, Eickhoff SB (2016) Medial prefrontal aberrations in major depressive disorder revealed by cytoarchitectonically informed voxel-based morphometry. Am J Psychiatry 173:291–298. 10.1176/appi.ajp.2015.15030349 [DOI] [PMC free article] [PubMed] [Google Scholar]
- Buffalo EA, Fries P, Landman R, Buschman TJ, Desimone R (2011) Laminar differences in gamma and alpha coherence in the ventral stream. Proc Natl Acad Sci U S A 108:11262–11267. 10.1073/pnas.1011284108 [DOI] [PMC free article] [PubMed] [Google Scholar]
- Bunce JG, Barbas H (2011) Prefrontal pathways target excitatory and inhibitory systems in memory-related medial temporal cortices. Neuroimage 55:1461–1474. 10.1016/j.neuroimage.2011.01.064 [DOI] [PMC free article] [PubMed] [Google Scholar]
- Bunce JG, Zikopoulos B, Feinberg M, Barbas H (2013) Parallel prefrontal pathways reach distinct excitatory and inhibitory systems in memory-related rhinal cortices. J Comp Neurol 512:4260–4283. 10.1002/cne.23413 [DOI] [PMC free article] [PubMed] [Google Scholar]
- Campbell MJ, Hof PR, Morrison JH (1991) A subpopulation of primate corticocortical neurons is distinguished by somatodendritic distribution of neurofilament protein. Brain Res 539:133–136. 10.1016/0006-8993(91)90695-R [DOI] [PubMed] [Google Scholar]
- Cannon J, McCarthy MM, Lee S, Lee J, Börgers C, Whittington MA, Kopell N (2014) Neurosystems: brain rhythms and cognitive processing. Eur J Neurosci 39:705–719. 10.1111/ejn.12453 [DOI] [PMC free article] [PubMed] [Google Scholar]
- Canto CB, Wouterlood FG, Witter MP (2008) What does the anatomical organization of the entorhinal cortex tell us? Neural Plast 2008:381243. 10.1155/2008/381243 [DOI] [PMC free article] [PubMed] [Google Scholar]
- Carmichael ST, Price JL (1994) Architectonic subdivision of the orbital and medial prefrontal cortex in the macaque monkey. J Comp Neurol 346:366–402. 10.1002/cne.903460305 [DOI] [PubMed] [Google Scholar]
- Carmichael ST, Price JL (1995) Limbic connections of the orbital and medial prefrontal cortex in macaque monkeys. J Comp Neurol 363:615–641. 10.1002/cne.903630408 [DOI] [PubMed] [Google Scholar]
- Carmichael ST, Price JL (1996) Connectional networks within the orbital and medial prefrontal cortex of macaque monkeys. J Comp Neurol 371:179–207. [DOI] [PubMed] [Google Scholar]
- Cavada C, Goldman-Rakic PS (1989) Posterior parietal cortex in rhesus monkey: I. Parcellation of areas based on distinctive limbic and sensory corticocortical connections. J Comp Neurol 287:393–421. 10.1002/cne.902870402 [DOI] [PubMed] [Google Scholar]
- Chiba T, Kayahara T, Nakano K (2001) Efferent projections of infralimbic and prelimbic areas of the medial prefrontal cortex in the Japanese monkey, Macaca fuscata. Brain Res 888:83–101. 10.1016/S0006-8993(00)03013-4 [DOI] [PubMed] [Google Scholar]
- Csercsa R, Dombovári B, Fabó D, Wittner L, Eross L, Entz L, Sólyom A, Rásonyi G, Szucs A, Kelemen A, Jakus R, Juhos V, Grand L, Magony A, Halász P, Freund TF, Maglóczky Z, Cash SS, Papp L, Karmos G, et al. (2010) Laminar analysis of slow wave activity in humans. Brain 133:2814–2829. 10.1093/brain/awq169 [DOI] [PMC free article] [PubMed] [Google Scholar]
- DeFelipe J. (1997) Types of neurons, synaptic connections and chemical characteristics of cells immunoreactive for calbindin-D28K, parvalbumin and calretinin in the neocortex. J Chem Neuroanat 14:1–19. 10.1016/S0891-0618(97)10013-8 [DOI] [PubMed] [Google Scholar]
- DeFelipe J, Hendry SH, Jones EG (1989a) Visualization of chandelier cell axons by parvalbumin immunoreactivity in monkey cerebral cortex. Proc Natl Acad Sci U S A 86:2093–2097. 10.1073/pnas.86.6.2093 [DOI] [PMC free article] [PubMed] [Google Scholar]
- DeFelipe J, Hendry SH, Jones EG (1989b) Synapses of double bouquet cells in monkey cerebral cortex visualized by calbindin immunoreactivity. Brain Res 503:49–54. 10.1016/0006-8993(89)91702-2 [DOI] [PubMed] [Google Scholar]
- De Gois S, Schäfer MK, Defamie N, Chen C, Ricci A, Weihe E, Varoqui H, Erickson JD (2005) Homeostatic scaling of vesicular glutamate and GABA transporter expression in rat neocortical circuits. J Neurosci 25:7121–7133. 10.1523/JNEUROSCI.5221-04.2005 [DOI] [PMC free article] [PubMed] [Google Scholar]
- Ding SL. (2013) Comparative anatomy of the prosubiculum, subiculum, presubiculum, postsubiculum, and parasubiculum in human, monkey, and rodent. J Comp Neurol 521:4145–4162. 10.1002/cne.23416 [DOI] [PubMed] [Google Scholar]
- Ding SL, Morecraft RJ, Van Hoesen GW (2003) Topography, cytoarchitecture, and cellular phenotypes of cortical areas that form the cingulo-parahippocampal isthmus and adjoining retrocalcarine areas in the monkey. J Comp Neurol 456:184–201. 10.1002/cne.10516 [DOI] [PubMed] [Google Scholar]
- Disner SG, Beevers CG, Haigh EA, Beck AT (2011) Neural mechanisms of the cognitive model of depression. Nat Rev Neurosci 12:467–477. 10.1038/nrn3027 [DOI] [PubMed] [Google Scholar]
- Dombrowski SM, Hilgetag CC, Barbas H (2001) Quantitative architecture distinguishes prefrontal cortical systems in the rhesus monkey. Cereb Cortex 11:975–988. 10.1093/cercor/11.10.975 [DOI] [PubMed] [Google Scholar]
- Dreher JC, Koechlin E, Tierney M, Grafman J (2008) Damage to the fronto-polar cortex is associated with impaired multitasking. PLoS One 3:e3227. 10.1371/journal.pone.0003227 [DOI] [PMC free article] [PubMed] [Google Scholar]
- Drevets WC. (2001) Neuroimaging and neuropathological studies of depression: implications for the cognitive-emotional features of mood disorders. Curr Opin Neurobiol 11:240–249. 10.1016/S0959-4388(00)00203-8 [DOI] [PubMed] [Google Scholar]
- Drevets WC, Price JL, Simpson JR Jr, Todd RD, Reich T, Vannier M, Raichle ME (1997) Subgenual prefrontal cortex abnormalities in mood disorders. Nature 386:824–827. 10.1038/386824a0 [DOI] [PubMed] [Google Scholar]
- Drevets WC, Savitz J, Trimble M (2008a) The subgenual anterior cingulate cortex in mood disorders. CNS Spectr 13:663–681. 10.1017/S1092852900013754 [DOI] [PMC free article] [PubMed] [Google Scholar]
- Drevets WC, Price JL, Furey ML (2008b) Brain structural and functional abnormalities in mood disorders: implications for neurocircuitry models of depression. Brain Struct Funct 213:93–118. 10.1007/s00429-008-0189-x [DOI] [PMC free article] [PubMed] [Google Scholar]
- Felleman DJ, Van Essen DC (1991) Distributed hierarchical processing in the primate cerebral cortex. Cereb Cortex 1:1–47. 10.1093/cercor/1.1.1-a [DOI] [PubMed] [Google Scholar]
- Fiala JC. (2005) Reconstruct: a free editor for serial section microscopy. J Microsc 218:52–61. 10.1111/j.1365-2818.2005.01466.x [DOI] [PubMed] [Google Scholar]
- Fonzo GA, Goodkind MS, Oathes DJ, Zaiko YV, Harvey M, Peng KK, Weiss ME, Thompson AL, Zack SE, Lindley SE, Arnow BA, Jo B, Gross JJ, Rothbaum BO, Etkin A (2017a) PTSD psychotherapy outcome predicted by brain activation during emotional reactivity and regulation. Am J Psychiatry 174:1163–1174. 10.1176/appi.ajp.2017.16091072 [DOI] [PMC free article] [PubMed] [Google Scholar]
- Fonzo GA, Goodkind MS, Oathes DJ, Zaiko YV, Harvey M, Peng KK, Weiss ME, Thompson AL, Zack SE, Mills-Finnerty CE, Rosenberg BM, Edelstein R, Wright RN, Kole CA, Lindley SE, Arnow BA, Jo B, Gross JJ, Rothbaum BO, Etkin A (2017b) Selective effects of psychotherapy on frontopolar cortical function in PTSD. Am J Psychiatry 174:1175–1184. 10.1176/appi.ajp.2017.16091073 [DOI] [PMC free article] [PubMed] [Google Scholar]
- Freedman LJ, Insel TR, Smith Y (2000) Subcortical projections of area 25 (subgenual cortex) of the macaque monkey. J Comp Neurol 421:172–188. [DOI] [PubMed] [Google Scholar]
- Galaburda AM, Pandya DN (1983) The intrinsic architectonic and connectional organization of the superior temporal region of the rhesus monkey. J Comp Neurol 221:169–184. 10.1002/cne.902210206 [DOI] [PubMed] [Google Scholar]
- Gallyas F. (1979) Silver staining of myelin by means of physical development. Neurol Res 1:203–209. 10.1080/01616412.1979.11739553 [DOI] [PubMed] [Google Scholar]
- García-Cabezas MÁ, Barbas H (2014) A direct anterior cingulate pathway to the primate primary olfactory cortex may control attention to olfaction. Brain Struct Funct 219:1735–1754. 10.1007/s00429-013-0598-3 [DOI] [PMC free article] [PubMed] [Google Scholar]
- García-Cabezas MÁ, John YJ, Barbas H, Zikopoulos B (2016) Distinction of neurons, glia and endothelial cells in the cerebral cortex: an algorithm based on cytological features. Front Neuroanat 10:107. 10.3389/fnana.2016.00107 [DOI] [PMC free article] [PubMed] [Google Scholar]
- García-Cabezas MÁ, Joyce MK, John YJ, Zikopoulos B, Barbas H (2017) Mirror trends of plasticity and stability indicators in primate prefrontal cortex. Eur J Neurosci 46:2392–2405. 10.1111/ejn.13706 [DOI] [PMC free article] [PubMed] [Google Scholar]
- George MS, Ketter TA, Parekh PI, Horwitz B, Herscovitch P, Post RM (1995) Brain activity during transient sadness and happiness in healthy women. Am J Psychiatry 152:341–351. 10.1176/ajp.152.3.341 [DOI] [PubMed] [Google Scholar]
- Ghashghaei HT, Barbas H (2001) Neural interaction between the basal forebrain and functionally distinct prefrontal cortices in the rhesus monkey. Neuroscience 103:593–614. 10.1016/S0306-4522(00)00585-6 [DOI] [PubMed] [Google Scholar]
- Ghashghaei HT, Hilgetag CC, Barbas H (2007) Sequence of information processing for emotions based on the anatomic dialogue between prefrontal cortex and amygdala. Neuroimage 34:905–923. 10.1016/j.neuroimage.2006.09.046 [DOI] [PMC free article] [PubMed] [Google Scholar]
- Gold PW. (2015) The organization of the stress system and its dysregulation in depressive illness. Mol Psychiatry 20:32–47. 10.1038/mp.2014.163 [DOI] [PubMed] [Google Scholar]
- Goldman PS, Nauta WJ (1977) Columnar distribution of cortico-cortical fibers in the frontal association, limbic, and motor cortex of the developing rhesus monkey. Brain Res 122:393–413. 10.1016/0006-8993(77)90453-X [DOI] [PubMed] [Google Scholar]
- Goulas A, Uylings HB, Stiers P (2014) Mapping the hierarchical layout of the structural network of the macaque prefrontal cortex. Cereb Cortex 24:1178–1194. 10.1093/cercor/bhs399 [DOI] [PubMed] [Google Scholar]
- Gundersen HJ. (1986) Stereology of arbitrary particles: a review of unbiased number and size estimators and the presentation of some new ones, in memory of William R. Thompson. J Microsc 143:3–45. 10.1111/j.1365-2818.1986.tb02764.x [DOI] [PubMed] [Google Scholar]
- Gutman DA, Holtzheimer PE, Behrens TE, Johansen-Berg H, Mayberg HS (2009) A tractography analysis of two deep brain stimulation white matter targets for depression. Biol Psychiatry 65:276–282. 10.1016/j.biopsych.2008.09.021 [DOI] [PMC free article] [PubMed] [Google Scholar]
- Hackett TA, Stepniewska I, Kaas JH (1998) Subdivisions of auditory cortex and ipsilateral cortical connections of the parabelt auditory cortex in macaque monkeys. J Comp Neurol 394:475–495. [DOI] [PubMed] [Google Scholar]
- Hackett TA, Takahata T, Balaram P (2011) VGLUT1 and VGLUT2 mRNA expression in the primate auditory pathway. Hear Res 274:129–141. 10.1016/j.heares.2010.11.001 [DOI] [PMC free article] [PubMed] [Google Scholar]
- Haegens S, Barczak A, Musacchia G, Lipton ML, Mehta AD, Lakatos P, Schroeder CE (2015) Laminar profile and physiology of the alpha rhythm in primary visual, auditory, and somatosensory regions of neocortex. J Neurosci 35:14341–14352. 10.1523/JNEUROSCI.0600-15.2015 [DOI] [PMC free article] [PubMed] [Google Scholar]
- Hamani C, Mayberg H, Snyder B, Giacobbe P, Kennedy S, Lozano AM (2009) Deep brain stimulation of the subcallosal cingulate gyrus for depression: anatomical location of active contacts in clinical responders and a suggested guideline for targeting. J Neurosurg 111:1209–1215. 10.3171/2008.10.JNS08763 [DOI] [PubMed] [Google Scholar]
- Hamani C, Mayberg H, Stone S, Laxton A, Haber S, Lozano AM (2011) The subcallosal cingulate gyrus in the context of major depression. Biol Psychiatry 69:301–308. 10.1016/j.biopsych.2010.09.034 [DOI] [PubMed] [Google Scholar]
- Heilbronner SR, Rodriguez-Romaguera J, Quirk GJ, Groenewegen HJ, Haber SN (2016) Circuit-based corticostriatal homologies between rat and primate. Biol Psychiatry 80:509–521. 10.1016/j.biopsych.2016.05.012 [DOI] [PMC free article] [PubMed] [Google Scholar]
- Heimer L, Van Hoesen GW (2006) The limbic lobe and its output channels: implications for emotional functions and adaptive behavior. Neurosci Biobehav Rev 30:126–147. 10.1016/j.neubiorev.2005.06.006 [DOI] [PubMed] [Google Scholar]
- Hilgetag CC, Medalla M, Beul SF, Barbas H (2016) The primate connectome in context: principles of connections of the cortical visual system. Neuroimage 134:685–702. 10.1016/j.neuroimage.2016.04.017 [DOI] [PMC free article] [PubMed] [Google Scholar]
- Höistad M, Barbas H (2008) Sequence of information processing for emotions through pathways linking temporal and insular cortices with the amygdala. Neuroimage 40:1016–1033. 10.1016/j.neuroimage.2007.12.043 [DOI] [PMC free article] [PubMed] [Google Scholar]
- Howard CV, Reed MG (1998) Unbiased stereology, three-dimensional measurement in microscopy. Oxford: BIOS Scientific. [Google Scholar]
- Insausti R, Muñoz M (2001) Cortical projections of the non-entorhinal hippocampal formation in the cynomolgus monkey (Macaca fascicularis). Eur J Neurosci 14:435–451. 10.1046/j.0953-816x.2001.01662.x [DOI] [PubMed] [Google Scholar]
- Jiao Y, Sun Z, Lee T, Fusco FR, Kimble TD, Meade CA, Cuthbertson S, Reiner A (1999) A simple and sensitive antigen retrieval method for free-floating and slide-mounted tissue sections. J Neurosci Methods 93:149–162. 10.1016/S0165-0270(99)00142-9 [DOI] [PubMed] [Google Scholar]
- Johansen-Berg H, Gutman DA, Behrens TE, Matthews PM, Rushworth MF, Katz E, Lozano AM, Mayberg HS (2008) Anatomical connectivity of the subgenual cingulate region targeted with deep brain stimulation for treatment-resistant depression. Cereb Cortex 18:1374–1383. 10.1093/cercor/bhm167 [DOI] [PMC free article] [PubMed] [Google Scholar]
- Kaada BR, Pribram KH, Epstein JA (1949) Respiratory and vascular responses in monkeys from temporal pole, insula, orbital surface and cingulate gyrus. J Neurophysiol 12:348–356. 10.1152/jn.1949.12.5.347 [DOI] [PubMed] [Google Scholar]
- Kawaguchi Y, Kubota Y (1997) GABAergic cell subtypes and their synaptic connections in rat frontal cortex. Cereb Cortex 7:476–486. 10.1093/cercor/7.6.476 [DOI] [PubMed] [Google Scholar]
- Kirk IJ, Mackay JC (2003) The role of theta-range oscillations in synchronising and integrating activity in distributed mnemonic networks. Cortex 39:993–1008. 10.1016/S0010-9452(08)70874-8 [DOI] [PubMed] [Google Scholar]
- Koechlin E, Basso G, Pietrini P, Panzer S, Grafman J (1999) The role of the anterior prefrontal cortex in human cognition. Nature 399:148–151. 10.1038/20178 [DOI] [PubMed] [Google Scholar]
- Kondo H, Saleem KS, Price JL (2003) Differential connections of the temporal pole with the orbital and medial prefrontal networks in macaque monkeys. J Comp Neurol 465:499–523. 10.1002/cne.10842 [DOI] [PubMed] [Google Scholar]
- Kondo H, Saleem KS, Price JL (2005) Differential connections of the perirhinal and parahippocampal cortex with the orbital and medial prefrontal networks in macaque monkeys. J Comp Neurol 493:479–509. 10.1002/cne.20796 [DOI] [PubMed] [Google Scholar]
- Kopell NJ, Gritton HJ, Whittington MA, Kramer MA (2014) Beyond the connectome: the dynome. Neuron 83:1319–1328. 10.1016/j.neuron.2014.08.016 [DOI] [PMC free article] [PubMed] [Google Scholar]
- Le Van Quyen M, Muller LE 2nd, Teleńczuk B, Halgren E, Cash S, Hatsopoulos NG, Dehghani N, Destexhe A (2016) High-frequency oscillations in human and monkey neocortex during the wake-sleep cycle. Proc Natl Acad Sci U S A 113:9363–9368. 10.1073/pnas.1523583113 [DOI] [PMC free article] [PubMed] [Google Scholar]
- Liotti M, Mayberg HS, McGinnis S, Brannan SL, Jerabek P (2002) Unmasking disease-specific cerebral blood flow abnormalities: mood challenge in patients with remitted unipolar depression. Am J Psychiatry 159:1830–1840. 10.1176/appi.ajp.159.11.1830 [DOI] [PubMed] [Google Scholar]
- Mackey S, Petrides M (2014) Architecture and morphology of the human ventromedial prefrontal cortex. Eur J Neurosci 40:2777–2796. 10.1111/ejn.12654 [DOI] [PubMed] [Google Scholar]
- Malkova L, Heuer E, Saunders RC (2006) Longitudinal magnetic resonance imaging study of rhesus monkey brain development. Eur J Neurosci 24:3204–3212. 10.1111/j.1460-9568.2006.05175.x [DOI] [PubMed] [Google Scholar]
- Mayberg HS. (1997) Limbic-cortical dysregulation: a proposed model of depression. J Neuropsychiatry Clin Neurosci 9:471–481. 10.1176/jnp.9.3.471 [DOI] [PubMed] [Google Scholar]
- Mayberg HS. (2003) Modulating dysfunctional limbic-cortical circuits in depression: towards development of brain-based algorithms for diagnosis and optimised treatment. Br Med Bull 65:193–207. 10.1093/bmb/65.1.193 [DOI] [PubMed] [Google Scholar]
- Mayberg HS, Liotti M, Brannan SK, McGinnis S, Mahurin RK, Jerabek PA, Silva JA, Tekell JL, Martin CC, Lancaster JL, Fox PT (1999) Reciprocal limbic-cortical function and negative mood: converging PET findings in depression and normal sadness. Am J Psychiatry 156:675–682. 10.1176/ajp.156.5.675 [DOI] [PubMed] [Google Scholar]
- Mayberg HS, Lozano AM, Voon V, McNeely HE, Seminowicz D, Hamani C, Schwalb JM, Kennedy SH (2005) Deep brain stimulation for treatment-resistant depression. Neuron 45:651–660. 10.1016/j.neuron.2005.02.014 [DOI] [PubMed] [Google Scholar]
- Medalla M, Barbas H (2010) Anterior cingulate synapses in prefrontal areas 10 and 46 suggest differential influence in cognitive control. J Neurosci 30:16068–16081. 10.1523/JNEUROSCI.1773-10.2010 [DOI] [PMC free article] [PubMed] [Google Scholar]
- Medalla M, Barbas H (2014) Specialized prefrontal “auditory fields”: organization of primate prefrontal-temporal pathways. Front Neurosci 8:77. 10.3389/fnins.2014.00077 [DOI] [PMC free article] [PubMed] [Google Scholar]
- Medalla M, Lera P, Feinberg M, Barbas H (2007) Specificity in inhibitory systems associated with prefrontal pathways to temporal cortex in primates. Cereb Cortex 17 [Suppl 1]:i136–i150. [DOI] [PubMed] [Google Scholar]
- Meskenaite V. (1997) Calretinin-immunoreactive local circuit neurons in area 17 of the cynomolgus monkey, Macaca fascicularis. J Comp Neurol 379:113–132. [DOI] [PubMed] [Google Scholar]
- Mesulam MM, Van Hoesen GW, Pandya DN, Geschwind N (1977) Limbic and sensory connections of the inferior parietal lobule (area PG) in the rhesus monkey: a study with a new method for horseradish peroxidase histochemistry. Brain Res 136:393–414. 10.1016/0006-8993(77)90066-X [DOI] [PubMed] [Google Scholar]
- Mesulam MM, Mufson EJ, Levey AI, Wainer BH (1983) Cholinergic innervation of cortex by the basal forebrain: cytochemistry and cortical connections of the septal area, diagonal band nuclei, nuclei, nucleus basalis (substantia innominata), and hypothalamus in the rhesus monkey. J Comp Neurol 214:170–197. 10.1002/cne.902140206 [DOI] [PubMed] [Google Scholar]
- Michalareas G, Vezoli J, van Pelt S, Schoffelen JM, Kennedy H, Fries P (2016) Alpha-beta and gamma rhythms subserve feedback and feedforward influences among human visual cortical areas. Neuron 89:384–397. 10.1016/j.neuron.2015.12.018 [DOI] [PMC free article] [PubMed] [Google Scholar]
- Mikkonen M, Soininen H, Pitkänen A (1997) Distribution of parvalbumin-, calretinin-, and calbindin-D28k-immunoreactive neurons and fibers in the human entorhinal cortex. J Comp Neurol 388:64–88. [DOI] [PubMed] [Google Scholar]
- Morecraft RJ, Geula C, Mesulam MM (1992) Cytoarchitecture and neural afferents of orbitofrontal cortex in the brain of the monkey. J Comp Neurol 323:341–358. 10.1002/cne.903230304 [DOI] [PubMed] [Google Scholar]
- Morecraft RJ, Rockland KS, Van Hoesen GW (2000) Localization of area prostriata and its projection to the cingulate motor cortex in the rhesus monkey. Cereb Cortex 10:192–203. 10.1093/cercor/10.2.192 [DOI] [PubMed] [Google Scholar]
- Morecraft RJ, Cipolloni PB, Stilwell-Morecraft KS, Gedney MT, Pandya DN (2004) Cytoarchitecture and cortical connections of the posterior cingulate and adjacent somatosensory fields in the rhesus monkey. J Comp Neurol 469:37–69. 10.1002/cne.10980 [DOI] [PubMed] [Google Scholar]
- Morecraft RJ, Stilwell-Morecraft KS, Cipolloni PB, Ge J, McNeal DW, Pandya DN (2012) Cytoarchitecture and cortical connections of the anterior cingulate and adjacent somatomotor fields in the rhesus monkey. Brain Res Bull 87:457–497. 10.1016/j.brainresbull.2011.12.005 [DOI] [PMC free article] [PubMed] [Google Scholar]
- Morris R, Petrides M, Pandya DN (1999) Architecture and connections of retrosplenial area 30 in the rhesus monkey (Macaca mulatta). Eur J Neurosci 11:2506–2518. 10.1046/j.1460-9568.1999.00672.x [DOI] [PubMed] [Google Scholar]
- Murray EA, Wise SP (2010) What, if anything, can monkeys tell us about human amnesia when they can't say anything at all? Neuropsychologia 48:2385–2405. 10.1016/j.neuropsychologia.2010.01.011 [DOI] [PMC free article] [PubMed] [Google Scholar]
- Myers-Schulz B, Koenigs M (2012) Functional anatomy of ventromedial prefrontal cortex: implications for mood and anxiety disorders. Mol Psychiatry 17:132–141. 10.1038/mp.2011.88 [DOI] [PMC free article] [PubMed] [Google Scholar]
- Nauta WJ. (1971) The problem of the frontal lobe: a reinterpretation. J Psychiatr Res 8:167–187. 10.1016/0022-3956(71)90017-3 [DOI] [PubMed] [Google Scholar]
- Ochsner KN, Ray RD, Cooper JC, Robertson ER, Chopra S, Gabrieli JD, Gross JJ (2004) For better or for worse: neural systems supporting the cognitive down- and up-regulation of negative emotion. Neuroimage 23:483–499. 10.1016/j.neuroimage.2004.06.030 [DOI] [PubMed] [Google Scholar]
- Ongür D, Price JL (2000) The organization of networks within the orbital and medial prefrontal cortex of rats, monkeys and humans. Cereb Cortex 10:206–219. 10.1093/cercor/10.3.206 [DOI] [PubMed] [Google Scholar]
- Ongür D, An X, Price JL (1998) Prefrontal cortical projections to the hypothalamus in macaque monkeys. J Comp Neurol 401:480–505. [DOI] [PubMed] [Google Scholar]
- Palomero-Gallagher N, Eickhoff SB, Hoffstaedter F, Schleicher A, Mohlberg H, Vogt BA, Amunts K, Zilles K (2015) Functional organization of human subgenual cortical areas: relationship between architectonical segregation and connectional heterogeneity. Neuroimage 115:177–190. 10.1016/j.neuroimage.2015.04.053 [DOI] [PMC free article] [PubMed] [Google Scholar]
- Pandya DN, Kuypers HG (1969) Cortico-cortical connections in the rhesus monkey. Brain Res 13:13–36. 10.1016/0006-8993(69)90141-3 [DOI] [PubMed] [Google Scholar]
- Pandya DN, Sanides F (1973) Architectonic parcellation of the temporal operculum in rhesus monkey and its projection pattern. Z Anat Entwicklungsgesch 139:127–161. 10.1007/BF00523634 [DOI] [PubMed] [Google Scholar]
- Pandya DN, Seltzer B (1982) Intrinsic connections and architectonics of posterior parietal cortex in the rhesus monkey. J Comp Neurol 204:196–210. 10.1002/cne.902040208 [DOI] [PubMed] [Google Scholar]
- Pessoa L. (2017) A network model of the emotional brain. Trends Cogn Sci 21:357–371. 10.1016/j.tics.2017.03.002 [DOI] [PMC free article] [PubMed] [Google Scholar]
- Petrides M, Pandya DN (1984) Projections to the frontal cortex from the posterior parietal region in the rhesus monkey. J Comp Neurol 228:105–116. 10.1002/cne.902280110 [DOI] [PubMed] [Google Scholar]
- Petrides M, Pandya DN (2007) Efferent association pathways from the rostral prefrontal cortex in the macaque monkey. J Neurosci 27:11573–11586. 10.1523/JNEUROSCI.2419-07.2007 [DOI] [PMC free article] [PubMed] [Google Scholar]
- Petrides M, Tomaiuolo F, Yeterian EH, Pandya DN (2012) The prefrontal cortex: comparative architectonic organization in the human and the macaque monkey brains. Cortex 48:46–57. 10.1016/j.cortex.2011.07.002 [DOI] [PubMed] [Google Scholar]
- Phelps EA, Delgado MR, Nearing KI, LeDoux JE (2004) Extinction learning in humans: role of the amygdala and vmPFC. Neuron 43:897–905. 10.1016/j.neuron.2004.08.042 [DOI] [PubMed] [Google Scholar]
- Plakke B, Romanski LM (2014) Auditory connections and functions of prefrontal cortex. Front Neurosci 8:199. 10.3389/fnins.2014.00199 [DOI] [PMC free article] [PubMed] [Google Scholar]
- Poremba A, Malloy M, Saunders RC, Carson RE, Herscovitch P, Mishkin M (2004) Species-specific calls evoke asymmetric activity in the monkey's temporal poles. Nature 427:448–451. 10.1038/nature02268 [DOI] [PubMed] [Google Scholar]
- Poremba A, Bigelow J, Rossi B (2013) Processing of communication sounds: contributions of learning, memory, and experience. Hear Res 305:31–44. 10.1016/j.heares.2013.06.005 [DOI] [PMC free article] [PubMed] [Google Scholar]
- Preuss TM, Goldman-Rakic PS (1991) Myelo- and cytoarchitecture of the granular frontal cortex and surrounding regions in the strepsirhine primate galago and the anthropoid primate macaca. J Comp Neurol 310:429–474. 10.1002/cne.903100402 [DOI] [PubMed] [Google Scholar]
- Rasband WS. (1997–2014) ImageJ. Bethesda, MD: National Institutes of Health. [Google Scholar]
- Reiner A, Veenman CL, Medina L, Jiao Y, Del Mar N, Honig MG (2000) Pathway tracing using biotinylated dextran amines. J Neurosci Methods 103:23–37. 10.1016/S0165-0270(00)00293-4 [DOI] [PubMed] [Google Scholar]
- Rempel-Clower NL, Barbas H (1998) Topographic organization of connections between the hypothalamus and prefrontal cortex in the rhesus monkey. J Comp Neurol 398:393–419. [DOI] [PubMed] [Google Scholar]
- Rempel-Clower NL, Barbas H (2000) The laminar pattern of connections between prefrontal and anterior temporal cortices in the rhesus monkey is related to cortical structure and function. Cereb Cortex 10:851–865. 10.1093/cercor/10.9.851 [DOI] [PubMed] [Google Scholar]
- Richmond FJ, Gladdy R, Creasy JL, Kitamura S, Smits E, Thomson DB (1994) Efficacy of seven retrograde tracers, compared in multiple-labelling studies of feline motoneurones. J Neurosci Methods 53:35–46. 10.1016/0165-0270(94)90142-2 [DOI] [PubMed] [Google Scholar]
- Riva-Posse P, Choi KS, Holtzheimer PE, McIntyre CC, Gross RE, Chaturvedi A, Crowell AL, Garlow SJ, Rajendra JK, Mayberg HS (2014) Defining critical white matter pathways mediating successful subcallosal cingulate deep brain stimulation for treatment-resistant depression. Biol Psychiatry 76:963–969. 10.1016/j.biopsych.2014.03.029 [DOI] [PMC free article] [PubMed] [Google Scholar]
- Rockland KS, Drash GW (1996) Collateralized divergent feedback connections that target multiple cortical areas. J Comp Neurol 373:529–548. [DOI] [PubMed] [Google Scholar]
- Rodman HR. (1994) Development of inferior temporal cortex in the monkey. Cereb Cortex 5:484–498. [DOI] [PubMed] [Google Scholar]
- Romanski LM, Averbeck BB (2009) The primate cortical auditory system and neural representation of conspecific vocalizations. Annu Rev Neurosci 32:315–346. 10.1146/annurev.neuro.051508.135431 [DOI] [PMC free article] [PubMed] [Google Scholar]
- Rosene DL, Van Hoesen GW (1977) Hippocampal efferents reach widespread areas of cerebral cortex and amygdala in the rhesus monkey. Science 198:315–317. 10.1126/science.410102 [DOI] [PubMed] [Google Scholar]
- Rosene DL, Roy NJ, Davis BJ (1986) A cryoprotection method that facilitates cutting frozen sections of whole monkey brains from histological and histochemical processing without freezing artifact. J Histochem Cytochem 34:1301–1315. 10.1177/34.10.3745909 [DOI] [PubMed] [Google Scholar]
- Sah P, Faber ES, Lopez De Armentia M, Power J (2003) The amygdaloid complex: anatomy and physiology. Physiol Rev 83:803–834. 10.1152/physrev.00002.2003 [DOI] [PubMed] [Google Scholar]
- Saleem KS, Price JL, Hashikawa T (2007) Cytoarchitectonic and chemoarchitectonic subdivisions of the perirhinal and parahippocampal cortices in macaque monkeys. J Comp Neurol 500:973–1006. 10.1002/cne.21141 [DOI] [PubMed] [Google Scholar]
- Saleem KS, Kondo H, Price JL (2008) Complementary circuits connecting the orbital and medial prefrontal networks with the temporal, insular, and opercular cortex in the macaque monkey. J Comp Neurol 506:659–693. 10.1002/cne.21577 [DOI] [PubMed] [Google Scholar]
- Salzman CD, Fusi S (2010) Emotion, cognition, and mental state representation in amygdala and prefrontal cortex. Annu Rev Neurosci 33:173–202. 10.1146/annurev.neuro.051508.135256 [DOI] [PMC free article] [PubMed] [Google Scholar]
- Scannell JW, Grant S, Payne BR, Baddeley R (2000) On variability in the density of corticocortical and thalamocortical connections. Philos Trans R Soc Lond B Biol Sci 355:21–35. 10.1098/rstb.2000.0547 [DOI] [PMC free article] [PubMed] [Google Scholar]
- Schiller D, Eichenbaum H, Buffalo EA, Davachi L, Foster DJ, Leutgeb S, Ranganath C (2015) Memory and space: towards an understanding of the cognitive map. J Neurosci 35:13904–13911. 10.1523/JNEUROSCI.2618-15.2015 [DOI] [PMC free article] [PubMed] [Google Scholar]
- Schroeder CE, Lakatos P (2009) Low-frequency neuronal oscillations as instruments of sensory selection. Trends Neurosci 32:9–18. 10.1016/j.tins.2008.09.012 [DOI] [PMC free article] [PubMed] [Google Scholar]
- Schwartz ML, Goldman-Rakic PS (1991) Prenatal specification of callosal connections in rhesus monkey. J Comp Neurol 307:144–162. 10.1002/cne.903070113 [DOI] [PubMed] [Google Scholar]
- Seltzer B, Pandya DN (1978) Afferent cortical connections and architectonics of the superior temporal sulcus and surrounding cortex in the rhesus monkey. Brain Res 149:1–24. 10.1016/0006-8993(78)90584-X [DOI] [PubMed] [Google Scholar]
- Semendeferi K, Armstrong E, Schleicher A, Zilles K, Van Hoesen GW (2001) Prefrontal cortex in humans and apes: a comparative study of area 10. Am J Phys Anthropol 114:224–241. [DOI] [PubMed] [Google Scholar]
- Showers MJ, Crosby EC (1958) Somatic and visceral responses from the cingulate gyrus. Neurology 8:561–565. 10.1212/WNL.8.7.561 [DOI] [PubMed] [Google Scholar]
- Spaak E, Bonnefond M, Maier A, Leopold DA, Jensen O (2012) Layer-specific entrainment of gamma-band neural activity by the alpha rhythm in monkey visual cortex. Curr Biol 22:2313–2318. 10.1016/j.cub.2012.10.020 [DOI] [PMC free article] [PubMed] [Google Scholar]
- Steinvorth S, Wang C, Ulbert I, Schomer D, Halgren E (2010) Human entorhinal gamma and theta oscillations selective for remote autobiographical memory. Hippocampus 20:166–173. 10.1002/hipo.20597 [DOI] [PubMed] [Google Scholar]
- Suzuki WA, Amaral DG (2003) Perirhinal and parahippocampal cortices of the macaque monkey: cytoarchitectonic and chemoarchitectonic organization. J Comp Neurol 463:67–91. 10.1002/cne.10744 [DOI] [PubMed] [Google Scholar]
- Teleńczuk B, Dehghani N, Le Van Quyen M, Cash SS, Halgren E, Hatsopoulos NG, Destexhe A (2017) Local field potentials primarily reflect inhibitory neuron activity in human and monkey cortex. Sci Rep 7:40211. 10.1038/srep40211 [DOI] [PMC free article] [PubMed] [Google Scholar]
- Timbie C, Barbas H (2015) Pathways for emotions: specializations in the amygdalar, mediodorsal thalamic, and posterior orbitofrontal network. J Neurosci 35:11976–11987. 10.1523/JNEUROSCI.2157-15.2015 [DOI] [PMC free article] [PubMed] [Google Scholar]
- Ungerleider L, Mishkin M (1982) Two cortical visual systems. In: Analysis of visual behavior (Ingle DJ, Goodale MA, Mansfield RJW, eds), pp 549–586. Cambridge: Massachusetts Institute of Technology. [Google Scholar]
- van Kerkoerle T, Self MW, Dagnino B, Gariel-Mathis MA, Poort J, van der Togt C, Roelfsema PR (2014) Alpha and gamma oscillations characterize feedback and feedforward processing in monkey visual cortex. Proc Natl Acad Sci U S A 111:14332–14341. 10.1073/pnas.1402773111 [DOI] [PMC free article] [PubMed] [Google Scholar]
- Veenman CL, Reiner A, Honig MG (1992) Biotinylated dextran amine as an anterograde tracer for single- and double-labeling studies. J Neurosci Methods 41:239–254. 10.1016/0165-0270(92)90089-V [DOI] [PubMed] [Google Scholar]
- Vergani F, Martino J, Morris C, Attems J, Ashkan K, Dell'Acqua F (2016) Anatomic connections of the subgenual cingulate region. Neurosurgery 79:465–472. 10.1227/NEU.0000000000001315 [DOI] [PubMed] [Google Scholar]
- Vogt BA, Pandya DN (1987) Cingulate cortex of the rhesus monkey: II. Cortical afferents. J Comp Neurol 262:271–289. 10.1002/cne.902620208 [DOI] [PubMed] [Google Scholar]
- von Stein A, Chiang C, König P (2000) Top-down processing mediated by interareal synchronization. Proc Natl Acad Sci U S A 97:14748–14753. 10.1073/pnas.97.26.14748 [DOI] [PMC free article] [PubMed] [Google Scholar]
- Walker AE. (1940) A cytoarchitectural study of the prefrontal area of the macaque monkey. J Comp Neurol 73:59–86. 10.1002/cne.900730106 [DOI] [Google Scholar]
- Wang XJ, Tegnér J, Constantinidis C, Goldman-Rakic PS (2004) Division of labor among distinct subtypes of inhibitory neurons in a cortical microcircuit of working memory. Proc Natl Acad Sci U S A 101:1368–1373. 10.1073/pnas.0305337101 [DOI] [PMC free article] [PubMed] [Google Scholar]
- Wimmer K, Ramon M, Pasternak T, Compte A (2016) Transitions between multiband oscillatory patterns characterize memory-guided perceptual decisions in prefrontal circuits. J Neurosci 36:489–505. 10.1523/JNEUROSCI.3678-15.2016 [DOI] [PMC free article] [PubMed] [Google Scholar]
- Yakovlev PI, Lecours AR (1967) The myelogenetic cycles of regional maturation of the brain. In: Regional development of the brain in early life (Minowski A, ed), pp 3–70. Oxford: Blackwell Scientific. [Google Scholar]
- Yeterian EH, Pandya DN, Tomaiuolo F, Petrides M (2012) The cortical connectivity of the prefrontal cortex in the monkey brain. Cortex 48:58–81. 10.1016/j.cortex.2011.03.004 [DOI] [PMC free article] [PubMed] [Google Scholar]
- Yu HH, Chaplin TA, Davies AJ, Verma R, Rosa MG (2012) A specialized area in limbic cortex for fast analysis of peripheral vision. Curr Biol 22:1351–1357. 10.1016/j.cub.2012.05.029 [DOI] [PubMed] [Google Scholar]
- Zikopoulos B, John YJ, García-Cabezas MÁ, Bunce JG, Barbas H (2016) The intercalated nuclear complex of the primate amygdala. Neuroscience 330:267–290. 10.1016/j.neuroscience.2016.05.052 [DOI] [PMC free article] [PubMed] [Google Scholar]