Abstract
Extracorporeal photopheresis (ECP) has been used successfully in the treatment of erythrodermic cutaneous T cell lymphoma (CTCL), and other T cell-mediated disorders. Not all patients obtain a significant or durable response from ECP. The design of a selective photosensitizer that spares desirable lymphocytes while targeting malignant T cells may promote cytotoxic T cell responses and improve outcomes after ECP. A series of selenorhodamines built with variations of the Texas red core targeted the mitochondria of malignant T cells, were phototoxic to malignant T cells presumably via their ability to generate singlet oxygen, and were transported by P-glycoprotein (P-gp). To determine the selectivity of the photosensitizers in the ECP milieu, staphylococcal enterotoxin B (SEB)-stimulated and non-stimulated human lymphocytes were combined with HUT-78 cells (a CTCL) to simulate ECP. The amide-containing analogues of the selenorhodamines were transported more rapidly than the thioamide analogues in monolayers of MDCKII-MDR1 cells and, consequently, were extruded more rapidly from P-gp-expressing T cells than the corresponding thioamide analogues. Selenorhodamine 6 with the Texas red core and a piperidylamide functionality was phototoxic to >90% of malignant T cells while sparing >60% of both stimulated and non-stimulated T cells. In the resting T cells, (63 ± 7)% of the CD4+ T cell compartment, and (78 ± 2.5)% of the CD8+ cytotoxic T cell population were preserved, resulting in an enrichment of healthy and cytotoxic T cells after photodepletion.
Keywords: T cell malignancy, P-glycoprotein, Photopheresis, Phototherapy, Selenorhodamines
1. Introduction
Extracorporeal photopheresis (ECP) has been used successfully for more than 30 years in the treatment of erythrodermic cutaneous T cell lymphoma (CTCL), and more recently has shown promising results in several T cell-mediated disorders, including systemic sclerosis, treatment and prevention of solid organ rejection, graft-versus-host disease, and Crohn’s disease.1 Although response rates vary, the use of ECP may facilitate control of disease and improve overall survival. However, not all patients obtain a significant or durable response,2 indicating that improvements in the procedure warrant investigation. In particular, the design of photosensitizers that spare desirable lymphocytes while targeting malignant or pathogenic T cells would be an important advance.
ECP is an immunomodulating procedure in which peripheral blood mononuclear cells (PBMCs) are separated from pheresed whole blood ex vivo. The lymphocytes are collected and exposed to the photosensitizer 8-methoxypsoralen (8-MOP) and are then irradiated with UVA (PUVA), which cross-links DNA within the nuclei of the cells and induces apoptosis. The subsequent reinfusion of the apoptotic lymphocytes produces the immunomodulatory effect. Although the mechanism of ECP is not well established, a vaccination effect is hypothesized to occur against the pathogenic T cells. After photodepletion, phagocytosis by antigen-presenting cells of membrane markers derived from apoptotic pathogenic cells induces cytotoxic T cell responses. Disease control is then mediated through cytotoxic T cells with disease specificity.3 However, 8-MOP is non-selective and DNA cross-linking by 8-MOP is indiscriminate and occurs in all cells resulting in non-malignant and resting lymphocytes significantly contributing to the apoptotic milieu. Reinfusion of these non-targeted cells may serve to limit the production of disease-specific cytotoxic T lymphocytes.4,5 Consequently, the efficiency of ECP may be improved with the use of a more selective photosensitizer.
We have previously demonstrated that prolonged intracellular resident times of a photosensitive agent were associated with non-selective depletion of susceptible lymphocyte subsets.6 Dibromorhodamine-123 methyl ester is a photosensitizer that is highly dependent on P-glycoprotein (P-gp) for cell extrusion,7,8 and cells that express low P-gp activity are susceptible to increased intracellular dye accumulation. Consequently, lymphocyte subsets with low P-gp activity, such as CD4+ and memory T cells, are disproportionately depleted when using this agent.9 In the clinical setting of immunotherapy, the use of dibromorhodamine-123 methyl ester resulted in the non-selective depletion of lymphocytes important for normal immune responses, and poor patient outcomes.6 A more selective photosensitizer that protects healthy lymphocytes from non-selective depletion will lead to improvements in ECP.
In prior studies we examined stimulation and inhibition of P-gp ATPase activity within several series of photosensitizers.10–13 In particular, simple substitutions within a series of chalcogenorhodamine structures gave molecules that bind P-gp but can be either highly stimulating or inhibiting for P-gp ATPase activity.10,11 Specific tertiary amide substitutions are ATPase stimulating while specific tertiary thioamide substitutions inhibit ATPase activity.12,13 The thioamide/amide modification effectively controls transport rates of rhodamine derivatives in both absorptive and secretory directions in the cell.
Selenorhodamine analogues are more effective photosensitizers in vitro than rhodamines bearing the lighter chalcogens O and S for photodynamic therapy of both chemoresponsive14 and P-gp-expressing, drug-resistant15 cancer cells. This, perhaps, is a consequence of the increased quantum yields for the generation of singlet oxygen [Φ(1O2)] in the Se-containing analogues relative to the S-containing analogues.14,16 Singlet oxygen is one of the reactive oxygen species responsible for phototoxicity in photodynamic therapy (PDT),17 including the purging of cells using dibromorhodamine-123 methyl ester in ECP.7,8 Studies of whole-cell cytochrome c oxidase activity suggest that the mitochondria are targets for the chalcogenorhodamine dyes 1 and 2 (Chart 1).14 Thioamide-containing selenorhodamine 318 (Chart 1) is an effective photosensitizer for PDT of P-gp-expressing Colo-26 cells.18 In contrast, amide-containing 4 (Chart 1) is much less phototoxic and is extruded from Colo-26 cells presumably due to its ability to stimulate ATPase activity in P-gp. Thioamide 5 (Chart 2) is also an effective photosensitizer for PDT of Colo-26 cells.19
Chart 1.
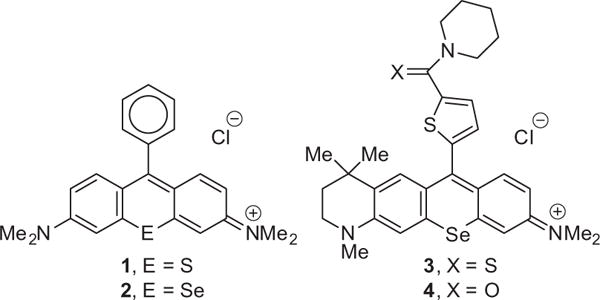
Structures of chalcogenorhodamines 1–4.
Chart 2.
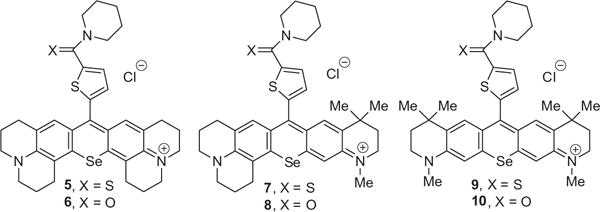
Structures of selenorhodamines 5–10 with variations of the Texas red core.
One approach to improve ECP is to develop a photosensitizer that accumulates in malignant T cells while having limited uptake or retention in healthy lymphocyte subsets. In order to evaluate the performance of some new photosensitizers for ECP, we developed a model of ECP using resting, pathogenic, and malignant T cells. Non-stimulated and staphylococcal enterotoxin B (SEB)-stimulated human lymphocytes were mixed with malignant T cells (HUT-78, human CTCL Sezary cells). Selenorhodamines 5–10 (Chart 2) related in structure to the Texas reds were then evaluated for selectivity towards malignant T cells, and for the ability to spare resting T cells. A comparison of thioamide/amide pairs within this series allowed the identification of a lead photosensitizer, which may present an alternative to 8-MOP to increase the efficiency of ECP and to improve clinical outcomes.
2. Results and discussion
2.1. Synthesis of selenorhodamines 5–10
The syntheses of 9-(5-(piperidylcarbamothioyl)thiophen-2-yl)-2,3,6,7,12,13,16,17-octahydro-[1H,5H,11H,15H]-10-selenoxantheno[2,3,4-ij:5,6,7-i′j′]diquinolizin-18-ium chloride (5) and 9-(5-(piperidylcarbamoyl)thiophen-2-yl)-2,3,6,7,12,13,16,17-octa-hydro[1H,5H,11H,15H]-10-selenoxantheno-[2,3,4-ij:5,6,7-i′j′]diquinolizin-18-ium chloride (6) have been previously described19 and a similar synthetic approach was employed for the synthesis of 7–10. Xanthones 11 and 12 were prepared as previously described.20 Deprotonation of thiophene derivative 1318 with LDA gave 2-lithiothiophene 14, which was then added to THF solutions of 11 and 1220 at −78 °C (Scheme 1). Workup with aqueous HPF6 gave 7 and 9 in 88% and 79% isolated yield, respectively, as the PF6 salts. Both 7 and 9 were converted to amides 8 and 10, respectively, with trifluoroacetic anhydride (TFAA) in refluxing CH2Cl2 (Scheme 1). Workup with aqueous Na2CO3 gave 8 and 10 in 56% and 55% yield, respectively. All PF6 salts of the rhodamines were converted to the chloride salts 7–10 with a chloride ion exchange resin.
Scheme 1.
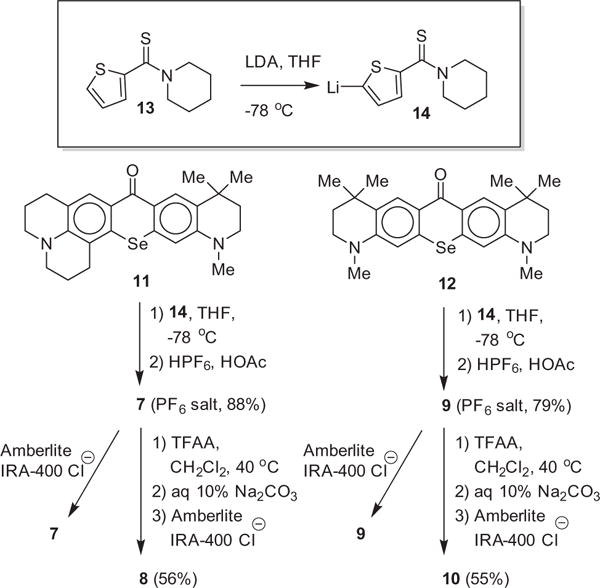
Synthesis of selenorhodamines 7–10 from selenoxanthones 11 and 12.
2.2. Electronic absorption spectra
Absorption maxima (λmax) and molar extinction coefficients (ε) in MeOH for 5–10 are compiled in Table 1. In all three thioamide/amide pairs, values of λmax were the same for each pair. The Texas red analogues 5 and 6 gave λmax of 626 nm with values of ε of 9.9 × 10⁴ and 1.35 × 10⁵ M−1 cm−1, respectively. Replacing one julolidyl fragment of 5 and 6 with an N-methyl tetrahydroquinoline gave λmax of 620 nm for 7 and 8 while replacing both julolidyl fragments with N-methyl tetrahydroquinolines gave λmax of 614 nm for 9 and 10. Rhodamines 7–10 also absorb light strongly at λmax with values of ε between 9.2 × 10⁴ and 1.10 × 10⁵ M−1 cm−1.
Table 1.
Absorption maxima (λmax) and molar extinction coefficients (ε) in CH3OH, fluorescence emission maxima (λFL) and quantum yields for fluorescence (ΦFL) in CH3OH, quantum yields for the generation of singlet oxygen [Φ(1O2)] in CH3OH, n-octanol/water partition coefficients (log P) for selenorhodamines 5–10a
| Compd | λmax, nm | ε, M−1 cm−1 | λFL, nm | ΦFLb | Φ(1O2)a | log P |
|---|---|---|---|---|---|---|
| 3c | 608 | 8.11 × 10⁴ | 634 | 0.008 ± 0.001 | 0.44 ± 0.03 | 1.61 ± 0.06 |
| 4c | 609 | 8.73 × 10⁴ | 634 | 0.009 ± 0.001 | 0.48 ± 0.03 | 2.23 ± 0.04 |
| 5d | 626 | 9.9 × 10⁴ | 660 | 0.010 ± 0.002 | 0.51 ± 0.03 | 4.1 ± 0.2 |
| 6d | 626 | 1.35 × 10⁵ | 660 | 0.012 ± 0.001 | 0.64 ± 0.03 | 3.71 ± 0.08 |
| 7 | 620 | 9.2 × 10⁴ | 650 | 0.008 ± 0.001 | 0.54 ± 0.03 | 3.78 ± 0.03 |
| 8 | 620 | 1.10 × 10⁵ | 650 | 0.009 ± 0.001 | 0.64 ± 0.03 | 3.51 ± 0.04 |
| 9 | 614 | 9.3 × 10⁴ | 645 | 0.006 ± 0.001 | 0.64 ± 0.03 | 3.7 ± 0.1 |
| 10 | 614 | 1.05 × 10⁵ | 645 | 0.007 ± 0.001 | 0.95 ± 0.03 | 3.42 ± 0.06 |
2.3. Fluorescence yields
Steady-state fluorescence spectra for 5–10 were acquired with excitation at 532 nm using 2 as a standard (ΦFL = 0.009).16 Selenorhodamines 5–10 are weakly fluorescent (ΦFL of 0.006–0.012) as would be expected from the presence of selenium as a heavy atom (Table 1). However, the nominal fluorescence of 5–10 (Fig. S1, Supporting information) is sufficient to visualize the dyes in cells as described below.
2.4. Singlet oxygen yields
Quantum yields for the generation of 1O2 [Φ(1O2)] by 5–10 were measured by time-resolved spectroscopy at 1270 nm20 of 1O2 phosphorescence in air-saturated methanol using 2 [Φ(1O2) = 0.87]16 as a standard (Fig. S2, Supporting information). Values of Φ(1O2) fall in the range of 0.51–0.95 (Table 1).
2.5. n-Octanol/water partition coefficients
Values of the n-octanol/water partition coefficient (log P) for 5–10 were measured using the ‘shake flask’ method (Table 1).21 Selenorhodamines 5–10 are lipophilic with values of log P in the range 3.4–4.1. Values of log P for amides 6, 8, and 10 are significantly lower (p <0.05, Student’s t-test) than log P for thioamides 5, 7, and 9 in pair-wise comparisons of each thioamide/amide pair. Among the amides, log P for 6 (log P = 3.71) is significantly higher (p ≤0.018) than log P for 8 (log P = 3.51) or 10 (log P = 3.42).
2.6. P-gp transport studies of selenorhodamines 5–10 in monolayers of MDCKII-MDR1 cells
To identify the effects of the selenorhodamines 5–10 on P-gp activity, the transport of these dyes was examined in monolayers of MDCKII-MDR1 cells, which overexpress P-gp.22 Since P-gp is present only at the apical membrane, monolayers of these cells are a good model for determining rates of transport of various molecules across a P-gp-containing membrane. The three thioamide/amide pairs of this study (5/6, 7/8, and 9/10) provide further examples of thioamide inhibition and amide stimulation of ATPase activity in rhodamine derivatives.12,13,18 Transport was measured both in absorptive (PAB) and secretory (PBA) directions of the cell monolayer. The assay was repeated with 5 × 10⁻⁶ M 15 (IC50 = 4 × 10⁻⁷ M, Chart 3), which completely inhibits P-gp. Compound 15 is related to the P-gp-specific inhibitor zosuquidar.23–26 Values of PAB and PBA in the absence of inhibitor, passive transport (PPassive) in the fully inhibited system, and the PBA/PAB ratio are compiled in Table 2. Values of these same parameters previously reported for 3 and 418 are also compiled in Table 2. For all of 5–10, PAB and PPassive were slow at ≤2.1 × 10⁻⁹ m s−1. In comparison, transport in the secretory direction was rapid, and was faster for amides 6 (PBA = 78 × 10−9 m s−1), 8 (PBA = 66 × 10−9 m s−1), and 10 (PBA = 65 × 10−9 m s−1) than for thioamides 5 (PBA = 18 × 10−9 m s−1), 7 (PBA = 8.8 × 10⁻⁹ m s−1), and 9 (PBA = 6.3 × 10⁻⁹ m s−1). This observation is consistent with prior studies of the thioamide/amide switch in rhodamines (including 3 and 4) in which amide analogues stimulate P-gp activity while thioamide derivatives do not.12,13,18
Chart 3.
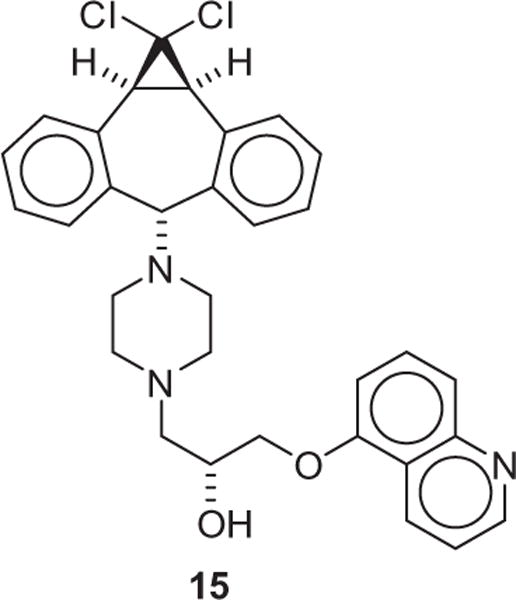
Structure of 15.
Table 2.
Transport studies of selenorhodamines 3–10 with MDCK-MDR1 cellsa
| Compd | PAB, ×10−9 m s−1 | PBA, ×10−9 m s−1 | PBA/PAB | PPassiveb ×10−9 m s−1 |
|---|---|---|---|---|
| 3c | 1.9 ± 0.5 | 29 ± 3 | 15 | |
| (+inh) | 1.7 ± 0.2 | 1.8 ± 0.1 | ~2 | |
| 4c | 0.9 ± 0.3 | 164 ± 4 | 182 | |
| (+inh) | 1.0 ± 0.1 | 11.1 ± 0.2 | ~6 | |
| 5 | 0.3 ± 0.3 | 18 ± 2 | 57 | |
| (+inh) | 0.51 ± 0.3 | 0.57 ± 0.1 | <1 | |
| 6 | 2.1 ± 0.1 | 78 ± 12 | 37 | |
| (+inh) | 0.24 ± 0.1 | 4.8 ± 0.1 | ~2 | |
| 7 | 0.44 ± 0.1 | 8.8 ± 0.3 | 20 | |
| (+inh) | 0.46 ± 0.1 | 0.32 ± 0.2 | <1 | |
| 8 | 1.4 ± 0.8 | 66 ± 10 | 48 | |
| (+inh) | 0.18 ± 0.1 | 2.8 ± 0.2 | ~1 | |
| 9 | 1.5 ± 1.8 | 6.3 ± 1.2 | 4 | |
| (+inh) | 0.51 ± 0.1 | 0.13 ± 0.1 | <1 | |
| 10 | 1.8 ± 1 | 65 ± 6 | 36 | |
| (+inh) | 0.51 ± 0.1 | 4.0 ± 0.7 | ~2 |
Experiments were run with 5 × 10⁻⁶ M dye and 4.3 mg mL−1 BSA. Values of transport in the absorptive (PAB) and secretory (PBA) mode in the absence or presence of inhibitor, the ratio PBA/PAB, the % cell associated rhodamine analogue in the absence or presence of inhibitor, and the ratio of cell associated rhodamine in the presence or absence of inhibitor are reported. Details for methods are provided in Section 5. Error limits represent ± SD.
PPassive represents the mean of PAB and PBA in the fully inhibited system.
Data from Ref. 18.
2.7. Localization of 3–6 in the mitochondria of malignant T cells
Lipophilic cationic photosensitizers are concentrated in the mitochondria of cancer cells due to the increased mitochondrial IM potential27,28 and one might expect the selenorhodamine series of cationic photosensitizers to also localize in the malignant T cells targeted by ECP. To investigate mitochondrial targeting of HUT-78 cells by 3–6, ImageStream multispectral imaging flow cytometry was employed using MitoTracker Green (16, MTG), MitoTracker Red (17, MTR), and LysoTracker (18, LYS) for reference (Chart 4).18,19
Chart 4.
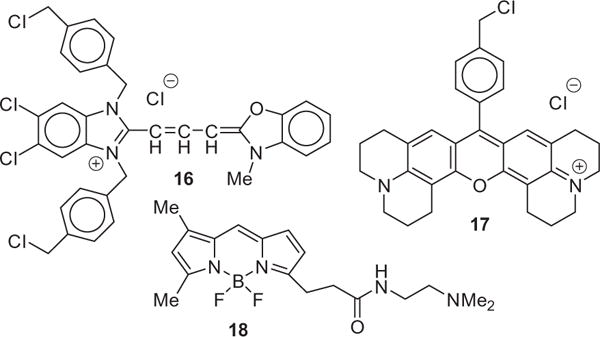
Structures of 16 (MTG), 17 (MTR) and 18 (LYS).
Both 16 and 17 are mitochondrial-specific reporters and 17 is similar in structure to selenorhodamines 5 and 6. A statistical analysis of the similarity of localization of 16 and 17 in HUT-78 cells incubated with both agents gave a mean bright detail similarity score of 3.1 ± 0.7 for 2419 cells, indicating a high degree of colocalization of these two reporters (Fig. 1a).29 In contrast, HUT-78 cells incubated with 17 and the lysosome-specific reporter 18 demonstrated a low bright detail similarity score of 0.6 ± 0.4 for 2592 cells (Fig. 1a), indicating low co-localization of these reporters (18 to the mitochondria, 19 to the lysosomes).
Figure 1.
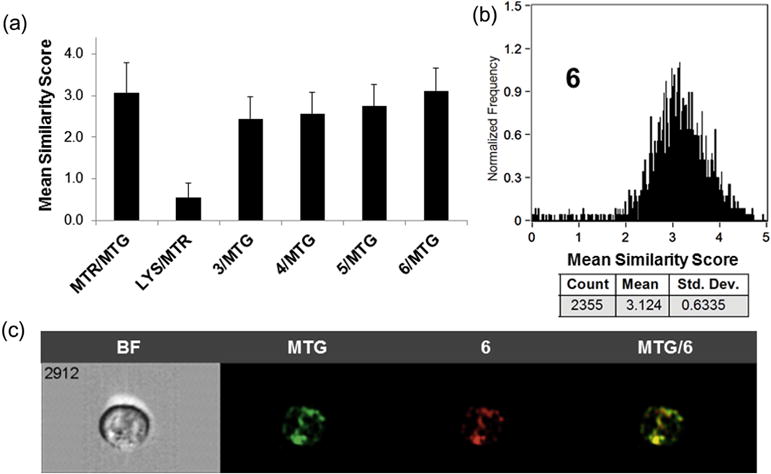
(a) The average similarity coefficient determined by Image Stream flow cytometry of all HUT-78 cells for each pair of agents (MTR, MTG, LYS, 3–6) is shown; error bars represent ± SD. (b) A histogram of the pixel-by-pixel statistical analysis of each HUT-78 cell (n = 2355) analyzed, in which the y-axis is number of cells and the x-axis is the similarity coefficient between MTG and selenorhodamine 6. (c) A representative example of a 6/MTG-stained HUT-78 cell as a bright field image (BF), MTG fluorescence, 6 fluorescence, and a merged image of MTG/6 fluorescence.
HUT-78 cells were incubated for 15 min with a 2 × 10⁻⁷ M of photosensitizers 3–6 and 5 × 10⁻⁷ M 16. High bright detail similarity scores were observed for 3–6 with 16, ranging from 2.4 to 3.1, suggesting a high degree of mitochondrial localization in HUT-78 cells (Fig. 1a). A histogram of localization of 16 and 6 in HUT-78 cells is shown in Figure 1b. Similar histograms of the similarity of localization of MTG and 3–5 are shown in Figure S3 for HUT78 cells (Supporting information). A representative example of a 6/MTG-stained HUT-78 cell as a bright field image (BF), MTG fluorescence, fluorescence from 6, and a merged image of MTG/6 fluorescence is shown in Figure 1c.
2.8. Dark and phototoxicity of 5 and 6 toward malignant T cells
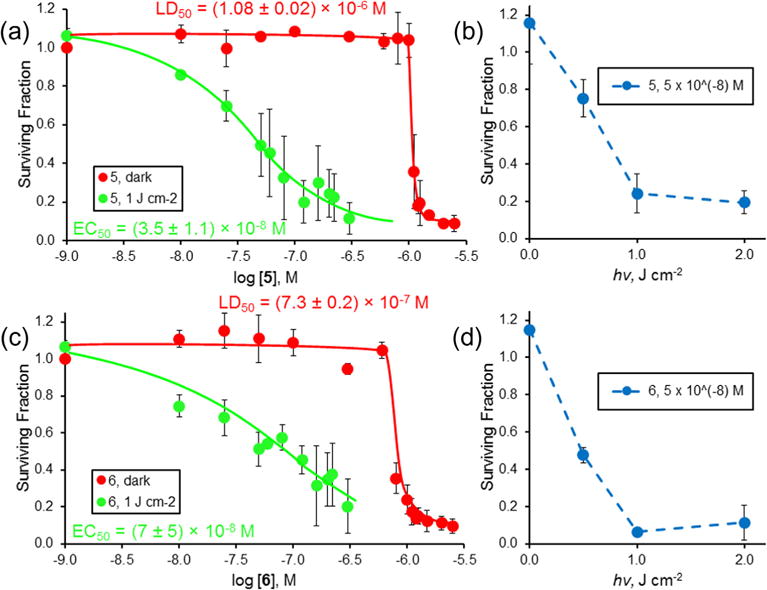
Dark and phototoxicity of the selenorhodamines towards malignant T cells was examined using the amide/thioamide pair 5 and 6 and a tunable dye laser delivering light at 630 ± 2 nm, with a fluence rate of ~3.2 mW cm−2. HUT-78 cells were treated with varying concentrations of 5 or 6 and light and cell survival was determined using the MTT assay (Fig. 2).30 Selenorhodamine 6 was more dark toxic than 5 (Fig. 2) and the difference, though small, was significant (p <0.0001, Student’s t-test). Increasing concentrations of 5 or 6 gave reduced survival with 1.0 J cm−2 of light and reduced survival was also observed with increasing light dose and a constant concentration (5 × 10⁻⁸ M) of 5 or 6.
Figure 2.
Dark (
 ) and phototoxicity (
 ) of selenorhodamine thioamide 5 (a) toward HUT-78 cells with 0.0 and 1.0 J cm−2 of laser light and varying concentrations of 5 and (b) with 5 × 10⁻⁸ M 5 (
 ) and varying light dose (0.0, 0.5, 1.0, and 2.0 J cm−2) delivered at 630 ± 2 nm and a fluence rate of ~3.2 mW cm−2. (c) Dark (
 ) and phototoxicity (
 ) of selenorhodamine amide 6 toward HUT-78 cells with 0.0 and 1.0 J cm−2 of laser light and varying concentrations of 6 and (d) with 5 × 10⁻⁸ M 6 (
 ) and varying light dose (0.0, 0.5, 1.0, and 2.0 J cm−2) delivered at 630 ± 2 nm and a fluence rate of ∼ 3.2 mW cm 2. The surviving fraction was determined by MTT assay. The assays were run in triplicate. Values of EC50 (±SD) and LD50 (±SD) in (a) and (c) were determined by a sigmoidal does–response (variable slope) analysis. Error bars are ± SD.
2.9. P-gp expression in T-cell lymphocytes
P-gp is a protein expressed not only in normal stem cells but also in T-cell lymphocytes.31–34 Earlier studies have also shown that CD8+ cytotoxic T cells possess high levels of P-gp ATPase activity.6 Activated T cells have been shown to have reduced Pgp activity33 and photosensitizers have been shown to be retained preferentially in activated T cells and to be more phototoxic toward them.35 The activity of P-gp in malignant T cells was examined with selenorhodamines 3–6 as described below.
2.10. Uptake of 3–6 in malignant T cells in the presence and absence of verapamil
Verapamil (VER) was one of the first small molecules discovered to inhibit P-gp transport of xenobiotics.36 The difference in relative uptake of selenorhodamines 3–6 (2 × 10⁻⁷ M) by HUT-78 cells in the presence and absence of VER (1 × 10⁻⁴ M) by flow cytometry is shown in Figure 3. The ratios of uptake +VER/−VER are small and numerically (mean ± SD) are 1.27 ± 0.19 for 3, 1.33 ± 0.04 for 4, 1.17 ± 0.13 for 5, and 1.13 ± 0.08 for 6. One-way analysis of variance indicated that there were no significant differences within the data set (F3, 0.025 = 1.6 p = 0.25). The effect of added VER is comparable with all four selenorhodamines including both amides and thioamides.
Figure 3.
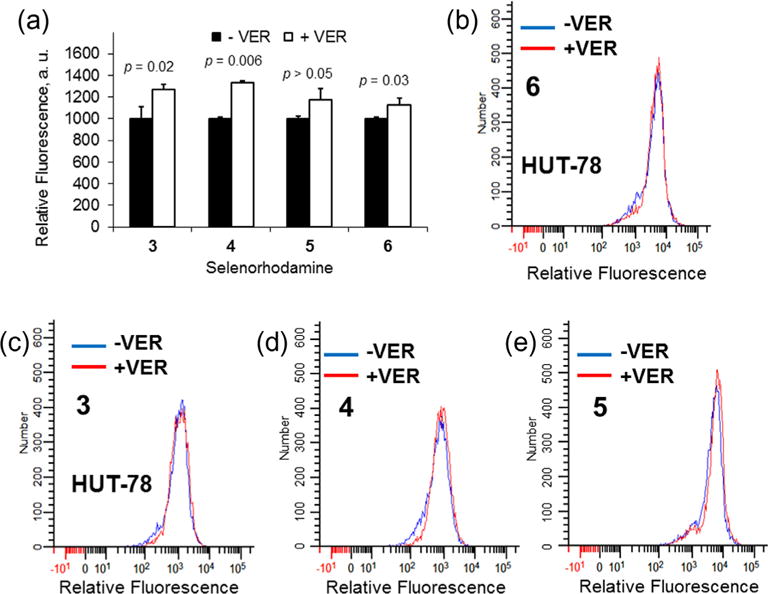
(a) Uptake of 2 × 10⁻⁷ M selenorhodamine 3–6 in HUT-78 cells as measured by relative fluorescence in the absence (black bars) and presence (white bars) of 1 × 10⁻⁴ M VER. The assays were run in triplicate. Error bars represent the SD. Values of p are Student’s t-test significance for comparison of ±VER. Flow cytometry data for HUT-78 cells incubated 1 h with (b) 2 × 10⁻⁷ M 6 with or without 1 × 10⁻⁴ M VER, (c) 2 × 10⁻⁷ M 3 with or without 1 × 10⁻⁴ M VER, (d) 2 × 10⁻⁷ M 4 with or without 1 × 10⁻⁴ M VER, or (e) 2 × 10⁻⁷ M 5 with or without 1 × 10⁻⁴ M VER. The histograms show the shift in fluorescence from selenorhodamine alone (blue) and plus VER (red).
2.11. A model for differentiating resting T cells, pathogenic T cells, and malignant T cells
A model to compare uptake, retention, and phototoxicity of 5–10 in healthy T cells, pathogenic T cells, and malignant T cells was constructed using a mixture of peripheral blood mononuclear cells (PBMCs) and CTCL-derived malignant T cells to simulate ECP. For this model, HUT-78 T cells were first transfected with green fluorescent protein (GFP) to facilitate identification as described in the Section 5. PBMCs and GFP-expressing HUT-78 cells were then mixed and identified by FACS analysis for HUT-78 (malignant T cells), CD3+ (resting T cells), CD4+ (helper T cells), and CD8+ (cytotoxic T cells) T cell subsets (Fig. S4, Supporting information).
Recent work has demonstrated that pathogenic T cells in both autoimmune and alloimmune diseases share a similar bioenergetic profile with cancer cells, and are very dependent on oxidative phosphorylation (OXPHOS) occurring in mitochondria.37 Superantigen-stimulated T cells possess high OXPHOS metabolic activity, representing a bioenergetic profile similar to pathogenic T cells. As described earlier, the stimulated T cells have reduced levels of P-gp activity.33 To stimulate T cells, human PBMCs were cultured with Staphylococcus enterotoxin B (SEB) for 72 h. The SEB-stimulated PBMCs and GFP-expressing HUT-78 cells were mixed and identified by FACS analysis as shown in Figure S4 (Supporting information).
2.12. Uptake and retention of selenorhodamines 5–10 in nonstimulated T cells
A 5:1 mixture of PBMCs and GFP-expressing HUT-78 cells was exposed to selenorhodamines 5–10 and identified by FACS analysis for HUT-78 (malignant T cells), CD3+ (resting T cells), CD4+ (helper T cells), and CD8+ (cytotoxic T cells) T cell subsets (Fig. S4). The mean fluorescence intensity (MFI) from the selenorhodamines for each of these cell types was measured 20 min after selenorhodamine exposure. A second PBMC and HUT-78 cell suspension was similarly treated, but then was washed and suspended for 30 min in selenorhodamine-free media, followed by measurement of the MFI by FACS analysis. The MFI data for uptake and retention for selenorhodamines 5–10 with HUT-78, CD3+ (resting T-cells), CD4+ (helper T-cell subset), and CD8+ cells (cytotoxic T-cell subset) are shown graphically in Figure 4. Values of MFI as the mean of three independent experiments and the accompanying SEM are compiled in Table S1 (Supporting information).
Figure 4.
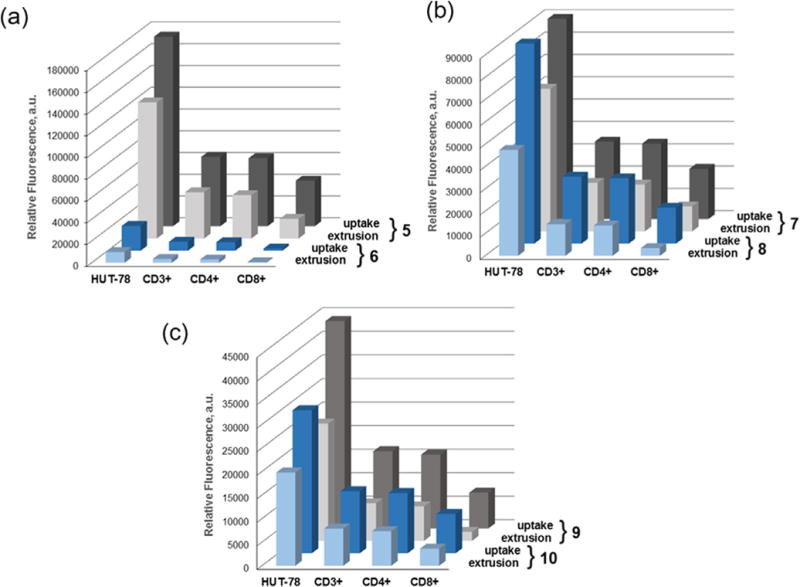
Non-stimulated PBMCs were combined 5:1 with HUT-78 cells and exposed to 7.5 × 10⁻⁸ M selenorhodamine. The bars represent mean fluorescence intensities (MFI) of selenorhodamine following (a) a 20-min uptake of 7.5 × 10⁻⁸ M selenorhodamine (uptake) and (b) a 20-min uptake of 2.5 × 10⁻⁷ M selenorhodamine followed by a 30-min extrusion in selenorhodamine-free media (extrusion) for (a) 5/6, (b) 7/8, and (c) 9/10. Values of the SEM are found in Table S1.
While not an exact comparison, values of MFI can be used to approximate relative concentrations of 5–10 in the different cell types. Values of λmax and ΦFL are comparable for each compound in each of the thioamide/amide pairs 5/6, 7/8, and 9/10 (Table 1). Consequently, values of MFI (Table S1) roughly correspond to the relative concentration of thioamide/amide pair in each cell type as shown in Figure 4. For all the selenorhodamines 5–10, uptake in HUT-78 cells was greater than uptake in CD3+, CD4+, and CD8 + cells and, following extrusion, the remaining concentration of dye was greater in the HUT-78 cells relative to the other cells.
The specific data for selenorhodamine thioamide 5 and amide 6 serve to illustrate. One-way analysis of variance for values of MFI following uptake indicated significant differences within the data sets for 5 and 6 and post-hoc Tukey tests showed that uptake in HUT-78 cells was significantly greater than for all other cells (p <0.05). Following extrusion, one-way analysis of variance for values of MFI again indicated significant differences within the data sets for 5 and 6 . Post-hoc Tukey tests showed that the concentration of 5 or 6 remaining in Hut-78 cells was significantly greater than the concentration of 5 or 6 in all other cell types and that the amount of dye left in the CD8+ cells was significantly less than in all other cells (p <0.01).
One can examine the percent change in MFI (ΔMFI) between the uptake values of MFI and the MFI following a 30-min extrusion in selenorhodamine-free media for HUT-78 and non-stimulated PBMCs as an indication of rates of extrusion. For all thioamide/amide pairs, extrusion was significantly greater for the amide partner than for the thioamide partner for all pair-wise comparisons for not only for the entire CD3+ cell population but also for the CD4+ and CD8+ sub-populations (p ≤0.03) with one exception (Table S2, Supporting information). Values of ΔMFI were not significantly different for the 5/6 thioamide/amide pair with respect to CD8+ cells (p = 0.27).
These data are consistent with our prior observation that CD8+ cytotoxic T cells possess high levels of P-gp ATPase activity at baseline.6 Consequently, the most rapid extrusion kinetics and lowest intracellular photosensitizer retention occurred in the CD8+ T cells for all selenorhodamines 5–10.
2.13. Photodepletion of non-stimulated and malignant T cells with selenorhodamine photosensitizers 5–10
Photodepletion is the phototoxicity of the combination of a particular photosensitizer and light dose toward the group of cells under study. To determine the extent of survival after photodepletion, a 5:1 mixture of PBMCs and GFP-transfected HUT-78 cells was suspended with the selenorhodamine photosensitizer (7.5 × 10⁻⁸ M) for the 20 min uptake and 30 min extrusion periods as described above. The PBMC/HUT-78 cell suspension was then irradiated with 5 J cm−2 of 600-nM light delivered from a 65-Watt equivalent LED. Cell survival was determined by FACS analysis 18 h after light exposure. The results are shown for selenorhodamines 5–10 in Figure 5 and values are listed in Table 3. Following photodepletion, HUT-78 cell survival was ≤6% with selenorhodamine photosensitizers 5–10. For the entire CD3+ set of PBMCs, selenorhodamine photosensitizer 6 gave 62% survival while the remaining photosensitizers 5 and 7–10 gave ≤7% survival (Table 3). Not surprisingly, one-way analysis of variance indicated significant differences within the data set (F5, 1712 = 84 p <0.0001) and a posthoc Tukey test showed that survival was significantly greater with photosensitizer 6 relative to each of the others (p <0.0001). Furthermore, among photosensitizers 5 and 7–10 there were no significant differences in survival of the CD3+ population.
Figure 5.
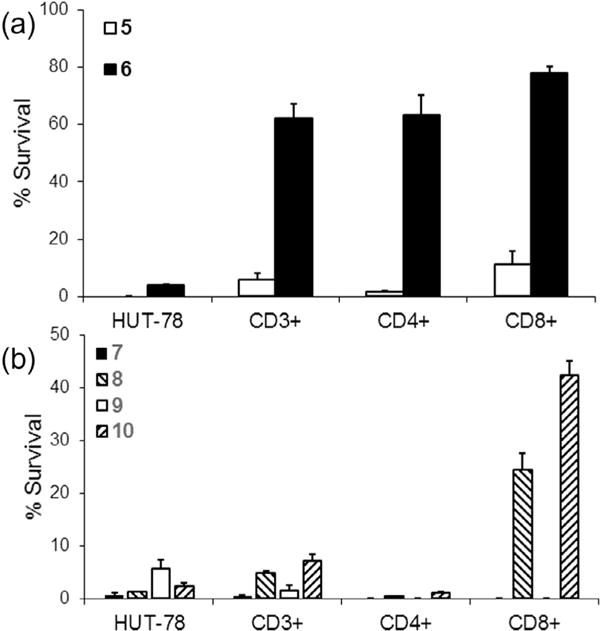
Non-stimulated PBMCs were combined 5:1 with HUT-78 cells. Samples were then photodepleted (PD) with 7.5 × 10⁻⁸ M selenorhodamine 5–10 and 5 J cm−2 light. Cell survival was measured 18 h after light exposure and compared to control (non-PD samples) by FACS analysis. The bar graphs represent percent survival of malignant HUT-78, the CD3+ population, and the CD4+ and CD8+ subsets of CD3+ cells after photodepletion with selenorhodamines (a) 5 and 6 and (b) 7–10. The bars represent the mean of three replicate experiments. Error bars are the SEM.
Table 3.
Survival of HUT-78 cells and non-stimulated PBMCs following photodepletion with 7.5 × 10⁻⁸ M photosensitizer and 5 J of 600-nm LED lighta
| Compd | % survival
|
|||
|---|---|---|---|---|
| HUT-78 | CD3+ | CD4+ | CD8+ | |
| 5 | 0 ± 0 | 5.8 ± 2.3 | 1.5 ± 0.3 | 11.3 ± 4.6 |
| 6 | 3.9 ± 0.5 | 62.1 ± 5.2 | 63.3 ± 7.0 | 78.0 ± 2.5 |
| 7 | 0.7 ± 0.5 | 0.4 ± 0.4 | 0 ± 0 | 0 ± 0 |
| 8 | 1.24 ± 0.05 | 4.8 ± 0.4 | 0.37 ± 0.15 | 24.5 ± 3.1 |
| 9 | 5.6 ± 1.7 | 1.5 ± 1.1 | 0 ± 0 | 0 ± 0 |
| 10 | 2.4 ± 0.6 | 7.2 ± 1.2 | 1.1 ± 0.1 | 42.4 ± 2.7 |
Values are the mean of experiments run in triplicate. Error limits are ± SEM.
With the mixture of non-stimulated PBMCs and HUT-78 cells, selenorhodamine 6 gave 62–78% survival of the CD3+, CD4+, and CD8+ populations and only 3.9% survival of HUT-78 cells (Table 3 and Fig. 5.) When the data were treated using one-way analysis of variance, significant differences were noted within the data set for 6 (F3, 3220 = 52 p <0.0001) and a post-hoc Tukey test showed that survival of CD3+, CD4+, and CD8+ cells was significantly greater than HUT-78 cells (p <0.0001) while there were no significant differences among survival of CD3+, CD4+, and CD8+ cells (p ⩾ 0.69).
2.14. Uptake and retention of selenorhodamines 5–10 in resting, pathogenic, and stimulated T cells
SEB-stimulated PBMCs and HUT-78 cells were mixed and treated with a solution of 7.5 × 10⁻⁸ M photosensitizer under the ‘uptake’ and ‘extrusion’ conditions as described above. Comparison of MFI following uptake and extrusion and associated values of SEM are given in Table S3 (Supporting information). A direct comparison of MFI for each of the thioamide/amide pairs 5/6, 7/8, and 9/10 is shown in Figure 6. What stands out in these data is (1) the reduced MFI for 6 in all cell types relative to the other selenorhodamines 5 and 7–10 and (2) the roughly 8-fold higher concentrations for 6 in HUT-78 cells and the CD3+ (CD25+) cells relative to the resting CD3+ (CD25−) cells following extrusion. These observations would predict greater survival for the resting T-cell population following photodepletion.
Figure 6.
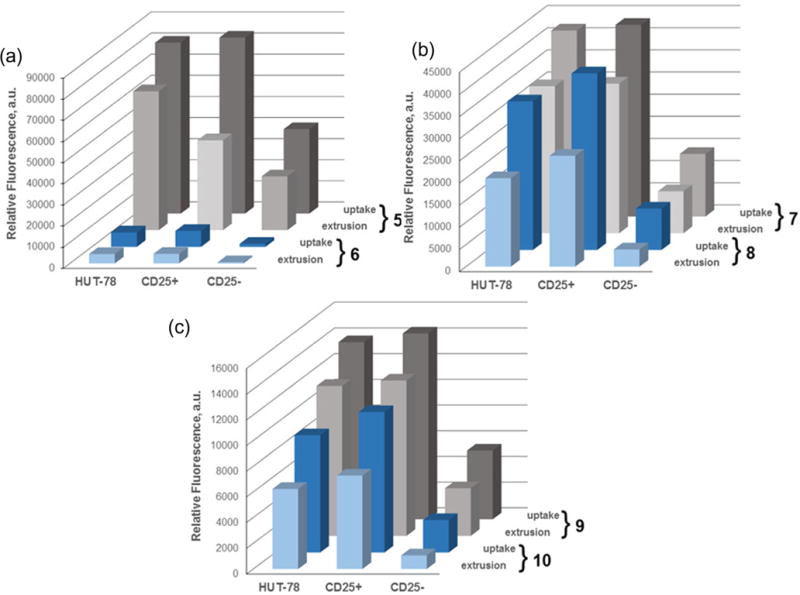
SEB-stimulated PBMCs were combined 5:1 with HUT-78 cells and exposed to 7.5 × 10⁻⁸ M selenorhodamine. The bars represent mean fluorescence intensities (MFI) of selenorhodamine following (a) a 20-min uptake of 7.5 × 10⁻⁸ M selenorhodamine (uptake) and (b) a 20-min uptake of 7.5 × 10⁻⁷ M selenorhodamine followed by a 30-min extrusion in selenorhodamine-free media (extrusion) for (a) 5/6, (b) 7/8, and (c) 9/10. Values of the SEM are found in Table S3.
The rate of extrusion of photosensitizers 5–10 with SEB-stimulated PBMCs were similar to those observed for non-stimulated PBMCs. Values of ΔMFI were noted to be significantly greater for the amide analogues compared to their thioamide partners in malignant, pathogenic, and resting T cells (Table S4, Supporting information). Photosensitizer retention was higher in malignant T cells and pathogenic T cells (CD25+) compared to resting T cells (CD25−) for all selenorhodamines at the end of the uptake and extrusion periods. Values of ΔMFI were also similar between malignant and pathogenic T cells, and significantly lower than values of ΔMFI for resting T cells (p <0.005).
2.15. Photodepletion of resting, pathogenic, and stimulated T cells with selenorhodamine photosensitizers
Photodepletion using selenorhodamines 5–10 as well as selenorhodamines 3 and 4 was performed on SEB-stimulated PBMCs and GFP-expressing HUT-78 cell suspension as described above. Cell survival was determined by FACS analysis 18 h after light exposure. At the selenorhodamine concentration and light dose described above, all of the selenorhodamines 3–10 were phototoxic to >90% of the HUT-78 cells (Fig. 7, Table 4). One-way analysis of variance indicated that there were no significant differences within the data set (F7, 16 = 1.5 p = 0.25) for HUT-78 phototoxicity.
Figure 7.
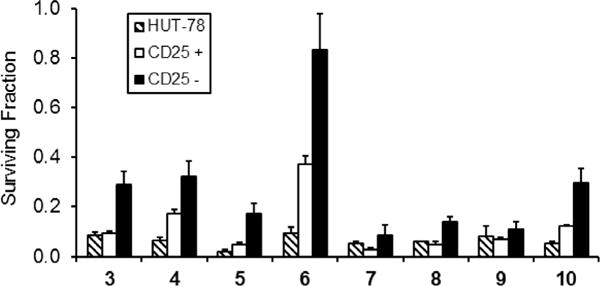
Photodepletion of a 5:1 mixture of SEB-stimulated PBMCs and HUT-78 cells with 7.5 × 10⁻⁸ M selenorhodamine 3–10 and 5 J cm−2 light (600 nM, 65-Watt equivalent LED). Cell survival was measured 18 h after light exposure and compared to control (non-PD samples) by FACS analysis in 3 independent experiments. The bar graphs represent surviving fraction of malignant HUT-78, stimulated (CD25+), and resting (CD25−) T cell populations after photodepletion with photosensitizers 3–10. Mean ± SE are plotted.
Table 4.
Survival of HUT-78 cells and SEB-stimulated PBMCs following photodepletion with 7.5 × 10⁻⁸ M selenorhodamine and 5 J of 600-nm LED lighta
| Compd | % survival
|
|||
|---|---|---|---|---|
| HUT-78 | CD3+ | CD3+ (CD25+) | CD3+ (CD25−) | |
| 3 | 8.5 ± 1.2 | 21.0 ± 3.2 | 9.2 ± 1.0 | 29.1 ± 5.2 |
| 4 | 6.7 ± 1.2 | 26.6 ± 4.6 | 17.4 ± 1.7 | 32.3 ± 6.0 |
| 5 | 2.0 ± 0.9 | 12.1 ± 2.6 | 4.8 ± 1.0 | 17.1 ± 4.3 |
| 6 | 9.3 ± 2.7 | 65.0 ± 8.3 | 37.4 ± 3.2 | 83.4 ± 14.3 |
| 7 | 5.1 ± 0.9 | 5.7 ± 2.6 | 2.6 ± 0.9 | 8.7 ± 4.2 |
| 8 | 6.0 ± 0.2 | 10.3 ± 1.4 | 5.0 ± 0.9 | 13.9 ± 2.3 |
| 9 | 8.1 ± 4.1 | 9.2 ± 2.2 | 7.0 ± 0.7 | 11.1 ± 3.1 |
| 10 | 5.4 ± 0.8 | 22.2 ± 2.9 | 12.5 ± 0.4 | 29.8 ± 5.6 |
Values are the mean of experiments run in triplicate. Error limits are ± SEM.
For the SEB-stimulated PBMCs, photosensitizers 3–10 were phototoxic to >60% of the activated CD3+ (CD25+) cells (Fig. 7, Table 4). However, one-way analysis of variance indicated that there were significant differences within this data set (F7, 383 = 59 p <0.0001). Selenorhodamine amide 6 (37% survival of CD3+ (CD25−) cells) spared more than twice the CD3+ (CD25+) population relative to all of the other photosensitizers, which spared <18% of the CD3+ (CD25+) cells.
The performance of selenorhodamine 6 with the resting CD3+ (CD25−) population was in marked contrast to that of the other selenorhodamines 3–5 and 7–10. Selenorhodamine 6 gave 83% survival of CD3+ (CD25−) cells compared to <30% survival with 3–5 and 7–10 (Fig. 7, Table 4). One-way analysis of variance in this data set indicated significant differences within the data set (F7, 1742 = 13 p <0.0001) for photodepletion of the CD3+ (CD25−) population.
As a photosensitizer, selenorhodamine 6 was phototoxic to 91% of the HUT-78 cells while sparing 37% of the CD3+ (CD25+) cells and 83% of the CD3+ (CD25−) cells. Overall, 65% of the entire CD3+ population (CD25+ and CD25) survived the phototoxicity studies with 6 (Table 4) and this value is significantly greater than the 9% survival of HUT-78 cells (p = 0.003) following photodepletion.
3. Discussion of biological results
ECP is a powerful treatment modality for malignant, autoimmune, and alloimmune T cell-mediated diseases. However, not all patients obtain a significant or durable response from ECP. The design of a selective photosensitizer that spares desirable lymphocytes while targeting malignant T cells may promote cytotoxic T cell responses and improve outcomes after ECP. In this report, the selenorhodamines 5–10 were examined as photosensitizers for HUT-78 malignant T cells targeted by ECP. Photosensitizer 6 emerged as a superior agent in this class by sparing resting PBMCs while being highly phototoxic to HUT-78 malignant T cells.
3.1. Mitochondrial targeting
The ability of the rhodamines to target mitochondria27 leads to greater accumulation of the cationic rhodamines in the mitochondria of cancer cells.28,38 However, ‘traditional’ rhodamines with oxygen in the xanthylium core are not photosensitizers. Bromination of the rhodamine 123 core produces several brominated rhodamine structures with increased quantum yields for singlet oxygen generation.39,40 Furthermore, it is not clear that the brominated rhodamines retain their mitochondrial specificity.40 Replacing the oxygen atom of the xanthylium core with the heavier selenium atom gives selenorhodamines that efficiently produce 1O2 (Table 1). Furthermore, as shown in Figures 1 and S3 (Supporting information), selenorhodamines 5 and 6 with the Texas red core and the related selenorhodamines 3 and 4 clearly target the mitochondria of HUT-78 cells. The structures of 5 and 6 are very similar to that of MTR (18, Chart 4), which is a commercial mitochondrial-specific reporter.
3.2. Modulation of P-gp activity
The selenorhodamines 5–10 also modulate ATPase activity in Pgp. In MDCKII-MDR1 cells, selenorhodamine amides 6, 8, and 10 show faster rates of efflux (PBA of 78, 66, and 65 × 10−9 m s−1, respectively, Table 2) than their corresponding thioamide analogues 5, 7, and 9 (PBA of 18, 8.8, and 6.3 × 10⁻⁹ m s−1, respectively, Table 2). This same trend has been observed in prior studies of thioamide/amide pairs12,13,18 including selenorhodamine thioamide 3 (PBA of 29 × 10−9 m s−1) and selenorhodamine amide 4 (PBA of 164 × 10−9 m s−1).18 The faster rates of efflux suggest that the amide-containing selenorhodamines would maximize rates of extrusion from the P-gp-expressing CD3+ lymphocytes relative to malignant T cells. The data in Figure 4 and Table S1 for resting PBMCs and HUT-78 cells and in Figure 6 and Table S2 for SEB-stimulated PBMCs and HUT-78 cells indicate that the selenorhodamine amides are extruded more rapidly (% change from uptake maximum) than the selenorhodamine thioamides in both PBMCs and HUT-78 cells.
For selenorhodamines 5 and 7–10, values of ΔMFI are not significantly different between malignant and pathogenic T cells in our model (p >0.30). In contrast, the ΔMFI for resting T cells was significantly greater compared to malignant and pathogenic T cells (p <0.001). The faster rates of efflux suggest that the amide-containing selenorhodamines would maximize rates of extrusion from the P-gp-expressing resting CD3+ lymphocytes relative to malignant and pathogenic T cells, and therefore better protect resting T cells from photosensitizer associated toxicities.
For selenorhodamine amide 6, one-way analysis of variance indicated significant differences within the data set (F2, 548 = 101 p <0.0001) for rates of extrusion (ΔMFI) of 6 from malignant and pathogenic T cells and resting T cells. Post-hoc Tukey tests indicated that ΔMFI is significantly greater for pathogenic (CD3+ (CD25+)) T cells relative to HUT-78 cells (p = 0.048) and is significantly greater in resting (CD3+ (CD25−)) T cells relative to either HUT-78 cells or pathogenic T cells (p <0.0001).
Of possible concern was the ability of P-gp (if present) to also protect malignant T cells targeted by ECP. As shown in Figure 2, the addition of the P-gp inhibitor VER36 to inhibit P-gp gives a slight increase in uptake of selenorhodamines 3–6 relative to VER-free conditions in HUT-78 cells. However, the ratios of uptake +VER/−VER for both the amides and thioamides are not significantly different, ranging from 1.13 to 1.33. These ratios can be compared to the ratios of uptake +VER/−VER for 3–6 in P-gpexpressing Colo-26 cells of 1.9 and 5.1 for 3 and 4, respectively,18 and 2.9 and 7.6 for 5 and 6, respectively.19 Additionally, as shown in Figure 3, 5 and 6 are comparably phototoxic to HUT-78 cells over a range of photosensitizer concentrations and light doses. These results indicate that uptake of selenorhodamine photosensitizers in Sezary cells is minimally influenced by P-gp ATPase stimulation, and that P-gp stimulation does not protect malignant T cells against phototoxicity using these agents.
3.3. Role of selenorhodamine lipophilicity
The increased lipophilicity of 5–10 may also impact interactions with P-gp as well as localization in the mitochondria. The Texasred analogues 5 and 6 and the related structures 7–10 have the same numbers of carbons and very similar molecular weights. These selenorhodamines have experimental values of log P of 3.42–4.1 (Table 1) and are significantly more lipophilic than selenorhodamines 3 (log P 1.61) and 4 (log P 2.23).18 Within the 5–10 series, values of log P are significantly lower for amides 6, 8, and 10 in pair-wise comparisons with thioamides 5, 7, and 9. This is opposite of what was observed with 3 and 4 where thioamide 3 had the lower value of log P. Similarly, the added lipophilicity of the thioamides may contribute to their greater uptake and prolonged retention in malignant T cells relative to their amide partners.
It is likely that the generation of 1O2 is the cytotoxic event in the phototoxicity (photodepletion) studies.17 Although solution values of Φ(1O2) may not directly correspond to values of Φ(1O2) while bound to the mitochondria, solution studies of 1O2 generation for selenorhodamines 3–10 indicate that (1) all of the selenorhodamines generate 1O2 efficiently, and that (2) values of Φ(1O2) are larger for the amide partner in the thioamide/amide pairs 3/4, 5/6, 7/8, and 9/10 (Table 1).
However, one question to answer is why 6 behaves effectively and so differently from its thioamide analogue 5 and related selenorhodamines 7–10. Compound 6 appears to have reduced uptake in both PBMCs and HUT-78 cells from a greatly reduced MFI relative to selenorhodamine thioamide 5 for both uptake and extrusion in both malignant and non-malignant T cells whether resting or SEB-stimulated (Figs. 4a and 6a). The other thioamide/amide pairs 7/8 and 9/10 displayed much smaller differences with respect to uptake and extrusion for each pair. The reduced values of MFI for selenorhodamine amide 6 relative to thioamide 5 suggest lower intracellular concentrations of 6.
Values of log P are higher for thioamide 5 relative to thioamides 7 and 9 and higher for amide 6 relative to amides 8 and 10. Recent crystallographic studies of P-gp suggest an inward facing, wider cleft into which xenobiotics may be gathered by P-gp as soon as they penetrate the inner membrane.41 Xenobiotics are then removed with an outward-facing flip of the P-gp scaffold. The added lipophilicity of 6 as well as its ability to stimulate P-gp transport may lead to its reduced concentration in PBMCs. In contrast, the increased lipophilicity of 6 and the increased dependence of malignant T cells on OXPHOS may concentrate amide 6 in the mitochondria of the malignant HUT-78 T cells.37
3.4. The HUT-78/PBMC model
To develop this novel class of photosensitizers, we used a model of healthy, pathogenic, and malignant T cells, to facilitate the efficient evaluation of our photosensitizers. For this model, human PBMCs were stimulated with SEB to produce T cells with a bioenergetic profile similar to pathogenic T cells. After SEB-stimulation, pathogenic T cells were identified by high expression of CD25, the cell surface receptor for the stimulatory cytokine IL-2. However, CD25 is also expressed on non-pathogenic T cells, such as activated or cytotoxic T cells, which were not identified separately using this model. In contrast to pathogenic T cells, cytotoxic T cells possess a different bioenergetic profile from pathogenic T cells, with a lower dependence on OXPHOS over glycolysis.42 Consequently, we expect cytotoxic T cells to be less susceptible to the effects of our selenorhodamine photosensitizers, and therefore to survive photodepletion. Importantly, the antitumor effect induced by ECP is theorized to derive from the non-stimulated T cell population after photodepletion. Photodepletion with 6 highly preserves this nonmalignant, non-stimulated T cell population, and therefore may preserve this potential for antitumor immune responses. Now with the development of a selective photosensitizer, we have the ability to clarify the immune mechanisms induced by ECP, which may better define the successes and limits of this treatment modality, with the ultimate goal of improving clinical outcomes.
4. Conclusions
We present a new photosensitizer with a high potential for selectivity in ECP. Selenorhodamine 6 has a ‘Texas red’ core—two fused julolidine rings containing the nitrogen atoms of the rhodamine chromophore. This core helps target the hyperpolarized mitochondria of malignant T cells. The amide functionality in selenorhodamine 6 stimulates ATPase activity in P-gp and stimulates extrusion of the selenorhodamine photosensitizer from Pgp-expressing lymphocytes. In P-gp overexpressing MDCKIIMDR1 cells, the rate of efflux of 6 from the cell by P-gp (PBA) is faster than the rate of efflux of thioamide 5 or the other related selenorhodamines 7–10. The end result is sparing of resting PBMCs important for normal immune responses while photodepleting malignant T cells using selenorhodamine 6 as a photosensitizer.
While selenorhodamine 6 is a promising potential photosensitizer for ECP, there is room to improve photosensitizer performance. Increased selectivity towards malignant T cells based on lipophilicity or P-gp stimulatory ability, could further increase selectivity and lead to improved immune responses following ECP. As a lead compound, 6 can be modified through the 9-position with a variety of different amide/thioamide groups attached to aryl and heteroaryl rings to stimulate P-gp further, while substitutions within the julolidyl rings can modify lipophilicity. Such modifications may provide next-generation photosensitizers with even greater selectivity.
5. Experimental
5.1. General methods
Selenorhodamines 3–618,19 and selenoxanthones 11 and 1220 were prepared by literature methods. Fluorescence quantum yields (ΦFL)16 and quantum yields for the generation of singlet oxygen [Φ (1O2)]20 were measured as previously described. Tetrahydrofuran was distilled from sodium benzophenone ketyl. Reactions were run under Ar. Concentration in vacuo was performed on a Büchi rotary evaporator. NMR spectra were recorded on an Inova 500 instrument (500 MHz for 1H, 125 MHz for 13C) or 300 MHz Mercury spectrometer (75.5 MHz for 13C) with residual solvent signal as internal standard. Infrared spectra were recorded on a PerkinElmer FTIR instrument. UV–vis near-IR spectra were recorded on a Perkin-Elmer Lambda 12 spectrophotometer or a Shimadzu UV3600 spectrophotometer in quartz cuvettes with a 1-cm path length. Melting points were determined on Büchi capillary melting point apparatus and are uncorrected. All compounds tested have a purity of at least 95%, which was determined by elemental analyses for C, H, and N (Atlantic Microlab, Inc., Norcross, GA). Experimental values of C, H, and N are within 0.4% of theoretical values.
5.1.1. Preparation of selenorhodamine 7
n-Butyllithium (1.33 M in hexanes, 1.30 mL, 1.70 mmol) was added dropwise to a stirred solution of N,N-diisopropylamine (268 μL, 1.90 mmol) in THF (20 mL) at −78 °C. The resulting mixture was stirred for 10 min before it was transferred to a stirred solution of piperdin-1-yl(thiophen-2-yl)methanethione (374 mg, 1.77 mmol) in THF (10 mL) at −78 °C. The resulting solution was stirred at −78 °C for 2 min before it was transferred via cannula to a stirred solution of selenoxanthone 11 (200 mg, 0.43 mmol) in THF (25 mL) at room temperature. The resulting solution was heated to 45 °C for 0.5 h and then cooled to ambient temperature. Glacial acetic acid (2 mL) was added and the resulting mixture was poured into 10% aqueous HPF6 at 0 °C. The resulting mixture was stirred 12 h and the precipitate was collected via filtration and then washed with water (50 mL) and diethyl ether (100 mL). The product was purified via column chromatography (SiO2, 6% MeOH/CH2Cl2, Rf = 0.4), followed by recrystallization from ether/CH2Cl2 to yield 278 mg (79%) of 5 as the PF6 salt as a purple solid, mp 149–151 °C. The hexafluorophosphate salt (50 mg, 0.06 mmol) was dissolved in CH2Cl2 (10 mL) and Amberlite IRA-400 chloride ion exchange resin (3.0 g) was added. The resulting mixture was stirred at ambient temperature for 24 h. The Amberlite exchange resin was removed via filtration, and the filtrate was concentrated under reduced pressure. This process was repeated a total of 3 times in order to achieve complete ion exchange: 1H NMR (500 MHz, CDCl3) δ 7.42 (s, 1H, C(4)-H or C(5)-H of xanthylium core), 7.40 (s, 1H, C(4)-H or C(5)-H of xanthylium core), 7.24 (d, 1H, J = 3.5 Hz, thiophene = CH-), 7.16 (s, 1H, C(8)-H of xanthylium core), 7.03 (d, 1H, J = 3.5 Hz, thiophene = CH-), 4.31 (br s, 2H), 4.05 (br s, 2H), 3.60–3.50 (m, 6H), 3.25 (s, 3H), 2.81–2.69 (m, 4H), 2.24–2.13 (m, 2H), 2.06–1.96 (m, 2H), 1.92–1.68 (m, 9H); 13C NMR (75.5 MHz, CDCl3) δ 188.1, 149.1, 149.0, 148.4, 147.4, 142.1, 141.1, 140.4, 134.2, 134.0, 130.7, 129.4, 125.0, 124.9, 119.7, 119.4, 116.3, 107.4, 53.6 (br), 52.3 (br), 51.2, 50.3, 48.0, 39.5, 34.2, 31.7, 29.4, 28.4, 27.5, 25.6, 23.9, 20.1, 19.8; λmax (MeOH) 620 nm (ε = 9.20 × 10⁴ M−1 cm−1); IR (film on NaCl) 2936, 1591, 1442, 1309 cm−1; HRMS (ESI, HRDFMagSec) m/z 646.1831 (calcd for ). Anal. of hexafluorophosphate salt. Calcd for C35H40N3S2Se PF6: C, 53.16; H, 5.10; N, 5.31. Found: C, 52.91; H, 5.18: N, 5.23. Anal. of chloride salt. Calcd for C35H40N3S2Se·Cl: C, 61.71; H, 5.92; N, 6.17. Found: C, 61.35; H, 6.28: N, 5.87.
5.1.2. Preparation of selenorhodamine 9
n-Butyllithium (1.34 M in hexanes, 1.28 mL, 1.72 mmol), N,N-diisopropylamine (267 μL, 1.89 mmol), piperdin-1-yl(thiophen-2yl)methanethione (372 mg, 1.76 mmol), and selenoxanthone 12 (200 mg, 0.440 mmol) in THF (10 mL and 30 mL) were treated as described for the preparation of 7. The product was purified via recrystallization from MeOH, yielding 305 mg (87%) of 9 as the PF6 salt as a purple solid, mp 154–156 °C. The PF6 salt (50 mg, 0.06 mmol) was converted to the chloride salt as described for 7: 1H NMR (500 MHz, CD2Cl2) δ 7.60 (s, 2H, C(4)-H and C(5)-H of xanthylium core), 7.21 (d, 1H, J = 3.5 Hz, thiophene = CH-), 7.17 (s, 2H, C(1)-H and C(8)-H of xanthylium core), 7.06 (d, 1H, J = 3.5 Hz, thiophene = CH-), 4.30 (br s, 2H), 3.98 (br s, 2H), 3.58 (t, 4H, J = 6.0 Hz), 3.24 (s, 6H), 1.87–1.72 (m, 10 H), 1.17 (s, 12H); 13C NMR (75.5 MHz, CD2Cl2) δ 188.7, 151.0, 150.2, 148.5, 143.8, 140.0, 134.9, 131.9, 129.8, 124.9, 120.6, 108.1, 52.3 (br), 48.7, 40.1, 34.6, 32.1, 28.6, 27.1 (br), 26.0 (br), 24.4; λmax (MeOH) 614 nm (ε = 9.42 × 10⁴ M−1 cm−1); IR (film on NaCl) 2932, 1591, 1474, 1446, 1399, 1320 cm−1; HRMS (ESI, HRDFMagSec) m/z 648.1985 (calcd for ). Anal. of hexafluorophosphate salt. Calcd for C35H42N3S2Se·PF6: C, 53.03; H, 5.34; N, 5.30. Found: C, 52.83; H, 5.41: N, 5.21. Anal. of chloride salt. Calcd for C35H42N3-S2Se·Cl: C, 61.53; H, 6.20; N, 6.15. Found: C, 61.48; H, 6.53: N, 6.16.
5.1.3. Preparation of selenorhodamine 8
Trifluoroacetic anhydride (140 μL, 1.01 mmol) was slowly added to a stirred solution of 7 (200 mg, 0.253 mmol) in CH2Cl2 (20 mL). The resulting solution was heated at reflux for 5 h, and was then cooled to ambient temperature. A solution of 10% aqueous Na2CO3 (25 mL) was added, and the mixture was extracted with CH2Cl2 (3 × 25 mL). The combined organic fractions were collected and concentrated under reduced pressure. The crude product was purified via column chromatography (SiO2, 2:8 Et2O/CH2Cl2, Rf = 0.5), yielding 107 mg (54.6%) of 8 as the PF6 salt as a purple solid, mp 169–171 °C. The hexafluorophosphate salt (50 mg, 0.06 mmol) was converted to the chloride salt as described for 7: 1H NMR (500 MHz, CD2Cl2) δ 7.41 (d, 1H, J = 4.0 Hz, thiophene = CH-), 7.40 (s, 1H, C(4)-H or C(5)-H of xanthylium core), 7.39 (s, 1H, C(4)-H or C(5)-H of xanthylium core), 7.17 (s, 1H, C(8)-H of xanthylium core), 7.10 (d, 1H, J = 4.0 Hz, thiophene = CH-), 3.73 (t, 4H, J = 5.0 Hz), 3.56 (t, 2H, J = 6.0 Hz), 3.54–3.47 (m, 4H), 3.22 (s, 3H), 2.80–2.71 (m, 4H), 2.18 (quintet, 2H, J = 6.0 Hz), 1.99 (quintet, 2H, J = 6.0 Hz), 1.80–1.72 (m, 4H), 1.71–1.64 (m, 4H), 1.13 (s, 6H); 13C NMR (75.5 MHz, CDCl3) δ 162.2, 149.3, 149.2, 148.6, 142.3, 141.2, 140.1, 139.9, 134.2, 134.1, 130.8, 129.7, 128.1, 125.0, 120.0, 119.6, 116.4, 107.5, 51.3, 50.4, 48.1, 46.5 (br), 39.7, 34.3, 31.7, 28.5, 27.6, 26.0 (br), 25.7, 24.3, 20.2, 19.9; λmax in (MeOH) 620 nm (ε = 1.10 × 10⁵ M−1 cm−1); IR (film on NaCl) 2935, 1591, 1540, 1451 cm−1; HRMS (EI, HRDFMagSec) m/z 630.2080 (calcd for). Anal. of hexafluorophosphate salt. Calcd for C35H40N3OSSe·PF6: C, 54.26; H, 5.20; N, 5.42. Found: C, 54.09; H, 5.30: N, 5.32. Anal. of chloride salt. Calcd for C35H40N3OSSe Cl: C, 63.20; H, 6.06; N, 6.32. Found: C, 62.89; H, 6.65: N, 5.98.
5.1.4. Preparation of selenorhodamine 10
Trifluoroacetic anhydride (123 μL, 0.884 mmol, 4.0 equiv) and 9 (175 mg, 0.221 mmol, 1.0 equiv) in CH2Cl2 (25 mL) were treated as described for the preparation of 8. The crude product was purified via column chromatography (SiO2, 2:8 Et2O/CH2Cl2, Rf = 0.5), yielding 111 mg (64.5%) of the desired product 10 as the PF6 salt as a purple solid, mp 157–159 °C. The PF6 salt (50 mg, 0.06 mmol) was converted to the chloride salt as described for 7: 1H NMR (500 MHz, CD2Cl2) δ 7.54 (s, 2H, C(4)-H and C(5)-H of xanthylium core), 7.44 (d, 1H, J = 4.0 Hz, thiophene = CH-), 7.17 (s, 2H, C(1)-H and C(8)-H of xanthylium core), 7.14 (d, 1H, J = 4.0 Hz, thiophene = CH-), 3.72 (t, 4H, J = 5.5 Hz), 3.57 (t, 4H, J = 6.0 Hz), 3.24 (s, 6H), 1.81–1.72 (m, 6H), 1.71–1.64 (m, 4H), 1.15 (s, 12H); 13C NMR (75.5 MHz, CDCl3) δ 162.1, 150.2, 149.7, 143.7, 140.2, 139.7, 134.6, 131.2, 129.6, 128.2, 120.2, 107.8, 48.3, 45.0 (br), 39.9, 34.3, 31.8, 28.5, 26.0 (br), 24.4; λmax in (MeOH) 614 nm (ε = 1.05 × 10⁵ M−1 cm−1); IR (film on NaCl) 2922, 1591, 1474, 1447 cm−1; HRMS (ESI, HRDFMagSec) m/z 632.2207 (calcd for ). Anal. of hexafluorophosphate salt. Calcd for C35H42N3OSSe·PF6: C, 54.12; H, 5.45; N, 5.41. Found: C, 53.89; H, 5.49: N, 5.36. Anal. of chloride salt. Calcd for C35H42N3OSSe Cl: C, 63.01; H, 6.35; N, 6.30. Found: C, 63.07; H, 6.11: N, 6.03.
5.2. Determination of n-octanol/water partition coefficients
The octanol/water partition coefficients were all measured at pH 7.4 (PBS) using UV–visible spectrophotometry. The measurements were done using a shake flask direct measurement.21 Mixing for 3–5 min was followed by 1 h of settling time. Equilibration and measurements were made at 23 °C. Measurements were performed in triplicate. High-performance liquid chromatography grade 1-octanol was used.
5.3. P-gp-transport studies across MDCKII-MDR1 monolayers
These procedures have been described previously in detail.22 Briefly, MDCK cells transfected with wild-type MDR1 (ABCB1) were obtained from Dr. Piet Borst at The Netherlands Cancer Institute and were maintained in Dulbecco’s Modified Eagle’s Medium (Gibco) supplemented with 10% fetal bovine serum (FBS), 100 units/ml penicillin and 100 μg/ml streptomycin. Cultures were used at passage number 16–42. MDCKII-MDR1 cells that were seeded at 50,000 cells cm−2 onto 12-well (1.13 cm2 surface area) Transwell polycarbonate filters (Costar) were fed on days 3 and 5, and used on day 6. The upper and lower chamber volumes were 0.5 mL and 1.0 mL, respectively. Cells were rinsed 10 min in phosphate-buffered saline containing 10−2 M Hepes buffer at pH 7.4 (DPBSH) (Gibco) at 37 °C with mixing on a nutator (Clay Adams). Cells were pre-incubated with 4.3 mg mL−1 bovine serum albumin (BSA) in DPBSH alone or containing 5 × 10⁻⁶ M 15. After 30 min, 5 μM test compound (5–10) in BSA/DPBSH with or without inhibitor was added to the donor chamber (0.5 mL upper or apical, 1.0 mL lower or basolateral). Initial donor samples were taken at t = 0. For apical-to-basolateral (AB) flux, D0 was taken from the mixing tube before addition to the cell monolayer. For basolateral-to-apical (BA) flux this sample was taken from the 12-well plate 10 min after transfer, but before cell wells were added. Samples were taken from both the donor and receiver chambers following a 1-h incubation at 37 °C with constant mixing by nutation. Cell monolayers were rinsed two times using cold DPBS and extracted with 5 × 10⁻⁴ L MeOH for 3 min. Samples (5 × 10⁻⁵ L) were combined into n = 3 cassettes in a 96-deep well assay plate and protein was precipitated by adding 4.5 × 10⁻⁴ L acetonitrile, shaken to mix. Plates were centrifuged 5 min at 5000 rpm. Compound concentrations were determined with an LC–MS/MS assay.22
5.4. Isolation and stimulation of human peripheral blood mononuclear cells (PBMCs)
PBMCs were obtained from healthy volunteers on a Wake Forest Baptist institutional review board-approved protocol (CCCWFU 29A13). To examine the effects of our photosensitizers on human T cells, peripheral blood mononuclear cells (PBMCs) were separated using Ficoll-Hypaque density gradient centrifugation (Organon Teknika, Durham, NC), and rested in RPMI supplemented with 10% heat-inactivated fetal calf serum. To produce stimulated T cells, human PBMCs were cultured in RPMI 1640 (LifeTechnologies, Gaithersburg, MD) with 50 ng/mL Staphylococcus enterotoxin B (SEB, Toxin Technology, Inc., Sarasota, FL) for 72 h.
5.5. Photosensitizer retention and extrusion studies
For experiments comparing the retention of the different photosensitizers, SEB-stimulated human PBMCs were stained with mAb to CD3 and CD25 and then washed. SEB-stimulated PBMCs and HUT-78 cells (ATCC, Manassas, VA) were mixed in a 5:1 ratio and suspended at a concentration of 2 × 10⁶ cells/mL in PBS containing 7.5 × 10⁻⁸ M of selenorhodamine for a 20 min uptake period. Cells were then washed and suspended in photosensitizer-free media for a 30 min extrusion period (RPMI supplemented with 10% heat-inactivated FCS). Data were acquired on a BD FACS Canto II flow cytometer, and analyzed using FlowJo software.
5.6. Phototoxicity and dark toxicity studies with HUT-78 cells
HUT-78 cells (ATCC, Manassas, VA) were grown in RPMI 1640, 1X with L-glutamine medium. The medium was supplemented with 10% FBS, 1% HEPES buffer, and 1% penicillin–streptomycin. Cells were harvested, plated 7.5 × 10⁴ to a well in a 96-well plate (0.32 cm2 on a flat bottom plate), and incubated for 24 h. Selenorhodamines 3–6 were added from stock solutions of known concentration (Add 10 μL of a 10 concentration of the appropriate dye solutions to the 96 well plate (Final concentrations: 5 × 10⁻⁸ M to 5 × 10⁻⁷ M)). All plates were incubated 1 h in the dark after dye addition then either kept in the dark or irradiated with a tunable dye laser at λmax (633 ± 2 nm) at a fluence rate of ~3.2 mW cm−2 to light doses of 0.5, 1.0, or 2.0 J cm−2. Plates were centrifuged for 3 min at 1500 rpm at 25 °C. Old medium was removed and 200 μL of new medium was added to each well before they were placed in the incubator (37 °C, 5% CO2). After a 48-h incubation, an MTT assay30 was performed on the plates to determine cell viability. The absorbance of each well was read on an EL800 BioTek plate reader at 570 nm to give fraction cell viability after data deconvolution.
5.7. Transfection of HUT-78 cell line
HUT-78 cells (ATCC, Manassas, VA) were grown in RPMI 1640, 1X with L-glutamine medium. HUT-78 cells were then transfected with pmax GFP™ plasmids using respective Amaxa Nucleofection kits and Nucleofection program V-001 with Nucleofector II device. High green fluorescent protein (GFP) expressing HUT-78 cells were then isolated by BD FACS Aria cell sorter (>98% purity) and used in photodepletion experiments.
5.8. Photodepletion studies
For selectivity in photodepletion experiments, SEB-stimulated or non-stimulated human PBMCs and were combined with GFPexpressing HUT-78 malignant T cells at a 5:1 ratio, and then suspended in media containing 7.5 × 10⁻⁸ M photosensitizer for 20 min (uptake period) followed by 30 min in a photosensitizerfree media (extrusion period). Cells were then exposed to 5 J cm−2 of light (600 nM, 65-Watt equivalent LED) and 180 rotations per minute. FACS analysis of cell survival was performed 18 h after light exposure.
5.9. Flow cytometry studies with HUT-78 Cells
Flow cytometry was run on an LSR II A UV-Normal Flow instrument with an excitation wavelength of 561 nm (50 mW cm−2) and an emission detection wavelength of 710 nm (50 PE-Cy 5.5). HUT78 cells were harvested and samples were prepared using 5 × 10⁵ cells in 0.5 mL medium. Each photosensitizer was run at a concentration of 2 × 10⁻⁷ M with and without 1 × 10⁻⁴ M VER. Samples were incubated for 1 h, placed on ice, and analyzed Image Stream flow cytometry was run on an Image Stream Mark II instrument using channels 2 (480–560 nm detection) and 5 (642–745 nm detection) with MTG excitation at 488 nm and excitation of 3–6 at 561 nm. Samples were made using 5 × 10⁵ HUT-78 cells in 0.5 mL medium. Each photosensitizer was run at a concentration of 2 × 10⁻⁷ M with and without 5 × 10⁻⁷ M MTG. Cells were also run with 5 × 10⁻⁷ M MTG alone (5 × 10⁻⁷ L of 1 × 10⁻³ M MTG stock in DMSO), All samples were incubated 15 min, centrifuged, and the medium was removed. Samples were re-suspended in Hanks PBS (60 μL), placed on ice, and analyzed. Co-localization was determined in each individual cell using the IDEAS similarity feature, which is a log-transformed Pearson’s correlation coefficient of the intensities of the spatially correlated pixels within the whole cell, of the MTG and 3–6 images, MTG and MTR images, or LYS and MTR images, respectively. The similarity score is a measure of the degree to which two images are linearly correlated.
5.10. Reagents for FACS analysis
The following monoclonal antibodies were used and purchased from eBioscience: mouse anti-human α-CD3-Cyanin-7-allophycocyanin (APC-Cy7; clone OKT3); α-CD4-Pacific Blue (PB; clone RPA-T4); α-CD8-fluorescein isothiocyanate (FITC; clone SK1); and α-CD25-Cyanin-7-phycoerytherin (PE-Cy7; clone BC96). Apoptosis was assessed by FACS analysis of annexin V and 7AAD-stained cells (BD Pharmingen) as previously described.42 Data acquisition was performed on BD FACS Canto II flow cytometer, and analyzed using FlowJo software.
5.11. Data analysis and statistics
For biological assays, statistical significance was assessed using one-way ANOVA and a post-hoc multiple pairwise comparison using the Tukey test with a significance level of 0.05. The Student’s t-test was used for pair-wise comparisons of independent samples. All t-tests were 2 sided, and p-values less than 0.05 were considered significant.
Supplementary Material
Acknowledgments
We thank Dr. Piet Borst at The Netherlands Cancer Institute for supplying the MDCKII-MDR1 cells. This research was supported in part by NIAID grant RO3-AI109224 to J.M.G., in part by in part by the Eagle Memorial Leukemia Research Foundation and the Comprehensive Cancer Center of Wake Forest University grant NCI CCSG P30CA012197 to Z.A.M. M.R.D. thanks the Wake Forest Medical Center for a contract in partial support of this work. The authors also thank Dr. Tymish Ohulchanskyy, Department of Chemistry, University at Buffalo, for his assistance in measuring quantum yields for fluorescence and quantum yields for the generation of singlet oxygen. The authors also thank Kenneth Keymel, Brian Wrazen, and Larry Tworek for laser use and assistance at Roswell Park Cancer Institute.
Footnotes
Supplementary data
Supplementary data associated with this article can be found, in the online version, at http://dx.doi.org/10.1016/j.bmc.2016.05.071.
References and notes
- 1.Worel N, Leitner G. Transfus Med Hemother. 2012;39:254. doi: 10.1159/000341811. [DOI] [PMC free article] [PubMed] [Google Scholar]
- 2.Quaglino P, Knobler R, Fierro MT, Savoia P, Marra E, Fava P, Bernengo MG. Int J Dermatol. 2013 doi: 10.1111/ijd.12121. [DOI] [PubMed] [Google Scholar]
- 3.Girardi M, Berger CL, Wilson LD, Christensen IR, Thompson KR, Glusac EJ, Edelson RL. Leuk Lymphoma. 2006;47:1495. doi: 10.1080/10428190600581419. [DOI] [PubMed] [Google Scholar]
- 4.Evans AV, Wood BP, Scarisbrick JJ, Fraser-Andrews EA, Chinn S, Dean A, Watkin P, Whittaker SJ, Russell-Jones R. Blood. 2001;98:1298. doi: 10.1182/blood.v98.5.1298. [DOI] [PubMed] [Google Scholar]
- 5.Holtick U, Wang XN, Marshall SR, Scheid C, von Bergwelt-Baildon M, Dickinson AM. Curr Stem Cell Res Ther. 2013;8:324. doi: 10.2174/1574888x11308040008. [DOI] [PubMed] [Google Scholar]
- 6.McIver ZA, Melenhorst JJ, Grim A, Naguib N, Weber G, Fellowes V, Stroncek D, Leitman S, Battiwalla M, Barett AJ. J Biol Blood Marrow Transplant. 2011;17:1846. doi: 10.1016/j.bbmt.2011.05.017. [DOI] [PMC free article] [PubMed] [Google Scholar]
- 7.Brasseur N, Menard I, Forget A, El Jastimi R, Hamel R, Molfino NA, van Lier JE. Photochem Photobiol. 2000;72:780. doi: 10.1562/0031-8655(2000)072<0780:eommab>2.0.co;2. [DOI] [PubMed] [Google Scholar]
- 8.Mielke S, Nunes R, Rezvani K, Fellowes VS, Venne A, Solomon SR, Fan Y, Gostick E, Price DA, Scotto C, Read EJ, Barrett AJ. Blood. 2008;111:4392. doi: 10.1182/blood-2007-08-104471. [DOI] [PMC free article] [PubMed] [Google Scholar]
- 9.Mielke S, McIver ZA, Shenoy A, Fellowes V, Khuu H, Stroncek DF, Leitman SF, Childs R, Battiwalla M, Koklanaris E, Haggerty J, Savani BN, Rezvani K, Barrett AJ. Biol Blood Marrow Transplant. 2011;17:1855. doi: 10.1016/j.bbmt.2011.05.019. [DOI] [PMC free article] [PubMed] [Google Scholar]
- 10.Tombline G, Holt JJ, Gannon MK, II, Donnelly DJ, Wetzel B, Sawada GA, Raub TJ, Detty MR. Biochemistry. 2008;47:3294. doi: 10.1021/bi7021393. [DOI] [PubMed] [Google Scholar]
- 11.Tombline G, Donnelly DJ, Holt JJ, You Y, Ye M, Gannon MK, Nygren CL, Detty MR. Biochemistry. 2006;45:8034. doi: 10.1021/bi0603470. [DOI] [PubMed] [Google Scholar]
- 12.Gannon MK, II, Holt JJ, Bennett SM, Wetzel BR, Loo TW, Bartlett MC, Clarke DM, Sawada GA, Higgins JW, Tombline G, Raub TJ, Detty MR. J Med Chem. 2009;52:3328. doi: 10.1021/jm900253g. [DOI] [PMC free article] [PubMed] [Google Scholar]
- 13.Orchard A, Schamerhorn GA, Calitree BD, Sawada GA, Loo TW, Bartlett MC, Clarke DM, Detty MR. Bioorg Med Chem. 2012;20:4290. doi: 10.1016/j.bmc.2012.05.075. [DOI] [PMC free article] [PubMed] [Google Scholar]
- 14.Detty MR, Prasad PN, Donnelly DJ, Ohulchanskyy T, Gibson SL, Hilf R. Bioorg Med Chem. 2004;12:2537. doi: 10.1016/j.bmc.2004.03.029. [DOI] [PubMed] [Google Scholar]
- 15.Holt JJ, Gannon MK, Tombline G, McCarty TA, Page PM, Bright FV, Detty MR. Bioorg Med Chem. 2006;14:8635. doi: 10.1016/j.bmc.2006.08.023. [DOI] [PubMed] [Google Scholar]
- 16.Ohulchanskyy T, Donnelly DJ, Detty MR, Prasad PN. J Phys Chem B. 2004;108:8668. [Google Scholar]
- 17.Detty MR, Gibson SL, Wagner SJ. J Med Chem. 2004;47:3897. doi: 10.1021/jm040074b. [DOI] [PubMed] [Google Scholar]
- 18.Hill JE, Linder MK, Davies KS, Sawada GA, Morgan J, Ohulchanskyy TY, Detty MR. J Med Chem. 2014;57:8622. doi: 10.1021/jm501259v. [DOI] [PMC free article] [PubMed] [Google Scholar]
- 19.Kryman MW, Davies KS, Linder MK, Ohulchanskyy TY, Detty MR. Bioorg Med Chem. 2015;23:4501. doi: 10.1016/j.bmc.2015.06.006. [DOI] [PubMed] [Google Scholar]
- 20.Kryman MW, Schamerhorn GA, Hill JE, Calitree BD, Davies KS, Linder MK, Ohulchanskyy TY, Detty MR. Organometallics. 2014;33:2628. doi: 10.1021/om500346j. [DOI] [PMC free article] [PubMed] [Google Scholar]
- 21.Sangster J. In: Octanol-Water Partition Coefficients: Fundamentals and Physical Chemistry; Wiley Series in Solution Chemistry. Fogg PGT, editor. John Wiley and Sons; New York: 1997. Partition Coefficients: [Google Scholar]
- 22.Sawada GA, Barsuhn CL, Lutzke BS, Houghton ME, Padbury GE, Ho NFH, Raub TJ. J Pharm Exp Ther. 1999;288:1317. [PubMed] [Google Scholar]
- 23.Raub TJ. Mol Pharm. 2006;3:3. doi: 10.1021/mp0500871. [DOI] [PubMed] [Google Scholar]
- 24.Dantzig AH, Shepard RL, Law KL, Tabas L, Pratt S, Gillespie JS, Binkley SN, Kuhfeld MT, Starling JJ, Wrighton SA. JPET. 1999;290:854. [PubMed] [Google Scholar]
- 25.Spoelstra EC, Dekker H, Schuurhuis GJ, Broxterman HJ, Lankelma J. Biochem Pharmacol. 1991;41:349. doi: 10.1016/0006-2952(91)90531-9. [DOI] [PubMed] [Google Scholar]
- 26.Evers R, Kool M, Smith AJ, van Deemter L, de Haas M, Borst P. Br J Cancer. 2000;83:366. doi: 10.1054/bjoc.2000.1260. [DOI] [PMC free article] [PubMed] [Google Scholar]
- 27.Johnson LV, Walsh ML, Bockus BJ, Chen LB. J Cell Biol. 1981;88:526. doi: 10.1083/jcb.88.3.526. [DOI] [PMC free article] [PubMed] [Google Scholar]
- 28.Davis S, Weiss MJ, Wong JR, Lampidis TJ, Chen LB. J Biol Chem. 1985;260:13844. [PubMed] [Google Scholar]
- 29.Riddell JR, Wang X-Y Hans, Minderman H, Gollnick SO. J Immunol. 2010;184:1022. doi: 10.4049/jimmunol.0901945. [DOI] [PMC free article] [PubMed] [Google Scholar]
- 30.Mosmann T. J Immunol Methods. 1983;65:55. doi: 10.1016/0022-1759(83)90303-4. [DOI] [PubMed] [Google Scholar]
- 31.Chaudhary PM, Mechetner EB, Roninson IB. Blood. 1992;80:2735. [PubMed] [Google Scholar]
- 32.Ludescher C, Pall G, Irschick EU, Gastl G. Br J Haematol. 1998;101:722. doi: 10.1046/j.1365-2141.1998.00751.x. [DOI] [PubMed] [Google Scholar]
- 33.Pilarski LM, Paine D, McElhaney JE, Cass CE, Belch AR. Am J Hematol. 1995;49:323. doi: 10.1002/ajh.2830490411. [DOI] [PubMed] [Google Scholar]
- 34.Coon JS, Wang YZ, Bines SD, Markham PN, Chong AS, Gebel HM. Hum Immunol. 1991;32:134. doi: 10.1016/0198-8859(91)90110-u. [DOI] [PubMed] [Google Scholar]
- 35.Guimond M, Balassy A, Barrette M, Brochu S, Perreault C, Roy DC. Blood. 2002;100:375. doi: 10.1182/blood-2001-12-0353. [DOI] [PubMed] [Google Scholar]
- 36.Tsuruo T, Iida H, Tsukagoshi S, Sakurai Y. Cancer Res. 1981;41:1967. [PubMed] [Google Scholar]
- 37.Wahl DR, Byersdorfer CA, Ferrara JL, Opipari AW, Glick GD., Jr Immulog Rev. 2012;249:104. doi: 10.1111/j.1600-065X.2012.01148.x. [DOI] [PMC free article] [PubMed] [Google Scholar]
- 38.Bernal SD, Lampidis TJ, McIsaac RM, Chen LB. Science. 1983;222:169. doi: 10.1126/science.6623064. [DOI] [PubMed] [Google Scholar]
- 39.Kessel D, Woodburn K. Br J Cancer. 1995;71:306. doi: 10.1038/bjc.1995.61. [DOI] [PMC free article] [PubMed] [Google Scholar]
- 40.Ogata M, Inanami O, Nakajima M, Nakajima T, Hiraoka W, Kuwabara M. Photochem Photobiol. 2003;78:241. doi: 10.1562/0031-8655(2003)078<0241:cacacb>2.0.co;2. [DOI] [PubMed] [Google Scholar]
- 41.Szewczyk P, Tao HC, McGrath AP, Villaluz M, Rees SD, Lee SC, Doshi R, Urbatsch IL, Zhang QH, Chang G. Acta Crystallogr D Biol Crystallogr. 2015;71:732. doi: 10.1107/S1399004715000978. [DOI] [PMC free article] [PubMed] [Google Scholar]
- 42.Grayson JM, Laniewski NG, Lanier JG, Ahmed R. J Immunol. 2003;170:4745. doi: 10.4049/jimmunol.170.9.4745. [DOI] [PubMed] [Google Scholar]
Associated Data
This section collects any data citations, data availability statements, or supplementary materials included in this article.


