

Abstract
Genome-wide association studies (GWAS) have identified multiple common susceptibility loci for pancreatic cancer. Here we report fine-mapping and functional analysis of one such locus residing in a 610 kb gene desert on chr13q22.1 (marked by rs9543325). The closest candidate genes, KLF5, KLF12, PIBF1, DIS3 and BORA, range in distance from 265-586 kb. Sequencing three sub-regions containing the top ranked SNPs by imputation P-value revealed a 30 bp insertion/deletion (indel) variant that was significantly associated with pancreatic cancer risk (rs386772267, P = 2.30 × 10⁻¹¹, OR = 1.22, 95% CI 1.15–1.28) and highly correlated to rs9543325 (r2 = 0.97 in the 1000 Genomes EUR population). This indel was the most significant cis-eQTL variant in a set of 222 histologically normal pancreatic tissue samples (β = 0.26, P = 0.004), with the insertion (risk-increasing) allele associated with reduced DIS3 expression. DIS3 encodes a catalytic subunit of the nuclear RNA exosome complex that mediates RNA processing and decay, and is mutated in several cancers. Chromosome conformation capture revealed a long range (570 kb) physical interaction between a sub-region of the risk locus, containing rs386772267, and a region ∼6 kb upstream of DIS3. Finally, repressor regulatory activity and allele-specific protein binding by transcription factors of the TCF/LEF family were observed for the risk-increasing allele of rs386772267, indicating that expression regulation at this risk locus may be influenced by the Wnt signaling pathway. In conclusion, we have identified a putative functional indel variant at chr13q22.1 that associates with decreased DIS3 expression in carriers of pancreatic cancer risk-increasing alleles, and could therefore affect nuclear RNA processing and/or decay.
Introduction
Pancreatic cancer is one of the deadliest of all cancer types. With a 5-year survival rate of less than 5%, close to 42,000 people are estimated to die from this disease in the U.S in 2016 (1). In contrast to most other cancers, mortality rates for pancreatic cancer are not improving, and it is predicted to become the second leading cause of cancer related deaths in the U.S. by 2030 (2). A small proportion of the familial aggregation of pancreatic cancer can be explained by hereditary cancer syndromes caused by rare high-risk inherited protein coding mutations in genes such as BRCA2, CDKN2A, MLH1, MSH2, STK11, VHL, ATM, PALB2 and PRSS1 (3). Genome-wide association studies (GWAS) of pancreatic cancer susceptibility have identified germline risk variants at the other end of the spectrum, i.e. common variants conferring low risk. Up to 20 distinct common susceptibility loci that harbour such susceptibility variants for pancreatic cancer have now been identified in individuals of European and Asian ancestry (4).
In contrast to Mendelian diseases in which the majority of mutations appear to alter protein coding sequences, nearly all susceptibility variants discovered in GWAS to date localize to intergenic or intronic regions, suggesting that either alterations in gene expression or previously unannotated transcripts could underlie the association signals. Despite major advances in the discovery of common risk variants for many cancers through GWAS, the elucidation of their functional roles is still in the early stages (5). Although hundreds of cancer susceptibility loci have been identified in GWAS, only a small number have been characterized in detail by: 1) pinpointing the functional variant(s), 2) identifying the gene(s) influenced by the functional variant(s) and 3) unraveling the mechanism by which they influence gene expression, gene function or other molecular phenotypes.
One of the current fundamental questions in biology is how the higher level organization of the chromatin influences and regulates basic cellular processes that are essential for proper and reliable function of our genomes. As most risk loci identified through GWAS are noncoding, understanding such chromosomal interactions and their ensuing effects on the regulation of gene expression, and other molecular phenotypes, is of great interest. A growing number of genome-wide datasets describing chromatin interaction and regulatory elements across multiple cell types have begun to uncover the complexity of the noncoding parts of our genome. According to the Encyclopedia of DNA Elements (ENCODE) project, up to 80% of the human genome may be functional (6). This is highly relevant for understanding the biology of risk variants identified through GWAS as these variants may lie in important functional elements and mediate allele-specific effects on expression of nearby or distant genes.
One such susceptibility locus, which confers risk of pancreatic cancer and was identified in a GWAS designated PanScan (7,8), lies in a large (∼610 kb) non-genic genomic region on chr13q22.1. Fine-mapping this region identified eight highly correlated candidate variants for functional follow up. By investigating this set of genetic variants that are most strongly associated with pancreatic cancer risk at this locus, we identified a putative functional indel variant (rs386772267) that interacts with the DIS3 promoter and associates with DIS3 expression in a manner consistent with lower DIS3 levels in carriers of risk increasing alleles.
Results
Fine-mapping and characterization of a highly correlated indel variant
We performed imputation and fine-mapping of the chr13q22.1 pancreatic cancer risk locus (originally marked by rs9543325) using three pancreatic cancer GWAS datasets (PanScan I, II & III) (7–9) and two imputation reference datasets (the 1000 Genomes/1000G and NCI’s Division of Cancer Epidemiology and Genetics/DCEG reference datasets) (10,11). This SNP is located in a ∼610 kb gene desert between KLF5 (∼265 kb upstream) and KLF12 (∼344 kb downstream) (Fig. 1). Fine-mapping did not improve the signal markedly, but rather identified a set of highly significant variants for functional follow up (Table 1). The most significant variant was rs9573166 (OR = 1.25, 95% CI 1.18–1.32, P = 3.39×10⁻¹⁵). Conditioning the analysis on this SNP did not reveal additional signals in the region (see Materials and Methods). In addition to rs9573166, seven other variants were considered as candidate functional variants. The likelihood ratios of these eight candidate variants were all ≥1:5,707 relative to the most significant SNP, demonstrating the improbability that the variant responsible for this risk association signal was excluded from our analysis. These variants were all highly correlated with the most significant variant (r2 > 0.8, 1000G EUR) and include the GWAS SNP rs9543325 (OR = 1.23, 95% CI 1.16–1.30, P = 1.02×10⁻¹³). They fall into three sub-regions spanning ∼10 kb on 13q22.1 that we have termed A, B and C (Fig. 1).
Figure 1.

Schematic drawing of the chr13q22.1 pancreatic cancer risk locus. The top panel shows recombination rate (cM/Mb) in the CEU population relative to the risk locus (top risk SNPs, shown by red vertical bars), the nongenic region and the surrounding genes: MZT1, BORA, DIS3, PIBF1, KLF5 and KLF12. The lower panels show three sub-regions of the risk locus, each containing one or more of the eight highly correlated variants strongly associated with risk of pancreatic cancer and their imputed P value rank. The reported GWAS SNP is rs9543325. For each of the eight strongly-associated variants, layered H3K4Me1, H3K4Me3 and H3K27Ac chromatin immunoprecipitation (ChIP-seq), DNAse I hypersensitivity sequencing (DNase), and transcription factor ChIP-seq (TF ChIP-seq) data from the ENCODE project are shown, as displayed by the UCSC Genome Browser.
Table 1.
Association results for putative functional pancreatic cancer risk variants on chr13q22.1
| SNP | Positiona | r2b | Minor allelec | Major allelec | Catd | Infoe | Stage | Allelic OR (95% CI) |
MAF |
P | |
|---|---|---|---|---|---|---|---|---|---|---|---|
| Controls | Cases | ||||||||||
| rs9573166 | 73926086 | 0.86 | G | A | i | 0.98 | PanScan 1&2 | 1.27 (1.19-1.37) | 0.39 | 0.44 | 4.65 x 10⁻¹² |
| i | 0.98 | PanScan 3 | 1.20 (1.10-1.33) | 0.39 | 0.45 | 1.19 x 10⁻⁴ | |||||
| Combined | 1.25 (1.18-1.32) | 3.39 x 10⁻¹⁵ | |||||||||
| rs9573165 | 73917375 | 1.00 | C | T | i | 1 | PanScan 1&2 | 1.27 (1.18-1.35) | 0.37 | 0.42 | 2.17 x 10⁻¹¹ |
| i | 1 | PanScan 3 | 1.19 (1.08-1.30) | 0.37 | 0.42 | 5.12 x 10⁻⁴ | |||||
| Combined | 1.23 (1.16-1.30) | 7.43 x 10⁻¹⁴ | |||||||||
| rs4885093 | 73910026 | 0.98 | G | A | i | 0.99 | PanScan 1&2 | 1.27 (1.18-1.35) | 0.36 | 0.42 | 4.19 x 10⁻¹¹ |
| i | 0.99 | PanScan 3 | 1.19 (1.09-1.32) | 0.37 | 0.42 | 3.19 x 10⁻⁴ | |||||
| Combined | 1.23 (1.16-1.30) | 8.46 x 10⁻¹⁴ | |||||||||
| rs2038790 | 73915644 | 1.00 | C | T | i | 1 | PanScan 1&2 | 1.27 (1.18-1.35) | 0.37 | 0.42 | 2.41 x 10⁻¹¹ |
| i | 1 | PanScan 3 | 1.19 (1.08-1.30) | 0.38 | 0.43 | 5.58 x 10⁻⁴ | |||||
| Combined | 1.23 (1.16-1.30) | 9.07 x 10⁻¹⁴ | |||||||||
| rs9543325 | 73916628 | 1.00 | C | T | g | 1 | PanScan 1&2 | 1.27 (1.18-1.35) | 0.37 | 0.42 | 2.87 x 10⁻¹¹ |
| g | 1 | PanScan 3 | 1.19 (1.08-1.30) | 0.38 | 0.43 | 5.10 x 10⁻⁴ | |||||
| Combined | 1.23 (1.16-1.30) | 1.02 x 10⁻¹³ | |||||||||
| rs34829850 | 73918729 | 1.00 | G | – | i | 0.98 | PanScan 1&2 | 1.25 (1.18-1.35) | 0.37 | 0.42 | 5.59 x 10⁻¹¹ |
| i | 0.98 | PanScan 3 | 1.19 (1.08-1.30) | 0.37 | 0.42 | 6.20 x 10⁻⁴ | |||||
| Combined | 1.23 (1.16-1.30) | 2.24 x 10⁻¹³ | |||||||||
| rs2147512 | 73924784 | 1.00 | C | T | i | 0.99 | PanScan 1&2 | 1.25 (1.16-1.33) | 0.37 | 0.42 | 1.09 x 10⁻¹⁰ |
| i | 0.99 | PanScan 3 | 1.19 (1.08-1.30) | 0.37 | 0.43 | 5.41 x 10⁻⁴ | |||||
| Combined | 1.23 (1.16-1.30) | 3.38 x 10⁻¹³ | |||||||||
| rs386772267* | 73925671 | 0.97 | ACATCTT TTCTTTG AGGCTTA AATAGTATC | TCT | i | 0.88 | PanScan 1&2 | 1.23 (1.15-1.33) | 0.44 | 0.49 | 2.44 x 10⁻⁹ |
| i | 0.89 | PanScan 3 | 1.18 (1.06-1.30) | 0.44 | 0.48 | 1.79 x 10⁻³ | |||||
| Combined | 1.22 (1.15-1.28) | 2.30 x 10⁻¹¹ | |||||||||
Results from unconditional logistic regression of genotyped and imputed variants in PanScan I, II and III.
Position of SNP in NCBI genome build 37 (Hg19).
LD (r2 in 1000G EUR population) with the published 13q22.1 GWAS SNP rs9543325.
Minor and major alleles.
Category: imputed (i) and genotyped (g) variants.
imputation accuracy (information) score. Number of control and case subjects in the combined analysis of PanScan I, II and III: rs9573166 (8,843/5,105), rs9573165 (8,845/5,107), rs4885093 (8,843/5,107), rs2038790 (8,843/5,106), rs9543325 (8,845/5,107), rs34829850 (8,843/5,106), rs2147512 (8,843/5,105), rs386772267 (8,843/5,105). OR: per-allele odds ratio for the minor allele adjusted for age, sex, study, arm and significant principal components for PanScan I & II; per-allele odds ratio for the minor allele adjusted for age, sex, geographic region and significant principal components for PanScan III. Text in bold indicates the combined meta-analysis results.
The imputation for rs386772267 is based on rs76366896, which is the dbSNP and 1000G annotation for the smaller portion of the full indel variant (alleles: ACA/-).
Sequencing these three genomic regions in HapMap CEU samples (n = 110) and PanScan samples (n = 1,193) revealed two perfectly correlated (r2 = 1.0) indel variants separated by 3 bps, rs76366896 (3 bp) and rs78834823 (24 bp), in sub-region C. The perfect correlation and close proximity of these indels suggested they may represent a single variant, and indeed dbSNP and 1000G now contain an entry, rs386772267 (TCT/ACATCTTTTCTTTGAGGCTTAAATAGTATC), accurately describing them as such. However, it should be noted that at the time of this analysis 1000G only contained genotype data on the smaller of the two indels (rs76366896) and an entry with an incorrect conglomeration of the two indels (annotated as rs527392427; see Supplementary Material, Figure S1 for comparison of 1000G/dbSNP entries and our sequencing results). Including sequence based genotypes for rs386772267 with 1000G reference data used for imputation into PanScan I & II (see Materials and Methods) yielded a highly significant association (PPanScanI&II = 1.29×10⁻⁹, OR = 1.19 95% CI 1.05–1.35) that was similar to the association for the smaller indel based on 1000G data alone (rs76366896: PPanScanI&II = 2.44×10⁻⁹, OR = 1.23, 95% CI 1.15–1.33). The concordance rate between sequenced and imputed genotypes for rs386772267 in PanScan samples (n = 1,193) was 0.95. We therefore refer to this variant as the combined indel variant annotated as rs386772267 throughout this manuscript (Table 1).
Allele-specific effect on gene expression implicates DIS3 as a target gene
We next performed TaqMan-based expression quantitative trait locus (eQTL) analysis for the eight highly significant and correlated variants in histologically normal pancreatic tissue samples (n = 222) to assess their association with the expression of genes that flank the ∼600 kb gene desert and risk locus: BORA (586 kb upstream), DIS3 (560 kb upstream), PIBF1 (326 kb upstream), KLF5 (265 kb upstream) and KLF12 (344 kb downstream). This analysis revealed an association between all eight variants and expression of DIS3 that was significant at a false discovery rate (FDR) of 0.05, though the indel rs386772267 showed the most significant association (β = 0.26, P = 0.004) (Table 2). Lower levels of DIS3 mRNA expression were seen in heterozygous and homozygous carriers of the insertion (risk increasing) allele as compared to homozygous carriers of the deletion allele (Fig. 2A). While not significant, a suggestive eQTL was noted for PIBF1 (rs386772267: β = 0.16, P = 0.077), which shares a promoter with DIS3 (Table 2 and Fig. 1).
Table 2.
eQTL results for candidate functional variants and cis-genes
|
TaqMan eQTL |
GTEx eQTL |
|||||||||||||||||||
|---|---|---|---|---|---|---|---|---|---|---|---|---|---|---|---|---|---|---|---|---|
|
BORA |
DIS3 |
PIBF1 |
KLF5 |
KLF12 |
BORA |
DIS3 |
PIBF1 |
KLF5 |
KLF12 |
|||||||||||
| SNP | β | P | β | P | β | P | β | P | β | P | β | P | β | P | β | P | β | P | β | P |
| rs4885093 | 0.122 | 0.191 | 0.210 | 0.028* | 0.153 | 0.102 | 0.075 | 0.440 | 0.125 | 0.201 | 0.021 | 0.861 | 0.142 | 0.071 | 0.128 | 0.134 | 0.057 | 0.546 | 0.048 | 0.586 |
| rs2038790 | 0.125 | 0.176 | 0.206 | 0.030* | 0.151 | 0.104 | 0.079 | 0.414 | 0.130 | 0.182 | 0.026 | 0.827 | 0.138 | 0.082 | 0.159 | 0.066 | 0.051 | 0.589 | 0.041 | 0.649 |
| rs9543325 | 0.115 | 0.217 | 0.216 | 0.024* | 0.143 | 0.125 | 0.072 | 0.460 | 0.141 | 0.148 | 0.022 | 0.852 | 0.138 | 0.083 | 0.156 | 0.071 | 0.052 | 0.586 | 0.038 | 0.671 |
| rs9573165 | 0.125 | 0.176 | 0.206 | 0.030* | 0.151 | 0.104 | 0.080 | 0.409 | 0.130 | 0.181 | 0.028 | 0.812 | 0.142 | 0.078 | 0.148 | 0.090 | 0.050 | 0.602 | 0.043 | 0.631 |
| rs34829850 | 0.123 | 0.184 | 0.205 | 0.032* | 0.150 | 0.106 | 0.080 | 0.409 | 0.130 | 0.181 | 0.026 | 0.825 | 0.127 | 0.112 | 0.155 | 0.073 | 0.052 | 0.585 | 0.035 | 0.692 |
| rs2147512 | 0.054 | 0.548 | 0.220 | 0.016* | 0.143 | 0.115 | 0.059 | 0.520 | 0.149 | 0.107 | 0.028 | 0.813 | 0.137 | 0.091 | 0.162 | 0.065 | 0.049 | 0.610 | 0.032 | 0.728 |
| rs386772267 | 0.084 | 0.364 | 0.263 | 0.004* | 0.162 | 0.077 | 0.039 | 0.677 | 0.130 | 0.167 | 0.046 | 0.712 | 0.130 | 0.118 | 0.162 | 0.073 | 0.057 | 0.567 | 0.040 | 0.671 |
| rs9573166 | 0.146 | 0.116 | 0.246 | 0.008* | 0.189 | 0.040 | 0.054 | 0.566 | 0.147 | 0.116 | 0.005 | 0.966 | 0.137 | 0.090 | 0.174 | 0.048 | 0.040 | 0.681 | 0.034 | 0.704 |
mRNA expression was assessed in 222 histologically normal pancreatic tissue samples by TaqMan analysis and correlated to germline genotypes for the 8 variants (left panels). eQTL results were queried for 149 histologically normal post-mortem pancreatic tissue samples in the GTEx database for the same variants (right panels). The effect (β) is given with respect to the major (protective) allele.
Significant at FDR < 0.05 per gene.
Figure 2.
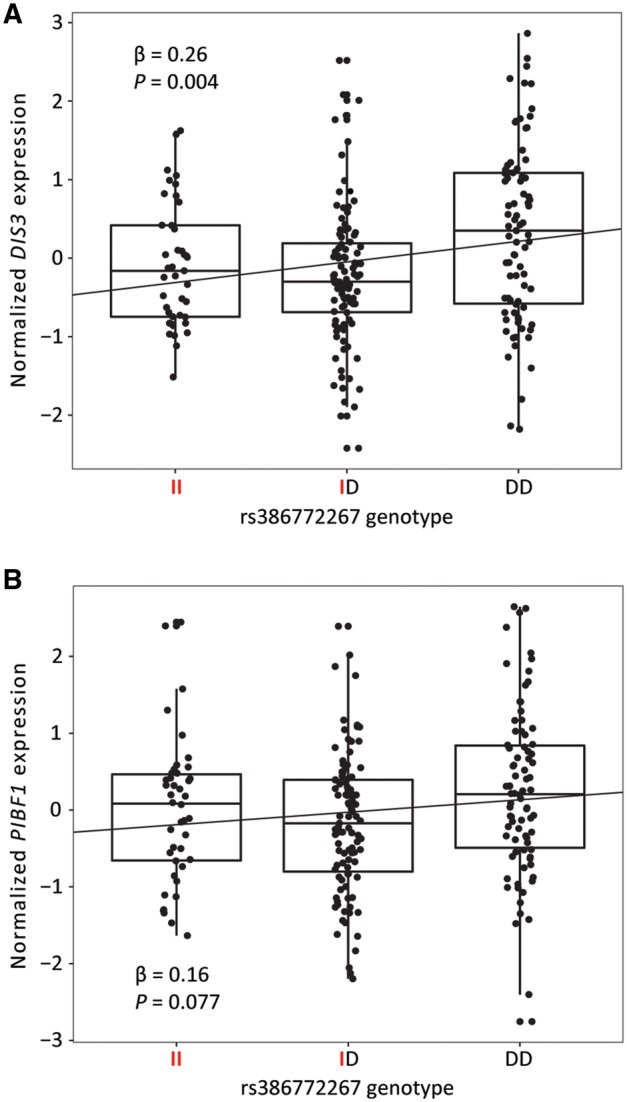
Expression quantitative trait locus (eQTL) analysis showing rs386772267 associations with DIS3 and PIBF1 mRNA expression. Box plots with jittered data points from TaqMan-based eQTL analysis of 222 histologically normal pancreatic tissue samples. Trend lines from linear regression analysis are included on each plot. Red letters indicate the minor (risk-increasing) allele genotypes for rs386772267 (I = insertion, D = deletion). Genotype distribution was as follows: II = 41, ID = 99, DD = 82. (A) Association results for rs386772267 and normalized DIS3 mRNA expression. (B) Association results for rs386772267 and normalized PIBF1 mRNA expression.
The Genotype-Tissue Expression (GTEx) project currently contains RNA-seq and germline genotype data for 149 histologically normal pancreatic tissue samples that we used for validation of our TaqMan-based eQTL analysis (12). While none of the tested candidate variants reached a significance threshold of P < 0.05 for DIS3, 6 out of 8 had P < 0.1 (Pmin, rs4885093 = 0.071, βrs4885093 = 0.14), and all demonstrated the same direction of effect with the risk-increasing, minor allele associated with lower DIS3 expression (Table 2 and Supplementary Material, Fig. S2A). The associations between our candidate risk variants and PIBF1 were nominally significant in GTEx (Pmin, rs9573166 = 0.048, βrs9573166 = 0.17), and with the same direction of effect as DIS3 (Fig. 2B and Supplementary Material, Fig. S2B). The eQTLs for DIS3 and PIBF1 in GTEx were not significant at FDR < 0.05.
Sub-region C physically interacts with a genomic region upstream of the DIS3 promoter
In order for the risk variants to exert a regulatory effect on DIS3 expression at such a distance (560 kb), long-range chromatin interactions are likely required. We therefore performed the chromosome conformation capture (3C) analysis to determine whether the candidate functional variants were brought into close 3-dimensional proximity to DIS3 or surrounding genes through chromatin looping. Sub-regions A, B and C were each used as baits in a multiplexed qPCR assay for ligation to 34 target XbaI restriction fragments along chr13q22.1 in pancreatic cancer cell lines. Three cell lines were selected based on their different genotypes at the risk locus: homozygous major alleles (PANC-1), heterozygous (MIAPaCa-2) and homozygous minor alleles (BxPC-3). A robust signal was seen in all three cell lines for ligation between sub-region C and an ∼8.5 kb fragment approximately 5.9 kb upstream of the DIS3 transcriptional start site (TSS) that we refer to as target 30 (Fig. 3). Target 30 (Hg19 position chr13:73,361,619-73,370,117) contains transcription factor binding sites and open chromatin marks identified by the ENCODE project, suggesting a possible gene expression regulatory role (Supplementary Material, Fig. S3). No significant interactions were detected for sub-regions A and B for the 34 tested targets along chr13q22.1.
Figure 3.

Physical interaction between the risk locus and a region upstream of DIS3. Results from chromosome conformation capture (3C) experiments using three pancreatic cancer cell lines (BxPC-3, MIAPaCa-2 and PANC-1). Physical interactions were assessed between sub-regions A, B and C of the risk locus and 34 targets along chr13q22.1. Robust interaction was observed between sub-region C (green) and a region (target 30: Hg19 position chr13:73,361,619-73,370,117) near the DIS3 promoter. Other sub-regions of the risk locus (A and B) did not show this interaction. Sub-region C contains the indel variant (rs386772267), as well as two other highly correlated SNPs (rs2147512 and rs9573166). The analysis for each cell line was performed in triplicate, and error bars represent 1 standard deviation.
Allele-specific regulatory effects mediated by rs386772267 in pancreatic cancer cell lines
Although the eQTL results for rs386772267 and the chromosomal interaction between sub-region C and a potential regulatory element upstream of the DIS3 promoter implicate sub-region C as a potentially relevant expression regulator, we tested each of the sub-regions for allele-specific regulatory activity by luciferase assays in two pancreatic cancer cell lines (PANC-1 and MIAPaCa-2). Sub-region B was split into two series of constructs, B1 (containing rs2038790 and rs9543325) and B2 (containing rs9573165 and rs34829850), for cloning purposes. Marginally significant (P < 0.05) allele-specific differences were noted in regulatory activity in sub-regions A, B1 and B2 in at least one cell line, though in each case this was only observed in one of the two possible orientations (i.e. forward or reverse) (Fig. 4A–C). Sub-region C displayed a more significant allele-specific regulatory effect, seen in the reverse orientation using both PANC-1 (P = 0.0001) and MIAPaCa-2 cells (P = 0.0006) (Fig. 4D). Given the eQTL and 3C results, we proceeded with testing each candidate variant in sub-region C separately for allele-specific regulatory activity (Fig. 4E–G). In this case, a clear and consistent allele-specific effect was observed for the indel rs386772267 in both orientations and in each cell line (P = 0.0012–0.0050, Fig. 4F). Specifically, the insertion (minor and risk-increasing) allele was associated with reduced luciferase activity as compared to the deletion (major and protective) allele, which is consistent with the direction of effect for the rs386772267-DIS3 eQTL. The other two candidate variants in sub-region C (rs2147512 and rs9573166) did not show clear allele-specific effects in luciferase activity (Fig. 4E and G).
Figure 4.

Allele-dependent regulatory activity for chr13q22.1 sub-regions A through C. Allele-specific luciferase activity was assessed for sub-regions A, B1, B2 and C in PANC-1 and MIAPaCa-2 pancreatic cancer cell lines (A–D). Sub-region C was then divided into fragments individually containing each of the three highly significant risk variants for luciferase assays (E–G). DNA fragments containing different alleles were cloned upstream of a minimal promoter driven reporter (pGL4.23) in the forward or reverse genomic orientation followed by transient transfections and luciferase assays. Luciferase activity was normalized to empty vector. Each graph displays the results from an individual representative experiment, and errors bars represent 1 standard deviation from sextuplicate transfections within that experiment. The significance of allelic differences in luciferase activity were calculated by t-test based on minor/major allele ratios from at least three separate experiments, and are indicated on these representative graphs by * (P < 0.05), ** (P< 0.01) and *** (P< 0.005).
TCF/LEF family of transcription factors bind the insertion allele of rs386772267
If rs386772267 is a functional variant underlying this risk signal (in part or completely), this would likely be mediated by allele-specific transcription factor (TF) binding. We first tested this hypothesis by electromobility shift assays (EMSAs) using nuclear extracts from PANC-1 and MIAPaCa-2 cells. Allele-specific binding was observed for the insertion, but not the deletion probe, as evidenced by the competitive elimination of a shifted insertion probe band by the unlabelled insertion (not deletion) allele competitor (Fig. 5A and Supplementary Material, Fig. S4). In silico prediction implicated two potential binding sites for members of the TCF/LEF transcription factor family (LEF1, TCF7, TCF7L1 and TCF7L2) as being present specifically in the insertion allele (Fig. 5B).
Figure 5.

The TCF/LEF family of transcription factors bind the insertion allele of rs386772267 in an allele-specific manner. (A) Electromobility shift assay (EMSA) of rs386772267 deletion and insertion allele probes incubated with PANC-1 nuclear extract with and without unlabelled allelic competitors reveals an allele-specific band for the insertion probe (indicated by the arrow). (B) Alignment of binding sequence motifs for TCF/LEF transcription factors against the insertion probe (insertion allele designated in red). Similarity scores indicate similarity of aligned insertion allele probe to binding sequence matrices for the respective TFs as calculated by Genomatix MatInspectorTM. (C and D) The ratios for medium and light labelled proteins bound to (C) insertion allele vs. scrambled insertion or (D) vs. deletion allele probes. Isotopic labeling for the y-axis experiments were reversed compared to those of the x-axis. Proteins indicated in red (TCF7L2 and SNRPA1) showed consistent preferential binding to the insertion allele vs. both scrambled insertion and deletion allele probes. (E) The insertion probe’s allele-specific EMSA band (indicated by black arrow) demonstrated supershifting (indicated by red arrow) or disappeared entirely in the presence of LEF1, TCF7 or TCF7L2 antibodies using either MIAPaCa-2 or PANC-1 nuclear extract.
Next, we performed pulldowns of probes containing the insertion allele, deletion allele or scrambled insertion allele incubated with Ger pancreatic cancer cell nuclear extracts followed by isotopic di-methyl protein labeling and quantitative LC-mass spectrometry to identify proteins that could be responsible for the allele-specific binding observed by EMSA. Notably, TCF7L2, a transcription factor of the Wnt signalling pathway (13), was found to preferentially bind the insertion allele probe compared to both the scrambled insertion and deletion allele probes (Fig. 5C and D), which was consistent with the in silico predictions (Fig. 5B). SNRPA1, a member of the splicing machinery (14), was also preferentially bound to the insertion allele probe in each experiment.
Finally, we performed supershift EMSA on the insertion allele probe using antibodies against each member of the TCF/LEF family (LEF1, TCF7, TCF7L1 and TCF7L2). Supershifts were observed for the allele-specific band in the presence of LEF1 and TCF7 antibodies, and the TCF7L2 antibody caused a disappearance of the allele-specific band (Fig. 5E). These results suggest that at least three of the four TCF/LEF members are capable of allele-specifically binding the insertion allele of rs386772267.
Discussion
Taken together, our fine-mapping and functional analyses have identified an insertion/deletion variant, rs386772267, as a probable functional variant at the chr13q22.1 pancreatic cancer risk locus. The data suggest a model in which allele-specific binding of one or more members of the TCF/LEF family of transcription factors to rs386772267 may lead to repression of DIS3 expression through long-range chromatin interactions. While our work presents the first steps in unraveling the functional consequences of carrying pancreatic cancer risk variants on chr13q22.1, additional work is needed to completely understand this locus and the role DIS3 may play in this regard. However, there are several reasons to suspect that this gene might be important for pancreatic cancer and cancer in general. While the effects of DIS3 in the context of cancer have not previously been explored in depth, mutations in DIS3 have been observed in several cancer types (15–20). Perhaps the most striking example is multiple myeloma (MM), which shows a 10–18.5% somatic mutation rate in different studies (15,16,20,21). DIS3 ribonuclease II (RNB) domain mutations observed in MM were shown to be synthetic lethal with catalytic mutations in the PIN domain, suggesting a possible drug target (22). Furthermore, a trend towards shorter survival was observed in MM patients with DIS3 mutations (16). Other studies have shown DIS3 missense mutations in acute myeloid leukaemia, somatic deletions in breast cancer and loss of heterozygosity in superficial spreading melanoma (17–19). Collectively, these studies suggest a possible tumour suppressor activity for DIS3 in these cancers.
DIS3 (also known as RRP44) is one of only three known catalytic components of the human RNA processing and degrading exosome that is responsible for 3’-5’ trimming of precursor ncRNA and decay of normal and aberrant transcripts of all types (23–26). DIS3 contains both an RNB domain with processive 3’-5’ riboexonuclease activity, and a PIN domain with endonucleolytic activity. Transcripts that contain various destabilizing sequence elements display specific sensitivity to exosome-mediated decay (27). Phenotypes for DIS3 mutants and knockdowns have been mainly characterized in yeast and Drosophila, and suggest potential tumourigenic effects. DIS3 was originally identified as a mitotic control gene in fission yeast (28). The dis3-54 RNase domain mutant in S. pombe caused mitotic arrest apparently due to improper kinetochore-spindle interactions, and release of this mitotic arrest resulted in aberrant sister chromatid separation (29). In S. cerevisiae, DIS3 or core exosome component mutants displayed altered microtubule localization and structure, and RNA-seq of these mutants revealed broad changes in cell cycle and microtubule-related transcript levels (30). DIS3 was also shown to be essential for development in Drosophila where transgenic knockdown resulted in retarded growth, melanotic tumour formation and larval lethality (31). Widespread transcriptomic changes were noted at different developmental stages, including down-regulation of early expressed RNAs. These effects are presumably mediated by the loss of RNA processing and/or decay activities.
Although these studies were not performed in human cells, the high conservation of DIS3 and of the exosome complex as a whole suggests that many of its broader functions are likely conserved (25,32,33). However, a key difference between yeast and humans in this regard is the presence of two DIS3 paralogs in humans, DIS3L and DIS3L2 (25,33,34). Yeast DIS3 is localized to both the nucleus and cytoplasm. In contrast, human DIS3 is primarily nuclear, while DIS3L and DIS3L2 are strictly cytoplasmic, and their distributions reflect their substrate preferences. DIS3 is the only human homolog to maintain the endonucleolytic activity of its PIN domain, however the functional relevance of this activity is still unclear. Unlike the other two homologs, DIS3L2 does not associate with the core exosome complex. Given the distinct localizations and protein binding of the three paralogs, it is unlikely that their RNA processing and decay functions greatly overlap. However, it is interesting to note that DIS3L2 germline mutations are associated with Perlman syndrome and Wilms tumour susceptibility, indicating a likely tumour suppressor function (35).
Suggestive expression QTL results for PIBF1 in our samples and in GTEx indicate that this gene may also be influenced by pancreatic cancer risk variants at chr13q22.1. Given the shared bi-directional promoter for DIS3 and PIBF1, this is perhaps not surprising. PIBF1 encodes the progesterone-induced blocking factor that is required for appropriate immunomodulation during pregnancy (36). However, it is also commonly overexpressed in tumours of various tissues where it may affect cell cycle regulation and inhibit local antitumour immunity. Further work exploring the role of PIBF1 in pancreatic tumourigenesis and progression may therefore be warranted.
The 13q22.1 pancreatic cancer locus bears resemblance to two other non-genic risk loci on chromosomes 8q24.21 and 11q13.3. The former was one of the first chromosomal regions pinpointed to carry common cancer susceptibility variants through GWAS, and is now known to harbour multiple independent loci spanning over 1 Mb associated with risk of bladder, breast, colon, ovarian, pancreatic and prostate cancer as well as chronic lymphocytic leukemia and Hodgkin's lymphoma (37–39). Several risk loci in this genomic region have been shown to interact with the MYC or PVT1 promoters through long-range chromosomal interactions, and allele-specific effects on the expression of both genes have been reported (40–42). Chromosomal region 11q13.3 is another multi-cancer risk locus associated with risk of breast, prostate and renal cancer. Independent loci for breast and renal cancer have been shown to interact with the promoter of the cyclin D (CCND1) gene located ∼130 and ∼216 kb downstream, and possibly regulate its expression in an allele-specific manner (43,44).
In contrast to these multi-cancer susceptibility regions on chromosomes 8q24.21 and 11q13.3, the 13q22.1 risk signal explored here appears unique to pancreatic cancer risk. There are reported risk signals for endometrial and prostate cancer upstream in the same gene desert of 13q22.1 (45,46). However, SNPs representing these signals are not well correlated with those of the pancreatic cancer risk signal (r2 ≈ 0.020 and 0.005 in 1000G CEU population, respectively). Currently we can only speculate on the cause of such tissue specificity, though it is notable that sub-region C containing the putatively functional rs386772267 shows little to no indication of regulatory marks in ENCODE datasets, which are, however, lacking in exocrine pancreatic samples compared to many other tissue types. Future epigenetic studies may elucidate whether the allele-specific regulatory activity in sub-region C is pancreas specific.
In summary, our work has identified a putative functional indel variant on chr13q22.1 that physically interacts with a region near the promoter of DIS3 and associates with decreased DIS3 expression in carriers of the pancreatic cancer risk-increasing alleles. Although our work suggests that members of the TCF/LEF family of transcription factors may be involved in this effect, further work is required to elucidate the entire mechanism mediating regulation of DIS3 expression and to explore the role of DIS3 in pancreatic tumourigenesis.
Materials and Methods
Imputation and association analysis
Imputation was performed for PanScan I, II and III GWAS data (7–9) using the 1000G (Phase 1, version 3) (10) and the NCI Division of Cancer Epidemiology and Genetics (DCEG) reference datasets (11). The IMPUTE2 program (47) was used to impute genotypes across a 5Mb window on chr13q22.1 (71,425,000–76,425,000 bp (hg19) with a 250 kb buffer on each side as previously described (48). SNPs with low minor allele frequency (MAF < 0.01) or low imputation quality scores (IMPUTE2 information score < 0.3) were removed prior to association analysis. The association analysis was performed for 5,107 pancreatic cancer cases and 8,845 control subjects using logistic regression, adjusted for age, sex, study and significant components of population stratification as previously described (7,8). After conditioning the analysis on the most significant variant, rs9573166, nine variants in the region on chromosome 13 (∼73,600,000–74,300,000) with minor allele frequencies >0.01 were associated with pancreatic cancer at P = 1.0×10⁻³ to 1.4×10⁻⁴ (OR = 0.57–1.15). None were correlated with the set of eight potentially functional variants (r2 < 0.07) indicating that a strong independent risk signal in this region is unlikely.
The imputation of the rs386772267 indel variant was initially performed by sequencing DNA from 110 unrelated HapMap CEU, HCB and JPT DNA individuals using Sanger sequencing (ABI 3730xl DNA Analyzer) (primers are listed in Supplementary Material, Table S1) followed by manual inspection of sequence data (Sequencher by Gene Codes Corp.) for all samples to call genotypes as deletion/deletion, deletion/insertion or insertion/insertion. Two individuals performed this analysis separately and checked for genotype call concordance. Discordant calls (n = 2) were not included in the analysis. This analysis was followed by including the sequence-based indel genotype calls for rs386772267 in the 1000G reference dataset for these samples (HapMap CEU, HCB and JPT) and imputation into PanScan I & II GWAS data. The imputation accuracy (IMPUTE2 information score) for rs386772267 was 0.66. The association analysis was performed as described above (8). Next we calculated the likelihood ratio of all GWAS-significant variants relative to rs9573166, the most significant SNP based on the imputed association analysis. The likelihood ratio for each SNP was calculated by dividing the maximized likelihood for the tested SNP to the maximized likelihood for rs9573166 (49).
This region was also sequenced in DNA samples from the PanScan GWAS (n = 1,193) using the same primers and methods as listed above. Sequencing confirmed the perfect correlation between the two smaller indels (rs76366896/rs78834823, r2 = 1.0), supporting this variant as a single indel (rs386772267), and displayed high correlation with the initial GWAS marker SNP, rs9543325 (r2 = 0.79). The concordance rate between sequenced and imputed genotypes for rs386772267 in the 1,193 PanScan samples was 0.95.
Expression QTL analysis
Histologically normal, fresh frozen pancreatic tissue samples (n = 222) from participants of self-reported European ancestry were obtained from the following participating sites: the Mayo Clinic in Rochester, MN (n = 106, adjacent to tumour), Memorial Sloan Kettering Hospital in New York City, NY (n = 52, adjacent to tumour), Penn State College of Medicine in Hershey, PA (n = 31, from tissue donors via the Gift of Life Donor Program, Philadelphia, PA), OriGene Technologies, Inc. (n = 32, adjacent to tumour) and the National Disease Research Interchange (NDRI) (n = 4, from deceased tissue donors). Histologically normal samples adjacent to tumours were confirmed by a pathologist to be nonmalignant by pathology and with ≥80% epithelial component. No subjects had a history of neo-adjuvant therapy prior to surgery. Frozen tissue sections (10μm sectioned at −20°C in a Leica CM1950 cryostat) were lysed and RNA isolated as previously described (50). Total RNA was reverse transcribed using Super-script III first-strand synthesis kit (Invitrogen) and RT-qPCR performed in triplicate using TaqMan Gene Expression Master Mix (Applied Biosystems) and read by a 7900HT Fast Real-Time PCR System (Applied Biosystems). The Pfaffl method (51) was used to calculate expression values of BORA, DIS3, PIBF1, KLF5 and KLF12 (#Hs00227229_m1, #Hs00209014_m1, #Hs00197131_m1, #Hs00156145_m1, #Hs00255460_m1, respectively, Applied Biosystems) by normalizing to the geometric mean of three housekeeping genes (B2M #Hs00187842_m1, GAPDH #Hs99999905_m1 and PPIA #Hs99999904_m1, Applied Biosystems) and modified by a plate scaling factor based on identical cDNA standards on each plate. Expression values were then transformed to z-scores, and outliers with +/-3 z-scores were removed.
DNA was isolated from blood or histologically normal pancreatic, spleen or duodenum tissue samples (Gentra Puregene Tissue Kit, Qiagen) and genotyped as previously described on Illumina HumanOmni1-Quad and HumanOmniExpress genotyping arrays (8). The IMPUTE2 program (47) was used to impute array based genotype data across chr13q22.1 in the same manner as described above for finemapping using the 1000G reference set (Phase 1, version 3) (10). Samples genotyped on Illumina HumanOmni1-Quad and HumanOmniExpress arrays were imputed separately. For eQTL analysis, rs9543325 was genotyped by the above arrays, rs9573166 was genotyped by the custom TaqMan assay (Catalog #:4331349, Assay ID: AH6RPSN, Applied Biosystems), rs386772267 by sequencing as described above, and the rest of the variants were imputed as described above. Expression QTL analysis was performed using linear regression to determine associations between SNP genotypes and z-score transformed gene expression data. Adjustments for covariates (gender, age and study) provided negligible or deleterious effects on model metrics, and were therefore not included in the reported results.
The use of human samples was approved by the Institutional Review Boards of all participating institutions and the National Cancer Institute, NIH.
Cell lines and reagents
PANC-1 (ATCC) and Ger (kindly provided by Dr. Udo Rudloff, NCI, NIH) (52) pancreatic cancer cell lines were maintained in Dulbecco’s modified Eagle’s medium (DMEM, Mediatech Inc) supplemented with 10% foetal bovine serum (Life Technologies). The MIAPaCa-2 cell line (ATCC) was maintained in Dulbecco’s modified Eagle’s medium (DMEM, Mediatech Inc) supplemented with 10% foetal bovine serum and 2% horse serum (Life Technologies). The BxPC-3 cell line (ATCC) was maintained in Roswell Park Memorial Institute (RPMI) 1640 medium (RPMI 1640, Mediatech Inc) supplemented with 10% foetal bovine serum (Life Technologies). These cell lines were authenticated with a panel of short tandem repeats (STR) using the Identifiler kit (Life Technologies) and compared with the ATCC and the DSMZ (German Collection of Microorganisms and Cell Cultures) STR Profile Databases. Cell lines with profiles in either database matched (Ger cells did not have a profile). The cells were routinely tested for mycoplasma and were negative on each occasion.
Chromosome conformation capture (3C)
Control 3C templates were generated from bacterial artificial chromosome (BAC) clones spanning our region of interest on chr13q22.1 (RP11-342J4, RP11-555G22, RP11-505F3, RP11-309H15 and RP11-309J13; from the Children’s Hospital Oakland Research Institute BACPAC Resources Center). Each BAC DNA was digested overnight at 37°C with XbaI (New England Biolabs) followed by heat inactivation at 70°C for 15 min, and ligations overnight at 4°C using equal amounts of each digested BAC with T4 DNA ligase (New England Biolabs). Ligation reactions were heat inactivated at 70°C for 15 min.
PANC-1, MIAPaCa-2 and BxPC-3 cell lines were chosen to generate 3C templates because these cell lines represent the homozygous major allele, heterozygous and homozygous minor allele genotypes for all top functional candidates in the chr13q22.1 risk locus, respectively. The 3C templates were generated as described previously (53,54). Briefly, cells were crosslinked, and the chromatin was isolated, digested with XbaI, and ligated in a large volume reaction to encourage ligation of crosslinked DNA fragments rather than random intermolecular ligation. The ligated chromatin was then reverse crosslinked, and the DNA purified for qPCR. Each assay featured multiplexed TaqMan probes labelled with NED, VIC and FAM (Applied Biosystems), respectively, and forward primers for our 3 bait regions (sub-regions A, B and C) with reverse primers for one of 34 target fragments along chr13q22.1 (spanning 73298544–73926770, Hg19) upstream of the risk locus (primers and probes are listed in Supplementary Material, Table S1). Differential PCR efficiencies were controlled by normalizing to the control 3C template (described above). The experiment was performed three times for each cell line.
Luciferase reporter cloning and analysis
Each genomic sub-region (A: 2,898 bps; B1: 1,706 bps; B2: 1,697 bps and C: 1,772 bps) was PCR-amplified (primers listed in Supplementary Material, Table S1) from HapMap CEU DNA samples with the appropriate genotypes to obtain clones with each genotype, and cloned into the KpnI and NheI sites of the pGL4.23[luc2/minP] (Promega E8411) luciferase vector in the 5’-to-3’ or 3’-to-5’ orientation (primers listed in Supplementary Material, Table S1; primers for reverse orientation were identical with those for the forward orientation with the exception of the KpnI and NheI sites being swapped). Each of the three highly significant variants in sub-region C were also cloned separately in the forward and reverse orientation to investigate their individual effects: rs386772267 (240 bps), rs2147512 (451 bps) and rs9573166 (537 bps) (primers listed in Supplementary Material, Table S1). All plasmid inserts were sequence-verified to contain the correct inserts and genotypes. The Firefly reporter plasmid (and a Renilla luciferase control vector) was co-transfected into the PANC-1 and MIAPaCa-2 pancreatic cancer cell lines at ∼40% confluence using Lipofectamine 2000 (Life Technologies). Luciferase activity was measured 48 h after transfection with the Dual Luciferase Reporter Assay System (Promega). Firefly luciferase activity was normalized to the Renilla luciferase activity. Each experiment was performed in 6-8 replicate wells and repeated at least three times. A t-test was used to assess the significance for allelic differences in luciferase activity.
In silico transcription factor binding prediction
Allele-specific binding predictions for the insertion and deletion alleles of rs386772267 were performed with Genomatix MatInspectorTM (55) using the corresponding EMSA probe sequences in Supplementary Material, Table S1. Sequence logos and similarity scores listed in Figure 5B are based on matrices V$LEF1.02, V$TCF7.01, V$TCF7L1.01, V$TCF7L2.02 within the Genomatix MatBaseTM transcription factor database.
Electrophoretic mobility shift assays (EMSA)
Nuclear extracts were purchased from Active Motif (PANC-1, MIAPaCa-2). Oligos (30–60 nt, Invitrogen, listed in Supplementary Material, Table S1) were labelled with a biotin 3’end-labeling kit (NEB) as per the manufacturer’s recommendations. Forward and reverse oligos were then annealed to create double stranded 3’-end labelled probes or unlabelled competitors. EMSAs were performed (Pierce) by incubating labelled probes for 20 min on ice with nuclear extracts (2.5 µg per reaction). Competition experiments were performed by adding 1–100 fold more unlabelled competitor than labelled probes. Supershift experiments were carried out by adding 4 µg anti-LEF1 (sc-8591x, Santa Cruz), anti-TCF7 (sc-271453x, Santa Cruz), anti-TCF7L1 (sc-13026x, Santa Cruz), anti-TCF7L2 (C48H11, Cell Signalling) or anti-IgG (sc-52001, Santa Cruz) antibodies to nuclear extracts for 20 min at room temperature prior to adding labelled probe. The resulting protein complexes were resolved on 4–20% TBE gels (Bio-Rad), transferred to Biodyne B membranes (VWR), crosslinked (Stratagene UV Stratalinker 1800) and detected using streptavidin-HRP conjugate and a chemiluminescent substrate (20148 LightShift Kit; Pierce).
Mass spectrometric analysis of oligonucleotide pulldowns
Nuclear extracts were made using the Nuclear Extract Kit (Active Motif). For each experiment, 400 μg of Ger (exocrine pancreatic cancer cell line) nuclear extract was incubated with 10 μg biotin-labelled DNA (insertion allele, deletion allele or scrambled insertion allele probes, listed in Supplementary Material, Table S1) and 10 μg dD/dT-dI/dC non-specific DNA in 500 μl DNA binding buffer (50 mM Tris pH 8.0, 150 mM NaCl, 0.1% NP-40). Samples were allowed to mix for 2 h at 4°C and were then incubated for an additional 30 min at 4°C with 20 μl of Streptavidin C1 Dynabeads (Invitrogen). Beads were washed 3 times with 1 mL DNA binding buffer followed by a final wash with 500 μl 100 mM TEAB buffer. Beads were resuspended in 100 μl 100 mM TEAB buffer and incubated with 1 μg trypsin at 37°C overnight. The supernatant was collected and beads washed 2 times with 50 μl TEAB which was collected with the supernatant. For dimethyl labeling, the samples were split into 100 μl aliquots and 4 μl 4% Formaldehyde (CH2O for light and CD2O for medium) was added followed by a quick vortex. 4 μl 0.6M Sodium cyanoborohydride was also added to each sample and they were left to vortex for 1 h at room temperature. 16 μl 1% ammonia was added to quench the reaction; matching samples were combined and dried in a speed vacuum. Prior to mass spectrometry analysis samples were desalted utilizing C18 spin columns (Pierce) separated using strong cation exchange, resulting in 12 samples, and dried in the speed vacuum. Samples were resuspended in 0.1% TFA, and mass spectrometry experiments were performed on a Thermo Scientific Orbitrap Fusion. The peptides were separated with a 50-min gradient of acetonitrile/0.1% formic acid (5–47% acetonitrile) with a flow rate of 200 nl/min, 20-min gradient of acetonitrile/0.1% formic acid (47–98% acetonitrile) with a flow rate of 200 nl/min, and 10 min of 98% acetonitrile, 0.1% formic acid at 500 nl/min. MS level scans were performed in the Orbitrap with resolution set to 120,000 and an intensity threshold of 5e3. MS/MS analysis was performed in the Top Speed mode with HCD activation set to 29% and iron trap detection (AGC target 1e4, maximum injection time 35ms). All files were processed using Proteome DiscovererTM and searched against the human UniProt database using the Sequest HT search engine. Search criteria used was 10 ppm for MS1 and 0.8 Da for MS2. Dimethyl labels (N-terminus and lysine, light +28.031 Da and medium +32.056 Da) were searched as static modifications and quantification was calculated using the peptide ratios of medium/light labels.
Supplementary Material
Supplementary Material is available at HMG online.
Supplementary Material
Acknowledgements
We thank the patients and donors of tissue and DNA samples that made this study possible. We are grateful to staff at Mayo Clinic (Rochester, MN), Memorial Sloan Kettering Cancer Center (New York City, NY) and Penn State College of Medicine (Hershey, PA) for help with tissue collection and processing. We are also grateful to staff at the Cancer Genomics Research Laboratory (CGR) at the National Cancer Institute, NIH, for their help with array genotyping.
Conflict of Interest statement. None declared.
Funding
This work was supported by the Intramural Research Program of the US National Institutes of Health (NIH), National Cancer Institute. The content of this publication does not necessarily reflect the views or policies of the Department of Health and Human Services, nor does mention of trade names, commercial products, or organizations imply endorsement by the U.S. Government.
References
- 1. Siegel R.L., Miller K.D., Jemal A. (2016) Cancer statistics, 2016. CA Cancer J Clin., 66, 7–30. [DOI] [PubMed] [Google Scholar]
- 2. Rahib L., Smith B.D., Aizenberg R., Rosenzweig A.B., Fleshman J.M., Matrisian L.M. (2014) Projecting cancer incidence and deaths to 2030: the unexpected burden of thyroid, liver, and pancreas cancers in the United States. Cancer Res., 74, 2913–2921. [DOI] [PubMed] [Google Scholar]
- 3. Klein A.P. (2012) Genetic susceptibility to pancreatic cancer. Mol. Carcinog., 51, 14–24. [DOI] [PMC free article] [PubMed] [Google Scholar]
- 4. Amundadottir L.T. (2016) Pancreatic Cancer Genetics. Int. J. Biol. Sci., 12, 314–325. [DOI] [PMC free article] [PubMed] [Google Scholar]
- 5. Monteiro A.N., Freedman M.L. (2013) Lessons from postgenome-wide association studies: functional analysis of cancer predisposition loci. J. Intern. Med., 274, 414–424. [DOI] [PMC free article] [PubMed] [Google Scholar]
- 6. Consortium E.P. (2012) An integrated encyclopedia of DNA elements in the human genome. Nature, 489, 57–74. [DOI] [PMC free article] [PubMed] [Google Scholar]
- 7. Petersen G.M., Amundadottir L., Fuchs C.S., Kraft P., Stolzenberg-Solomon R.Z., Jacobs K.B., Arslan A.A., Bueno-de-Mesquita H.B., Gallinger S., Gross M., et al. (2010) A genome-wide association study identifies pancreatic cancer susceptibility loci on chromosomes 13q22.1, 1q32.1 and 5p15.33. Nat. Genet., 42, 224–228. [DOI] [PMC free article] [PubMed] [Google Scholar]
- 8. Wolpin B.M., Rizzato C., Kraft P., Kooperberg C., Petersen G.M., Wang Z., Arslan A.A., Beane-Freeman L., Bracci P.M., Buring J., et al. (2014) Genome-wide association study identifies multiple susceptibility loci for pancreatic cancer. Nat. Genet., 46, 994–1000. [DOI] [PMC free article] [PubMed] [Google Scholar]
- 9. Amundadottir L., Kraft P., Stolzenberg-Solomon R.Z., Fuchs C.S., Petersen G.M., Arslan A.A., Bueno-de-Mesquita H.B., Gross M., Helzlsouer K., Jacobs E.J., et al. (2009) Genome-wide association study identifies variants in the ABO locus associated with susceptibility to pancreatic cancer. Nat. Genet., 41, 986–990. [DOI] [PMC free article] [PubMed] [Google Scholar]
- 10. Genomes Project, C., Abecasis G.R., Altshuler D., Auton A., Brooks L.D., Durbin R.M., Gibbs R.A., Hurles M.E., McVean G.A. (2010) A map of human genome variation from population-scale sequencing. Nature, 467, 1061–1073. [DOI] [PMC free article] [PubMed] [Google Scholar]
- 11. Wang Z., Jacobs K.B., Yeager M., Hutchinson A., Sampson J., Chatterjee N., Albanes D., Berndt S.I., Chung C.C., Diver W.R., et al. (2012) Improved imputation of common and uncommon SNPs with a new reference set. Nat. Genet., 44, 6–7. [DOI] [PMC free article] [PubMed] [Google Scholar]
- 12. Consortium, G.T. (2015) Human genomics. The Genotype-Tissue Expression (GTEx) pilot analysis: multitissue gene regulation in humans. Science, 348, 648–660. [DOI] [PMC free article] [PubMed] [Google Scholar]
- 13. Cadigan K.M., Waterman M.L. (2012) TCF/LEFs and Wnt signaling in the nucleus. Cold Spring Harb. Perspect. Biol., 4 [DOI] [PMC free article] [PubMed] [Google Scholar]
- 14. Wu H., Sun L., Wen Y., Liu Y., Yu J., Mao F., Wang Y., Tong C., Guo X., Hu Z., et al. (2016) Major spliceosome defects cause male infertility and are associated with nonobstructive azoospermia in humans. Proc. Natl Acad. Sci. U S A, 113, 4134–4139. [DOI] [PMC free article] [PubMed] [Google Scholar]
- 15. Walker B.A., Wardell C.P., Melchor L., Hulkki S., Potter N.E., Johnson D.C., Fenwick K., Kozarewa I., Gonzalez D., Lord C.J., et al. (2012) Intraclonal heterogeneity and distinct molecular mechanisms characterize the development of t(4;14) and t(11;14) myeloma. Blood, 120, 1077–1086. [DOI] [PubMed] [Google Scholar]
- 16. Weissbach S., Langer C., Puppe B., Nedeva T., Bach E., Kull M., Bargou R., Einsele H., Rosenwald A., Knop S., et al. (2015) The molecular spectrum and clinical impact of DIS3 mutations in multiple myeloma. Br. J. Haematol., 169, 57–70. [DOI] [PubMed] [Google Scholar]
- 17. Ding L., Ley T.J., Larson D.E., Miller C.A., Koboldt D.C., Welch J.S., Ritchey J.K., Young M.A., Lamprecht T., McLellan M.D., et al. (2012) Clonal evolution in relapsed acute myeloid leukaemia revealed by whole-genome sequencing. Nature, 481, 506–510. [DOI] [PMC free article] [PubMed] [Google Scholar]
- 18. Rozenblum E., Vahteristo P., Sandberg T., Bergthorsson J.T., Syrjakoski K., Weaver D., Haraldsson K., Johannsdottir H.K., Vehmanen P., Nigam S., et al. (2002) A genomic map of a 6-Mb region at 13q21-q22 implicated in cancer development: identification and characterization of candidate genes. Hum. Genet., 110, 111–121. [DOI] [PubMed] [Google Scholar]
- 19. Rose A.E., Poliseno L., Wang J., Clark M., Pearlman A., Wang G., Vega YSdMEC., Medicherla R., Christos P.J., Shapiro R., et al. (2011) Integrative genomics identifies molecular alterations that challenge the linear model of melanoma progression. Cancer Res., 71, 2561–2571. [DOI] [PMC free article] [PubMed] [Google Scholar]
- 20. Lohr J.G., Stojanov P., Carter S.L., Cruz-Gordillo P., Lawrence M.S., Auclair D., Sougnez C., Knoechel B., Gould J., Saksena G., et al. (2014) Widespread genetic heterogeneity in multiple myeloma: implications for targeted therapy. Cancer Cell, 25, 91–101. [DOI] [PMC free article] [PubMed] [Google Scholar]
- 21. Lionetti M., Barbieri M., Todoerti K., Agnelli L., Fabris S., Tonon G., Segalla S., Cifola I., Pinatel E., Tassone P., et al. (2015) A compendium of DIS3 mutations and associated transcriptional signatures in plasma cell dyscrasias. Oncotarget, 6, 26129–26141. [DOI] [PMC free article] [PubMed] [Google Scholar]
- 22. Tomecki R., Drazkowska K., Kucinski I., Stodus K., Szczesny R.J., Gruchota J., Owczarek E.P., Kalisiak K., Dziembowski A. (2014) Multiple myeloma-associated hDIS3 mutations cause perturbations in cellular RNA metabolism and suggest hDIS3 PIN domain as a potential drug target. Nucleic Acids Res., 42, 1270–1290. [DOI] [PMC free article] [PubMed] [Google Scholar]
- 23. Houseley J., LaCava J., Tollervey D. (2006) RNA-quality control by the exosome. Nat. Rev. Mol. Cell Biol., 7, 529–539. [DOI] [PubMed] [Google Scholar]
- 24. Schneider C., Kudla G., Wlotzka W., Tuck A., Tollervey D. (2012) Transcriptome-wide analysis of exosome targets. Mol. Cell, 48, 422–433. [DOI] [PMC free article] [PubMed] [Google Scholar]
- 25. Tomecki R., Kristiansen M.S., Lykke-Andersen S., Chlebowski A., Larsen K.M., Szczesny R.J., Drazkowska K., Pastula A., Andersen J.S., Stepien P.P., et al. (2010) The human core exosome interacts with differentially localized processive RNases: hDIS3 and hDIS3L. EMBO J., 29, 2342–2357. [DOI] [PMC free article] [PubMed] [Google Scholar]
- 26. Lykke-Andersen S., Tomecki R., Jensen T.H., Dziembowski A. (2011) The eukaryotic RNA exosome: same scaffold but variable catalytic subunits. RNA Biol., 8, 61–66. [DOI] [PubMed] [Google Scholar]
- 27. Kiss D.L., Hou D., Gross R.H., Andrulis E.D. (2012) Dis3- and exosome subunit-responsive 3' mRNA instability elements. Biochem. Biophys. Res. Commun., 423, 461–466. [DOI] [PMC free article] [PubMed] [Google Scholar]
- 28. Kinoshita N., Goebl M., Yanagida M. (1991) The fission yeast dis3+ gene encodes a 110-kDa essential protein implicated in mitotic control. Mol. Cell. Biol., 11, 5839–5847. [DOI] [PMC free article] [PubMed] [Google Scholar]
- 29. Murakami H., Goto D.B., Toda T., Chen E.S., Grewal S.I., Martienssen R.A., Yanagida M. (2007) Ribonuclease activity of Dis3 is required for mitotic progression and provides a possible link between heterochromatin and kinetochore function. PloS One, 2, e317.. [DOI] [PMC free article] [PubMed] [Google Scholar]
- 30. Smith S.B., Kiss D.L., Turk E., Tartakoff A.M., Andrulis E.D. (2011) Pronounced and extensive microtubule defects in a Saccharomyces cerevisiae DIS3 mutant. Yeast, 28, 755–769. [DOI] [PMC free article] [PubMed] [Google Scholar]
- 31. Hou D., Ruiz M., Andrulis E.D. (2012) The ribonuclease Dis3 is an essential regulator of the developmental transcriptome. BMC Genomics, 13, 359.. [DOI] [PMC free article] [PubMed] [Google Scholar]
- 32. Januszyk K., Lima C.D. (2010) Structural components and architectures of RNA exosomes. Adv. Exp. Med. Biol., 702, 9–28. [PMC free article] [PubMed] [Google Scholar]
- 33. Malecki M., Viegas S.C., Carneiro T., Golik P., Dressaire C., Ferreira M.G., Arraiano C.M. (2013) The exoribonuclease Dis3L2 defines a novel eukaryotic RNA degradation pathway. EMBO J., 32, 1842–1854. [DOI] [PMC free article] [PubMed] [Google Scholar]
- 34. Lubas M., Damgaard C.K., Tomecki R., Cysewski D., Jensen T.H., Dziembowski A. (2013) Exonuclease hDIS3L2 specifies an exosome-independent 3'-5' degradation pathway of human cytoplasmic mRNA. EMBO J., 32, 1855–1868. [DOI] [PMC free article] [PubMed] [Google Scholar]
- 35. Astuti D., Morris M.R., Cooper W.N., Staals R.H., Wake N.C., Fews G.A., Gill H., Gentle D., Shuib S., Ricketts C.J., et al. (2012) Germline mutations in DIS3L2 cause the Perlman syndrome of overgrowth and Wilms tumor susceptibility. Nat. Genet., 44, 277–284. [DOI] [PubMed] [Google Scholar]
- 36. Szekeres-Bartho J., Polgar B. (2010) PIBF: the double edged sword. Pregnancy and tumor. Am. J. Reprod. Immunol., 64, 77–86. [DOI] [PubMed] [Google Scholar]
- 37. Amundadottir L.T., Sulem P., Gudmundsson J., Helgason A., Baker A., Agnarsson B.A., Sigurdsson A., Benediktsdottir K.R., Cazier J.B., Sainz J., et al. (2006) A common variant associated with prostate cancer in European and African populations. Nat. Genet., 38, 652–658. [DOI] [PubMed] [Google Scholar]
- 38. Freedman M.L., Haiman C.A., Patterson N., McDonald G.J., Tandon A., Waliszewska A., Penney K., Steen R.G., Ardlie K., John E.M., et al. (2006) Admixture mapping identifies 8q24 as a prostate cancer risk locus in African-American men. Proc. Natl Acad. Sci. U S A, 103, 14068–14073. [DOI] [PMC free article] [PubMed] [Google Scholar]
- 39. Chung C.C., Chanock S.J. (2011) Current status of genome-wide association studies in cancer. Hum. Genet., 130, 59–78. [DOI] [PubMed] [Google Scholar]
- 40. Ahmadiyeh N., Pomerantz M.M., Grisanzio C., Herman P., Jia L., Almendro V., He H.H., Brown M., Liu X.S., Davis M., et al. (2010) 8q24 prostate, breast, and colon cancer risk loci show tissue-specific long-range interaction with MYC. Proc. Natl Acad. Sci. U S A, 107, 9742–9746. [DOI] [PMC free article] [PubMed] [Google Scholar]
- 41. Pomerantz M.M., Ahmadiyeh N., Jia L., Herman P., Verzi M.P., Doddapaneni H., Beckwith C.A., Chan J.A., Hills A., Davis M., et al. (2009) The 8q24 cancer risk variant rs6983267 shows long-range interaction with MYC in colorectal cancer. Nat. Genet., 41, 882–884. [DOI] [PMC free article] [PubMed] [Google Scholar]
- 42. Meyer K.B., Maia A.T., O'Reilly M., Ghoussaini M., Prathalingam R., Porter-Gill P., Ambs S., Prokunina-Olsson L., Carroll J., Ponder B.A. (2011) A functional variant at a prostate cancer predisposition locus at 8q24 is associated with PVT1 expression. PLoS Genet., 7, e1002165.. [DOI] [PMC free article] [PubMed] [Google Scholar]
- 43. French J.D., Ghoussaini M., Edwards S.L., Meyer K.B., Michailidou K., Ahmed S., Khan S., Maranian M.J., O'Reilly M., Hillman K.M., et al. (2013) Functional variants at the 11q13 risk locus for breast cancer regulate cyclin D1 expression through long-range enhancers. Am. J. Hum. Genet., 92, 489–503. [DOI] [PMC free article] [PubMed] [Google Scholar]
- 44. Schodel J., Bardella C., Sciesielski L.K., Brown J.M., Pugh C.W., Buckle V., Tomlinson I.P., Ratcliffe P.J., Mole D.R. (2012) Common genetic variants at the 11q13.3 renal cancer susceptibility locus influence binding of HIF to an enhancer of cyclin D1 expression. Nat. Genet., 44, 420–425. S421-422. [DOI] [PMC free article] [PubMed] [Google Scholar]
- 45. Cheng T.H., Thompson D.J., O'Mara T.A., Painter J.N., Glubb D.M., Flach S., Lewis A., French J.D., Freeman-Mills L., Church D., et al. (2016) Five endometrial cancer risk loci identified through genome-wide association analysis. Nat. Genet., 48, 667–674. [DOI] [PMC free article] [PubMed] [Google Scholar]
- 46. Takata R., Akamatsu S., Kubo M., Takahashi A., Hosono N., Kawaguchi T., Tsunoda T., Inazawa J., Kamatani N., Ogawa O., et al. (2010) Genome-wide association study identifies five new susceptibility loci for prostate cancer in the Japanese population. Nat. Genet., 42, 751–754. [DOI] [PubMed] [Google Scholar]
- 47. Marchini J., Howie B., Myers S., McVean G., Donnelly P. (2007) A new multipoint method for genome-wide association studies by imputation of genotypes. Nat. Genet., 39, 906–913. [DOI] [PubMed] [Google Scholar]
- 48. Wang Z., Zhu B., Zhang M., Parikh H., Jia J., Chung C.C., Sampson J.N., Hoskins J.W., Hutchinson A., Burdette L. (2014) Imputation and subset based association analysis across different cancer types identifies multiple independent risk loci in the TERT-CLPTM1L region on chromosome 5p15.33. Hum. Mol.Genet., 23, 6616–6633. [DOI] [PMC free article] [PubMed] [Google Scholar]
- 49. Spencer A.V., Cox A., Walters K. (2014) Comparing the efficacy of SNP filtering methods for identifying a single causal SNP in a known association region. Ann. Hum. Genet., 78, 50–61. [DOI] [PMC free article] [PubMed] [Google Scholar]
- 50. Jia J., Parikh H., Xiao W., Hoskins J.W., Pflicke H., Liu X., Collins I., Zhou W., Wang Z., Powell J., et al. (2013) An integrated transcriptome and epigenome analysis identifies a novel candidate gene for pancreatic cancer. BMC Med. Genomics, 6, 33.. [DOI] [PMC free article] [PubMed] [Google Scholar]
- 51. Pfaffl M.W. (2001) A new mathematical model for relative quantification in real-time RT-PCR. Nucleic Acids Res., 29, e45.. [DOI] [PMC free article] [PubMed] [Google Scholar]
- 52. Grant A.G., Duke D., Hermon-Taylor J. (1979) Establishment and characterization of primary human pancreatic carcinoma in continuous cell culture and in nude mice. Br. J. Cancer, 39, 143–151. [DOI] [PMC free article] [PubMed] [Google Scholar]
- 53. Hagege H., Klous P., Braem C., Splinter E., Dekker J., Cathala G., de Laat W., Forne T. (2007) Quantitative analysis of chromosome conformation capture assays (3C-qPCR). Nat. Protoc., 2, 1722–1733. [DOI] [PubMed] [Google Scholar]
- 54. Miele A., Gheldof N., Tabuchi T.M., Dostie J., Dekker J. (2006) Mapping chromatin interactions by chromosome conformation capture. Curr. Protoc. Mol. Biol., Chapter 21, Unit 21 11. [DOI] [PubMed] [Google Scholar]
- 55. Cartharius K., Frech K., Grote K., Klocke B., Haltmeier M., Klingenhoff A., Frisch M., Bayerlein M., Werner T. (2005) MatInspector and beyond: promoter analysis based on transcription factor binding sites. Bioinformatics, 21, 2933–2942. [DOI] [PubMed] [Google Scholar]
Associated Data
This section collects any data citations, data availability statements, or supplementary materials included in this article.