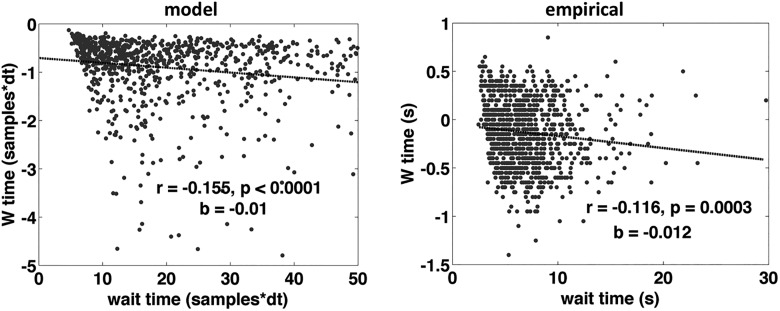
Figure 8.
‘W’ time as a function of waiting time aggregate. Correlation between waiting time and ‘W’ time for simulated data from the model (left) and for the empirical data from all subjects (right; each dot is one trial from one subject). Although there is noise in the model, the model data are bounded by zero at the top, because there is no noise in the estimation of ‘W’ time, it is strictly earlier than movement time and is “reported” exactly as is. In reality there is a lot of variance across trials and across subjects in the reporting of ‘W’ time, and this is evident in the panel on the right. Combining the data from all subjects can be problematic, because differences between subjects and differences within subject are confounded, so in Figure 9, I present the correlations separately for each subject.

