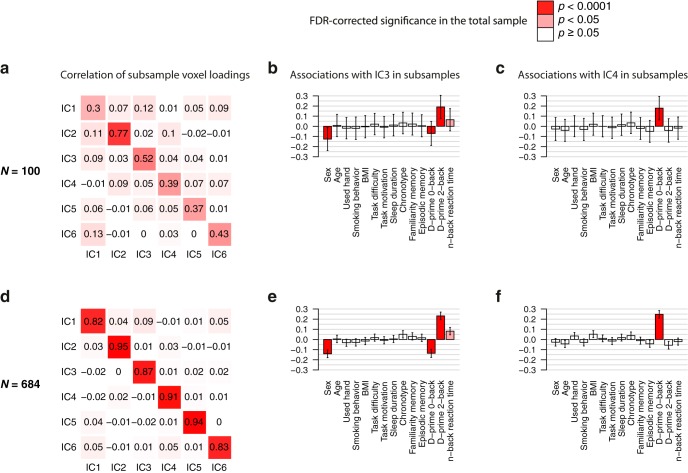
Figure 7.
WMN ICA decomposition bootstrapping results. Pearson’s correlation coefficients comparing the voxel loadings of ICA decompositions between two nonintersecting subsamples of sizes (A) N = 100 each and (D) N = 684 each (i.e., split-halves). Depicted are the averaged correlation coefficients across 100 runs. The associations of WMN-IC3 with task performances and covariates averaged across the 2 × 100 random subsamples are shown for (B) N = 100 (df = 85) and (E) N = 684 (df = 669). The associations of WMN-IC4 with task performances and covariates averaged across the 2 × 100 random subsamples are shown for (C) N = 100 (df = 85) and (F) N = 684 (df = 669). Bars represent the averaged regression coefficients; error bars denote the averaged standard errors of the regression coefficients; red colors in the bar plots describe the FDR-corrected significance of the corresponding WMN-IC’s association with the independent variables in the total sample (see top-right legend).

