

Abstract
Purpose
Imatinib dramatically reduces GIST 18F-FDG uptake, providing an early indicator of treatment response. Despite decreased glucose internalization, many GIST cells persist, suggesting that alternative metabolic pathways are used for survival. The role of mitochondria in imatinib-treated GIST is largely unknown.
Experimental Design
We quantified the metabolic activity of several human GIST cell lines. We treated human GIST xenografts and genetically engineered KitV558del/+ mice with the mitochondrial oxidative phosphorylation inhibitor VLX600 in combination with imatinib and analyzed tumor volume, weight, histology, molecular signaling, and cell cycle activity. In vitro assays on human GIST cell lines were also performed.
Results
Imatinib therapy decreased glucose uptake and downstream glycolytic activity in GIST-T1 and HG129 cells by approximately half and upregulated mitochondrial enzymes and improved mitochondrial respiratory capacity. Mitochondrial inhibition with VLX600 had a direct antitumor effect in vitro while appearing to promote glycolysis through increased AKT signaling and glucose transporter expression. When combined with imatinib, VLX600 prevented imatinib-induced cell cycle escape and reduced p27 expression, leading to increased apoptosis when compared to imatinib alone. In KitV558del/+ mice, VLX600 alone did not induce tumor cell death, but had a profound antitumor effect when combined with imatinib.
Conclusions
Our findings show that imatinib alters the metabolic phenotype of GIST and this may contribute to imatinib resistance. Our work offers preclinical proof of concept of metabolic targeting as an effective strategy for the treatment of GIST.
Keywords: gastrointestinal stromal tumor, mitochondria, metabolism, VLX600
Introduction
Gastrointestinal stromal tumor (GIST) is the most common sarcoma,1 often arising from an oncogenic mutation in the KIT receptor tyrosine kinase (RTK).2 While imatinib has revolutionized the treatment of GIST through targeted KIT inhibition,3 resistance and disease progression often develop within 2 years.4,5 The emergence of secondary KIT mutations and the activation of alternative oncogenic RTKs have been identified in the majority of resistant tumors.6–9 Promising second and third line therapies have only provided minimal benefit,10,11 highlighting the need for novel therapeutic approaches.
Otto Warburg originally hypothesized that cancer is characterized by dysfunctional mitochondria, observing that even in the presence of oxygen, cancer cells exclusively use glucose to produce lactate.12–15 It was later discovered that cancer cells preferentially use glucose because it provides a unique growth advantage by more rapidly generating one-carbon intermediates, fatty acids, cholesterol, and nucleotides for DNA synthesis and cell division.16,17 Studies in K-Ras driven lung cancer and murine melanoma also established an integral role of cancer cell mitochondria in tumor initiation and growth,18,19 ultimately disproving Warburg’s original hypothesis. Nevertheless, the Warburg effect of cancer cells preferentially utilizing glucose in the presence of oxygen defined the cancer metabolic phenotype and led to 18F-fluorodeoxyglucose (FDG) positron emission tomography (PET) scanning as a reliable modality for tumor imaging.
GIST demonstrates intense metabolic activity and avid glucose uptake on 18F-FDG PET scanning.20 While imatinib-related changes in tumor volume can take months to occur,21 decreased glucose uptake on 18F-FDG-PET scan can be seen within 24h of imatinib initiation.22 Prospective studies have correlated an early metabolic response on 18F-FDG-PET scanning with improved progression-free survival, validating the relevance of this cancer metabolic phenotype.20,21,23 Interestingly, imatinib-induced decreases in glucose uptake coincide with the emergence of a quiescent cell phenotype characterized by reversible exit from the cell division cycle.24 While the cell-cycle regulating DREAM complex and the anaphase promoting complex (APC)-p27Kip1 signaling axis are known to be mediators of imatinib-induced quiescence,24,25 reliance on mitochondrial function for energy is also a property of quiescent tumor cells26 and may represent another mechanism of imatinib resistance in GIST.
The effect of imatinib on GIST mitochondrial dynamics is largely unknown. Since imatinib treatment dramatically reduces glucose uptake and promotes tumor cell quiescence in GIST, we hypothesized that alterations in mitochondrial metabolism associated with tumor cell dormancy contribute to imatinib resistance. Herein, we investigate the role of mitochondrial bioenergetics in GIST and show that imatinib treatment shifts the metabolic phenotype of GIST from glycolysis to oxidative phosphorylation (OxPhos). Furthermore, inducing mitochondrial dysfunction in the presence of imatinib with a mitochondrial OxPhos inhibitor increased tumor cell dependence on glycolysis, enhancing the apoptotic and anti-glycolytic effects of imatinib in vitro and in vivo.
Materials and Methods
Mice and treatments
Age and sex-matched KitV558del/+ mice27 and NOD.Cg-Prkdcscid Il2rgtm1Wjl/SzJ (NSG) mice (The Jackson Laboratory) were used. Our Institutional Animal Care and Use Committee approved all procedures and treatments. For xenograft experiments, 106 GIST-T1 cells in PBS were mixed 1:1 with BD Matrigel Matrix Growth Factor Reduced (BD Biosciences) and injected subcutaneously into the right flanks of NSG mice. Xenograft tumor volume was measured using the modified ellipsoid formula of 0.5 × length × width × width, and treatments were started when mean tumor volume reached approximately 100 mm3. Imatinib (600mg/L in drinking water) was provided by Novartis and VLX600 (4.5mg/kg dissolved in 4.23mM HCl and diluted with 0.9% NaCl, administered intravenously) was purchased from EMD Millipore. Control mice received regular drinking water and vehicle 4.23mM HCl in 0.9% NaCl intravenously.
Cell lines and cell viability assay
The human GIST-T1 cell line (KIT exon 11, provided by Dr. Takahiro Taguchi, Kochi Medical School),28 the human HG129 cell line (KIT exon 11, which we established in 2012),8 and the human GIST-882 cell line (KIT exon 13, kindly provided by Dr. Jonathan Fletcher, Brigham and Woman’s Hospital) have been described previously.29 Kit expression and mutation status was confirmed in all cell lines by Western blot and sequencing. Mycoplasma testing was performed in GIST-T1 and HG129 cell lines prior to use, most recently in 2015. Experiments were performed within two months of thawing early passage cells. Cells were cultured in complete medium containing RPMI-1640 with 10% fetal bovine serum, 2g/L glucose, 2mmol/L L-glutamine, 50Y/mL penicillin-streptomycin, and 10mmol/L HEPES. To measure cell viability, 104 GIST-T1, GIST-882, and HG129 cells were seeded in replicates of 5 in a 96-well flat-bottomed plate (Falcon) and cultured for 48–72h with imatinib, VLX600, or H20- and/or DMSO-only solvent controls. Viability was measured using a colorimetric tetrazolium salt assay (Cell Counting Kit-8, Dojindo Molecular Technologies) per the manufacturer’s instructions and values were normalized to control. For low glucose cell viability assays, identical media was used except the glucose concentration was 0.25g/L.
Glucose consumption and lactate production measurements
Glucose uptake and lactate production of live cells was measured enzymatically using a YSI 7100 enzymatic analyzer (Life Sciences). Cells were plated in 6-well plates and allowed to achieve 80–90% confluency. Cells were then exposed to drugs for 12h after seeding. At the end of the assay, media was collected and kept at −20C prior to measurement. Metabolite concentrations were normalized to cell number.
Real-time metabolic analyses
Metabolic analysis of live cells was performed using the Seahorse XFe96 extracellular flux analyzer (Seahorse Bioscience, USA). Cells were seeded in XF96 well plates (20,000–50,000 cells per well) and incubated overnight at 37°C in 5% CO2. Cells were then exposed to drugs of interest for 24h prior to the assay, unless otherwise indicated. For Mito Stress and Fuel tests, cell culture medium was replaced 1h before the assay with minimal DMEM without phenol red supplemented with 1mM sodium pyruvate, 10mM glucose, and 2mM glutamine. Oxygen consumption rate (OCR) was analyzed at basal conditions and after sequential injections of oligomycin (1μM), FCCP (2μM), and antimycin/rotenone (0.5μM). For analysis of mitochondrial fuel oxidation pathways, a Mito Fuel Flex test (Seahorse Bioscience, USA) was performed according to the manufacturer’s instructions at the recommended drug concentrations and the Seahorse XF Mito Fuel Report Generator was utilized to produce results. For Glycolysis Stress tests and Glycolytic Rate assays, cell culture medium was replaced 1h before the assay with minimal DMEM without phenol red supplemented with 2mM glutamine or minimal DMEM without phenol red supplemented with 1mM sodium pyruvate, 10mM glucose, 2mM glutamine, and 5.0mM HEPES, respectively. Extracellular Acidification Rate (ECAR) was measured under basal conditions and after sequential injections of glucose (10mM), oligomycin (1μM) and 2-deoxyglucose (100mM). For characterization of glycolytic rate, a Glycolytic Rate assay (Seahorse Biosciences, USA) was performed according to the manufacturer’s instructions and the Seahorse XF Glycolytic Rate Assay Report Generator was utilized to calculate Proton Efflux Rate. All metabolic assays were normalized to cell number or total protein content as previously described by Bradford assay. Relative changes in maximum mitochondrial respiration and spare respiratory capacity were calculated by normalizing to basal OCR when indicated.
Bioinformatics
RNA sequencing of vehicle and imatinib treated KitV558del/+ mouse tumors was performed by our Integrated Genomics Core facility and normalized using the software package DESeq. The expression data for genes involved in the following metabolic pathways (glycolysis, pyruvate metabolism, and oxidative phosphorylation) were visualized with heatmap.2 (www.cran.r-project.org).
Western blot
Protein from flash frozen GIST tissue or cell lines was analyzed as before,30 with the exception of mitochondrial OxPhos protein, which was not boiled and transferred to a PVDF membrane as recommended by Abcam. Antibodies used against glyceraldehyde-3-phosphate dehydrogenase (GAPDH; Clone D16H11), p-Kit (y719), KIT (D13A2), p-AKT (S473), AKT (11E7), p-ERK (T202/Y204), ERK (ERK1/2), GLUT-1 (D3T3A), and β-actin (13E5) were purchased from Cell Signaling Technologies. Antibody to p27 (57/Kip1/p27) was purchased from BD Biosciences. Antibody cocktail to mitochondrial OxPhos proteins (ab110413) was purchased from Abcam with rat heart mitochondria used as a positive control (Abcam).
Quantitative real-time PCR
Total RNA was extracted from KitV558del/+ mouse bulk tumor, reverse transcribed, and amplified with PCR TaqMan probes for mouse Hif1a (Mm00468869_m1), COX I (Mm04225243_g1), COX II (Mm03294838_g1), COXIVi1 (Mm01250094_m1), and TFAM (Mm00447485_m1). Quantitative PCR was performed using a ViiATM7 real-time PCR system (Applied Biosystems). Data were calculated by the 2−ΔΔCt method as described by the manufacturer’s protocol and were expressed as fold increase over the indicated controls.
Flow cytometry
Flow cytometric analysis was performed on KitV558del/+ mouse tumors as before.8 All cells were analyzed on a BD LSR Fortessa (BD Biosciences). Mouse specific antibodies for CD45 (Clone: 30F11), F480 (BM8), and CD4 (RM4–5) were obtained from Biolegend. Mouse specific antibodies for CD11b (M1–70), Ly6G (1A8), Ly6C (AL-21), CD3 (17A2), NK1.1 (PK136) and Kit (2B8) were obtained from BD Biosciences. Mouse antibodies for MHCII (M5/114.15.12), CD8 (53.6.7), and FoxP3 (FJK-16S) were obtained from eBioscience. Intracellular Ki-67 staining of live cells was performed using an eBioscience Fixation and Permeabilization Buffer kit, Zombie Aqua fixable viability dye (Biolegend), and human antibody to Ki-67 (Ki-67) or isotype (MOPC-21). For ROS staining, CellROX Green Flow Cytometry Assay Kit was purchased from Thermo-Fisher Scientific and utilized per the manufacturer’s instructions. For Annexin V staining, an Annexin V staining kit was purchased from BD Biosciences and used as instructed. For cell cycle analysis, cells were treated in 6-well plates for 24h and fixed in 70% ethanol, digested in 0.1mg/mL RNase A, and stained with propidium iodide. G0/G1, S, and G2/M phases were calculated by Watson Pragmatic using FlowJo software (FlowJo, LLC).
Histology
Tumors were fixed in 4% paraformaldehyde, embedded in paraffin, and cut into 5-μm sections. Hematoxylin and eosin (H&E) was performed using standard methods. p27-Kip1 (Clone K25020) and Ki67 (Vector Laboratories) staining was performed by our institutional Molecular Cytology Core. Slides were scanned with MIRAX scan (Zeiss) and analyzed with Pannoramic Viewer.
Statistical Analysis
Data were analyzed using Prism 6.0 (GraphPad Software). An unpaired two-tailed Student t-test was performed when applicable. Data were considered significant when p<0.05.
Results
Imatinib decreases glucose uptake and the glycolytic capacity of GIST cell lines
Using a genetically engineered KitV558del/+ mouse model in which a single intestinal GIST develops,27 we previously showed that 1 week of imatinib dramatically reduced tumor glucose uptake by 18F-FDG PET.31 It has also been shown that imatinib impaired the recruitment of glucose transporters to the GIST cell surface leading to decreased 18F-FDG uptake in vitro.32,33 In order to quantify the metabolic changes, we treated GIST-T1, HG129, and GIST-882 cell lines with various doses of imatinib below their respective IC50’s of 50nM, 50nM, and 100nM, and enzymatically measured glucose consumption and lactate production of live cells. After 12h of 40nM imatinib, glucose uptake decreased by about half in both GIST-T1 and HG129 cells (Figure 1A–B). At baseline, GIST-882 cells consumed very little glucose, which was unchanged with imatinib (Figure 1C). Similarly, 12h of 40nM imatinib treatment significantly decreased lactate production by 53% in GIST-T1 and 61% in HG129 cells (Figure 1A–B), while lactate production in GIST-882 cells was reduced but minimal at baseline (Figure 1C).
Figure 1. Imatinib decreases glucose uptake and the glycolytic capacity of GIST cell lines.
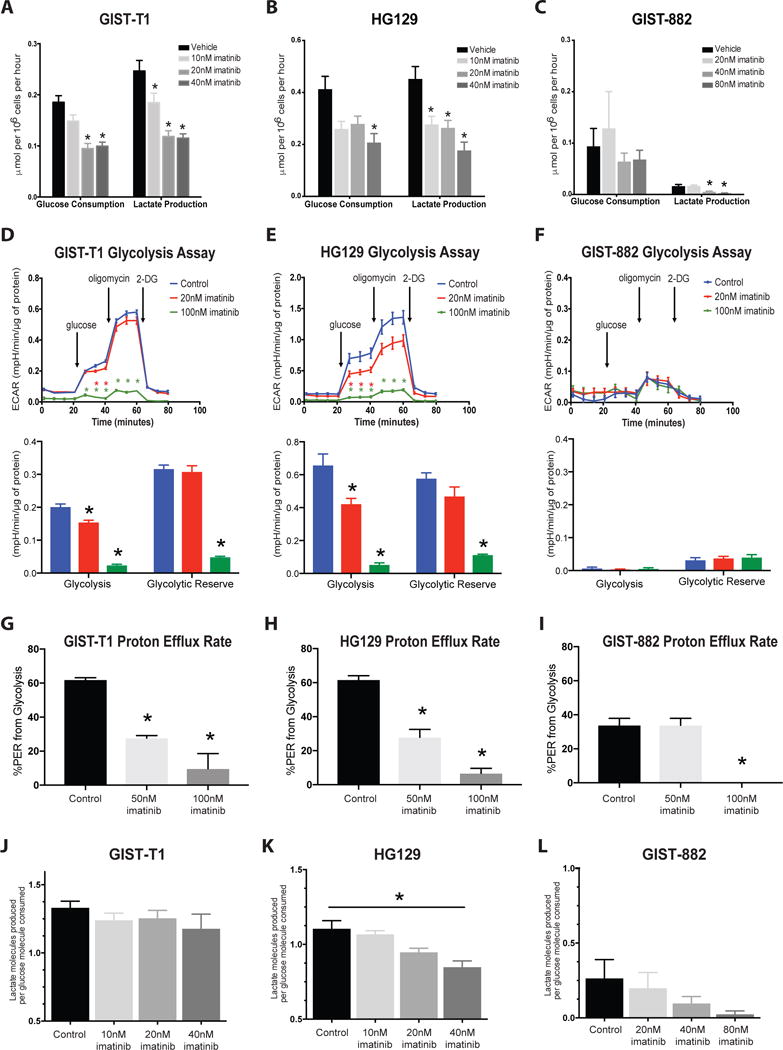
Supernatants from (A) GIST-T1, (B) HG129, and (C) GIST-882 cells treated with imatinib for 12h were collected and analyzed for glucose consumption and lactate production using the YSI 7100 enzymatic analyzer. Analyte concentrations were normalized to cell number. n=3–4 wells per group. The real-time glycolytic bioenergetics of (D) GIST-T1, (E) HG129, and (F) GIST-882 cell lines were obtained with a Glycolysis Stress Test (Seahorse XF96). Glycolysis (bottom) was calculated as the difference between glucose-mediated glycolysis and baseline ECAR, while glycolytic reserve was calculated as the difference between oligomycin-enhanced and glucose-induced ECAR values. ECAR was normalized to total protein content per well by Bradford assay. n=4–6 wells per group. Proton Efflux Rate from glycolysis of control and imatinib-treated (G) GIST-T1, (H) HG129, and (I) GIST-882 cell lines as measured by Glycolytic Rate Assay (Seahorse Bioscience). n=5–6 wells per group. Lactate production per glucose molecule consumed for (J) GIST-T1, (K) HG129, and (L) GIST-882 was calculated as the ratio of the change in supernatant lactate to the change in supernatant glucose in imatinib-treated cells when compared to control cells, by YSI 7100 analysis. *p<0.05 compared to control. Bars, mean ± SEM.
To further define the metabolic impact of the imatinib-induced reduction in glucose uptake by tumor cells, we performed a glycolysis stress test using a Seahorse extracellular flux analyzer, which can measure glycolysis as a function of extracellular acidification rate (ECAR). Analysis of the rapidly growing GIST-T1 and HG129 cell lines showed that glycolysis was reduced in live cells by 70% and 79% within 24h of 100nM imatinib treatment, respectively, while glycolytic reserve was decreased by 85% and 80% (Figure 1D–E). Conversely, slowly growing GIST-882 cells had a low glycolytic activity and glycolytic reserve at baseline (Figure 1F). Since it has recently been criticized that Seahorse glycolysis stress tests may include non-glycolytic sources of media acidification in glycolysis measurement, we also performed a glycolytic rate assay, which accounts for mitochondrial sources of acidification and directly measures glycolysis as a proton efflux rate. Analysis of GIST-T1 and HG129 cell lines showed that 60% of proton efflux was attributed to glycolysis, which decreased significantly with imatinib therapy (Figure 1G–H). In GIST-882, only 30% of proton efflux was attributed to glycolysis, which was significantly reduced with higher concentrations of imatinib (Figure 1I). Together, these data confirm that GIST-882 is the least glycolytic and imatinib treatment significantly reduced glycolytic activity in all three human GIST cell lines.
Purely glycolytic metabolism results in 2 lactate molecules produced per glucose molecule consumed. Interestingly, baseline lactate production per glucose molecule was less than 2 in all three GIST cell lines (Figure 1J–K), indicating utilization of lactate by tumor cell mitochondria.34 In HG129 cells, lactate production per glucose molecule decreased significantly with 40nM imatinib (Figure 1K), supporting our findings that HG129 cells become non-glycolytic with imatinib therapy. However, the ratio of the number of lactate molecules produced per glucose molecule consumed during imatinib treatment did not significantly change in GIST-T1 or GIST-882 cells (Figure 1J, Figure 1L), despite an overall decrease in glucose consumption and lactate production (Figure 1A–C), indicating maintenance of mitochondrial function in these imatinib-treated tumor cells. Thus, imatinib treatment decreases lactate production but mitochondrial lactate utilization remains consistent in GIST-T1 and GIST-882 cell lines.
Imatinib therapy is associated with alterations in mitochondrial dynamics
We sought to identify the impact of imatinib treatment on mitochondrial dynamics. We discovered that prolonged imatinib treatment increased the expression of key mitochondrial enzymes in our KitV558del/+ mouse model of GIST. After 3 weeks of treatment with imatinib, RNA sequencing of bulk tumor revealed that the relative RNA expression of enzymes associated with glycolysis was coordinately downregulated while mitochondrial enzymes associated with the tricarboxylic acid cycle (TCA) were coordinately upregulated (Figure 2A). Similarly, the RNA expression levels of key mitochondrial electron transport chain enzymes detected by quantitative real-time PCR, including cytochrome c oxidase (Cox) 1, 2, and 4, and mitochondrial transcription factor A (Tfam), were significantly upregulated within 2 weeks of imatinib treatment in our mouse model, while Cox 1, 2, and 4 protein expression in the GIST-T1 cell line were higher within 24h of 100nM imatinib treatment (Figure 2B).
Figure 2. Imatinib therapy is associated with alterations in mitochondrial dynamics.

(A) Supervised clustering of the relative mRNA expression of key glycolytic and mitochondrial enzymes in 3 week imatinib and vehicle-treated KitV558del/+ murine tumors by bulk tumor RNA sequencing. (B) Quantitative RT-PCR (left) of Cox I, Cox II, Cox IV, and mitochondrial transcription factor A (TFAM) mRNA expression after 2 weeks of imatinib treatment in KitV558del/+ tumors and Cox I, II, and IV protein expression (right) in GIST-T1 cells after 24h imatinib treatment. (C) The real-time mitochondrial bioenergetics of GIST-T1 (left), HG129 (middle), and GIST-882 (right) after pretreatment with imatinib for 24h as measured by the MitoStress Test (Seahorse XF96 technology). Relative changes in spare respiratory capacity were calculated as the difference between maximal and basal respiration. n=4–6 wells per group. (D) Maximum respiratory capacity of GIST-T1, HG129, and GIST-882 cells after imatinib treatment is defined by the increase in OCR after the addition of FCCP. Data shown as a percentage of basal OCR. (E) Mito Fuel Flex test of GIST-T1 cells showing dependence on and capacity for the oxidation of glucose, glutamine, or fatty acids before and after imatinib treatment. Capacity is calculated as flexibility plus dependency. n=5–6 wells per group. (F, lower right gates) ROS production in 2 week imatinib-treated and vehicle-treated KitV558del/+ mice. CD45−Kit+ tumor cells are shown using a CellROX green detection kit (Thermo Fisher Scientific). Tert-butyl hydroperoxide solution (TBHP), a ROS inducer, is shown as a positive control, while TBHP-treated cells pre-treated with n-acetylcysteine (NAC, an antioxidant), are shown as a negative control. SYTOX red dead cell stain is used to show the proportion of dead cells (upper gates). *p<0.05 compared to control. Bars, mean ± SEM.
To determine the functional significance of these transcriptional changes, we performed a mitochondrial stress test using a Seahorse extracellular flux analyzer to measure mitochondrial bioenergetics. Mitochondrial spare respiratory capacity (SRC) and maximum respiratory capacity (MRC) are mediated by mitochondrial Cox 2 and have been shown to enhance cellular viability in stressful environments.35 After 24h of treatment, imatinib significantly increased the SRC of remaining GIST-T1 and HG129 cells by 63% and 50% respectively, while the SRC of the slowly growing GIST-882 cells remained unchanged (Figure 2C). Real-time metabolic analysis also showed that imatinib treated GIST-T1 and HG129 cells had a significantly higher MRC (Figure 2D).
Given an apparent enhancement of mitochondrial respiratory activity in the presence of imatinib-induced decreased glucose uptake, we performed additional assays to further characterize GIST mitochondrial activity. First, we performed a Seahorse mito fuel assay, which measures the mitochondria’s potential to oxidize three different mitochondrial fuels. Interestingly, imatinib treatment did not reduce GIST mitochondrial dependency or capacity to oxidize glucose (Figure 2E). Imatinib treatment, however, did enhance the capacity for mitochondrial glutamine and fatty acid oxidation while increasing overall dependency on fatty acids for energy (Figure 2E). We also observed that imatinib treatment decreased intracellular reactive oxygen species (ROS) in the remaining tumor cells (Figure 2F), and decreasing tumor cell ROS has been shown to reduce GIST proliferation and invasiveness.36 Importantly, ROS production by immune cells in imatinib-treated tumors remained unchanged (Supplemental Figure 1), indicating a tumor cell specific effect. Together, these data show that imatinib significantly altered the metabolic phenotype of GIST under stress to enhance mitochondrial capacity and promote cellular survival, supporting our hypothesis that imatinib induces a quiescent phenotype reliant on mitochondrial energy.26
Mitochondrial inhibition exerts an antiproliferative effect on human GIST cell lines and xenografts
Given our findings of increased mitochondrial capacity and function in cells surviving imatinib treatment, we sought to inhibit mitochondrial function as an adjunct to imatinib therapy. VLX600 is a mitochondrial OxPhos inhibitor shown to have an antitumor effect on quiescent HCT116 colon carcinoma tumor cells in vitro at a concentration of 6μM.37 Its primary mechanism was identified to be inhibition of Cox 1, 2 and 4 of the electron transport chain. Since imatinib treatment upregulated transcription and expression of Cox 1, 2, and 4 (Figure 2B), we hypothesized that treatment with VLX600 would synergize with imatinib treatment. In vitro, imatinib plus VLX600 at doses higher than 1μM decreased GIST-T1 cell viability when compared to imatinib or VLX600 alone (Figure 3A). Interestingly, VLX600 monotherapy was efficacious in multiple GIST cell lines in vitro (Figure 3B; Supplemental Figure 2), likely as a result of baseline mitochondrial utilization by cell lines (Figure 1J–L).
Figure 3. Mitochondrial inhibition exerts an antiproliferative effect on human GIST cell lines and xenografts.

(A) 48h cell viability assay of GIST-T1 cells treated with vehicle, VLX600, imatinib, or combination therapy at the indicated concentrations, shown as a percent viability of control. Horizontal red dotted line shows cell viability after imatinib treatment alone. n=4–5 wells per group. (B) 72h cell viability (top) and Ki67 expression (bottom) of GIST-T1 cells in the presence of VLX600. (C, left) OCR of GIST-T1 cells in the presence of VLX600, as determined by MitoStress test (Seahorse XF96). Relative change in Maximum Respiratory Capacity (right) is shown as a percentage of basal OCR. n=4–6 wells per group. (D) Real-time changes in oxygen consumption (top) and extracellular acidification rate (bottom) in GIST-T1 cells treated with vehicle, 50nM imatinib, 6μM VLX600, or combination therapy. 3e4 cells were plated per well, n=4–6 wells per group. (E) Tumor volumes and representative gross appearance of established GIST-T1 subcutaneous xenograft tumors in NSG mice treated for 14 days with 600mg/L imatinib in the drinking water, 4.5mg/kg VLX600 IV q3–4 days, or both. n=4–5 mice per group. (F) 10× magnification of H&E staining of GIST-T1 xenograft tumors after vehicle, imatinib, VLX600, or combination therapy. *p<0.05. Bars, mean ± SEM.
To better understand the effect of combination VLX600 and imatinib on mitochondrial function, we again performed a mitochondrial stress assay using the Seahorse extracellular flux analyzer. We primarily utilized the GIST-T1 cell line since metabolic analyses showed a significant glycolytic capacity with maintenance of mitochondrial function (Figure 1D, Figure 1J). As monotherapy, VLX600 immediately reduced the oxygen consumption rate (OCR) and the MRC of GIST-T1 cells via OxPhos inhibition (Figure 3C), which is opposite of the effect we observed with imatinib (Figure 2C–D). Similar to what has been previously reported, VLX600 did not reduce the mRNA or protein expression of Cox 2 and 4 with or without imatinib (data not shown).26 More importantly, however, moderate (50nM imatinib + 6μM VLX) and high dose (100nM imatinib + 12μM VLX) combination therapy significantly decreased functional mitochondrial OCR and ECAR within 12h of treatment (Figure 3D, Supplemental Figure 3A), while low dose combination therapy (50nM imatinib + 1μM VLX600) did not significantly alter mitochondrial OCR or ECAR (Supplemental Figure 3B). Thus, mitochondrial inhibition synergized with imatinib in vitro to decrease GIST viability and mitochondrial oxygen consumption via OxPhos inhibition.
Next, we performed xenograft experiments to explore the potential for mitochondrial inhibition in vivo. VLX600 treatment alone resulted in a significant decrease in GIST-T1 tumor volume compared to vehicle controls (Figure 3E), likely reflective of the utilization of mitochondria we observed in vitro. While there were occasional areas of necrosis in untreated xenograft tumors, particularly in large tumors, only combination therapy induced consistent histologic effects (Figure 3F). Importantly, we did not observe any significant hematologic abnormalities from VLX600 in our mouse models (Supplemental Figure 4), suggesting minimal systemic toxicity.
Mitochondrial inhibition reverses the phenotype of imatinib-treated cells
GIST is an excellent model of oncogene addiction since a single KIT mutation often drives tumor proliferation,38 and inactivation of that mutation is detrimental to tumor cell survival.38,39 Having shown that mitochondrial inhibition combined with imatinib significantly decreased tumor cell viability in vitro and induced histologic effects in vivo, we wanted to explore the effect of mitochondrial inhibition on the KIT signaling pathway. Surprisingly, VLX600 treatment affected multiple elements of Kit signaling. The PI3K/AKT pathway is downstream of KIT and has been shown to stimulate aerobic glycolysis and glucose uptake via glucose transporters.33,40 After 6h and 24h of VLX600 monotherapy in GIST-T1 cells, AKT signaling was increased while ERK signaling was decreased (Figure 4A, left). Furthermore, while GLUT1 expression was relatively low in GIST-T1 cells at baseline, treatment with VLX600 dramatically increased GLUT1 expression 6h and 24h after treatment. Notably, imatinib countered the increases in AKT and GLUT-1 while further decreasing ERK (Figure 4A).
Figure 4. Mitochondrial inhibition reverses the phenotype of imatinib treated cells.

(A) Western blot analysis of the Kit signaling pathway (left) and p27/GLUT1 protein expression (right) in control (ctrl), 6μM VLX600 treated (VLX), 100nM imatinib treated (im), or combination-treated (combo) GIST-T1 cells at 6h and 24h. (B) Cell proliferation (top) and cell viability assay (bottom) of GIST-T1 (left), HG129 (middle), and GIST-882 (right) as measured by OD450 in normal and low glucose media. n=4–5 wells per group. (C) Cell cycle histogram (top) and bar graph (bottom) of GIST-T1 (left), HG129 (middle), and GIST-882 (right) cells treated for 24h with the drugs indicated. G0/G1, S, and G2/M phases were calculated by Watson Pragmatic using FloJo software. (D) Representative flow plots of Annexin V staining (top) and bar graph showing percent increase in Annexin V positivity compared to control (bottom) after 24h treatment in GIST-T1 cells. *p<0.05, t test. Bars, mean ± SEM.
Together, these data support a previously identified AKT-dependent mechanism of glucose uptake33 and suggest that mitochondrial inhibition with VLX600 therapy may be associated with a shift towards glycolytic metabolism via AKT signaling in GIST-T1 in vitro. Despite what has been previously reported for VLX600,37 induction of glycolysis was noted to be independent of HIF1a upregulation in our mouse model (Supplemental Figure 5A). More recently, iron chelation was identified as another mechanism of VLX600.41 However, iron supplementation did not abrogate the cytotoxic effect of VLX600 in GIST-T1 cells (Supplemental Figure 5B), indicating that the primary mechanism for VLX600 in GIST is OxPhos inhibition.
We hypothesized that inducing glycolysis via OxPhos inhibition with VLX600 would make imatinib more effective in a low glucose environment, since glucose availability is limited. As expected, GIST-T1, HG129, and GIST-882 cells proliferated more slowly when cultured in low glucose media (Figure 4B, top). Remarkably, imatinib was less potent in all three human cell lines when cultured in low glucose media, but the addition of low dose VLX600 restored the potency of imatinib in GIST-T1 and HG129 (Figure 4B, bottom), suggesting that VLX600 improves imatinib’s efficacy on slowly proliferating cells. It is also well described that imatinib induces tumor cell quiescence by 2 mechanisms: the APC-p27Kip1 signaling axis and the cell-cycle regulating DREAM complex.24,25 Not surprisingly, we identified upregulation of p27Kip1 after 6 and 24h of imatinib treatment in vitro (Figure 4A, right). Combination therapy with VLX600, however, decreased p27 expression in vitro (Figure 4A, right). Together, these results support that imatinib is more effective on highly proliferating cells, and decreased proliferation through a low glucose environment or imatinib-induced quiescence renders GIST cells susceptible to mitochondrial inhibition.
Finally, cell cycle analysis showed that imatinib therapy induced cellular quiescence, as evidenced by a significant reduction of GIST-T1 and HG129 cells in S-phase after 24h of treatment. However, with combination therapy, this shift to quiescence was prevented (Figure 4C). Annexin V staining showed that combination therapy led to greater apoptosis than either treatment alone (Figure 4D). Together, these data suggested that imatinib-treated cells became quiescent to avoid imatinib-induced death, yet VLX600 prevented this escape by driving glycolysis and cell cycle progression, enhancing their susceptibility to imatinib.
Mitochondrial inhibition enhances the antitumor effects of imatinib in a murine model of GIST
Thus far, we have shown that an imatinib-induced decrease in glucose uptake reduced glycolytic activity and shifted GIST metabolism toward a quiescent and more energy efficient phenotype, while mitochondrial inhibition forced a return to a glycolytic phenotype. Given these findings, we hypothesized that VLX600 and imatinib have competing effects on tumor cell metabolism, and we sought to explore these effects in a germline murine model of GIST. We treated KitV558del/+ mice with VLX600 and imatinib (Figure 5A). After 2 weeks of combination treatment, tumor weight was significantly decreased compared to imatinib therapy alone (Figure 5B). Tumor cells also expressed significantly lower levels of KIT by percentage of CD45− (i.e. non-immune) cells and by median fluorescence intensity (Figure 5C). Combination treatment was associated with significant reductions in KIT, AKT, and ERK signaling by Western blot at 6h, 1 week, and 2 weeks when compared to imatinib alone (Figure 5D), which was consistent with the additive therapeutic effect of imatinib and VLX600 observed in vitro. Histology demonstrated a dramatic tumor effect in the combination group only (Figure 5E), with an increased stromal response noted at the center of the tumors on H&E staining and a reduction in Ki67 staining. Importantly, the observed tumor effect in vivo appeared to be dependent on inhibition of KIT signaling, as no effect was observed in the VLX600 monotherapy group (Figure 5E). Notably, our in vitro finding of decreased p27 signaling with combination therapy compared to imatinib alone was recapitulated on histological staining in KitV558del/+ tumors after 2 weeks of therapy (Figure 5E), suggesting that quiescent tumor cells were preferentially targeted.
Figure 5. Mitochondrial inhibition enhances the antitumor effects of imatinib in a murine model of GIST.

(A) In vivo 2 week treatment strategy. Imatinib dosed at 600mg/L in drinking water. VLX600 dosed at 4.5mg/kg, dissolved in 4.23mM HCl and diluted with 0.9% NaCl, administered intravenously. (B) Tumor weights after KitV558del/+ mice were treated for 2 weeks with vehicle, VLX600, imatinib, or combination. (C) Representative flow cytometric gating (top) and median fluorescence intensity (bottom) of Kit positivity of the remaining CD45−Kit+ tumor cells in KitV558del/+ mice after treatment. (D) Western blot showing effect of combination therapy on Kit signaling pathway in KitV558del/+ mice after 6h (left), 1 week (middle), and 2 weeks (right) of therapy. (E) 20× magnification of H&E (top) and 10× magnification of p27 (middle) and Ki67 (bottom) histologic findings showing treatment effect of combination therapy in KitV558del/+ mice. Data are from 3 independent experiments. n=3–5 mice per group. *p<0.05. Bars, mean ± SEM.
Discussion
Tyrosine kinase inhibition has been associated with dramatic changes in the metabolic phenotypes of primary and imatinib-resistant GIST.22,42 Glucose uptake is significantly reduced on 18F-FDG PET scanning with imatinib and sunitinib therapy, and metabolic response correlated with an improvement in progression free survival in both primary and resistant disease.21,23,42,43 Interestingly, the development of imatinib resistance coincided with the re-emergence of the glycolytic phenotype within the site of the original tumor.22 Cessation of imatinib therapy in patients exhibiting imatinib resistance results in a “flare” phenomenon in which the remaining GIST lesions exhibit a significant increase in glucose metabolism within days of stopping imatinib.44 This suggests that in addition to developing resistance, a population of imatinib-sensitive cells remain dormant in the tumor, and discontinuation of imatinib therapy allows their metabolic reactivation. These findings expose a therapeutic limitation of imatinib monotherapy and justify further research into the use of metabolic therapies to target imatinib-sensitive but dormant tumor cells.
Here, we show that imatinib therapy altered the metabolic phenotype of GIST by decreasing glucose uptake, and consequently glycolytic activity and capacity, while promoting mitochondrial energy metabolism in remaining tumor cells, consistent with imatinib’s effects in chronic myelogenous leukemia.45,46 We also show that this imatinib-induced shift in metabolic phenotype is associated with a significant enrichment in mitochondrial spare respiratory capacity and a decrease in intracellular ROS, both of which have been shown to promote cell survival in stressful environments.35,36 Therefore, targeting mitochondrial respiration in imatinib-treated tumor cells seems like a logical approach to enhance the efficacy of imatinib in GIST.
We observed that imatinib treatment significantly increased the transcription and expression of key mitochondrial electron transport enzymes, specifically Cox I, II, and IV. Therefore, we hypothesized that the mitochondrial OxPhos inhibitor VLX600, which was shown to inhibit enzymes Cox I, II, and IV in colorectal cancer spheroids,37 would enhance the effect of imatinib. In GIST-T1, which we observed to have a high respiratory capacity at baseline, VLX600 decreased cell viability and proliferation as a monotherapy in addition to synergizing with imatinib. This effect was recapitulated in a xenograft model of GIST, as evidenced by a decreased tumor volume in VLX600-treated tumors, with a histologic effect only present in combination therapy. Similarly, in our genetically engineered mouse model, VLX600 required concurrent imatinib therapy to generate a response, as treatment with VLX600 alone did not result in a tumor weight change or histologic effect. This suggests that the histologic effects we observed with combination therapy in both xenografts and genetically engineered murine tumors are a result of VLX600 enhancing the effect of imatinib.
VLX600 has been shown to induce a HIF1a-mediated glycolytic response in tumor cells,37 and this effect is partially dependent on iron chelation.41 In our murine model of GIST, HIF1a was not upregulated with VLX600 treatment alone, or in combination imatinib/VLX600 therapy. Furthermore, iron supplementation failed to rescue GIST-T1 cells from the cytotoxic effects of VLX600, indicating that the primary mechanism of VLX600 in GIST is OxPhos inhibition. OxPhos inhibition by VLX600 upregulated GLUT1 expression and enhanced AKT signaling in vitro, suggesting a shift toward glycolytic metabolism. Importantly, imatinib-induced reduction in glucose uptake overcame the glycolytic effect induced by VLX600. When combined with imatinib, VLX600 reduced p27 expression in vitro and in vivo, and prevented imatinib-induced cell cycle escape, likely potentiating the antitumoral effects of Kit inhibition. In fact, the decreased KIT signaling and profound histologic effects we observed with combination VLX600/imatinib therapy likely reflect an increased response to imatinib in the setting of forced glycolysis by mitochondrial inhibition, a competitive metabolic effect which has also recently been observed with combined AKT inhibition/paclitaxel therapy in a preclinical lung cancer model.47
We have also shown that human GIST cell lines proliferate more slowly when cultured in low glucose media. Surprisingly, imatinib became less potent in this setting. This suggests that that therapeutic effect of imatinib is partially dependent on the proliferative state of the tumor cell. Remarkably, we also observed that lower doses of imatinib actually appeared to enhance GIST-T1 and HG129 cell viability in low glucose media. Since it has been shown that cells cultured in low glucose media become more reliant on mitochondria,48,49 an imatinib-induced increase in spare respiratory capacity, as we have shown here, may promote cell survival in this setting. Notably, the addition of low dose VLX600 was sufficient to restore the potency of imatinib to normal levels in GIST-T1 and HG129 cell lines. GIST-882 cells, however, remained largely insensitive to lower doses of VLX600 in normal and low glucose media. In combination with the lack of re-entry into the cell cycle of GIST-882 observed in cell cycle analysis, our findings suggest that the OxPhos inhibitory capacity of VLX600 is limited in GIST-882 cells.
Similarly, a small percentage of GIST cells are able to survive despite combined glycolytic and mitochondrial inhibition. One explanation is that VLX600 is only a partial mitochondrial OxPhos inhibitor. GIST-882 cells, the least glycolytic of our human cell lines, demonstrated a significant mitochondrial spare respiratory capacity on extracellular flux analysis, indicating high utilization of OxPhos. Yet, only treatments with higher doses of VLX600 were able to significantly inhibit GIST-882 cell proliferation, suggesting more potent OxPhos inhibition may be needed. Future studies should examine the relationship between the potency of mitochondrial inhibition and in vivo systemic toxicity. Though not observed in either of our murine models, systemic toxicity likely increases as the potency of mitochondrial inhibition increases. One approach to limit systemic toxicity of mitochondrial inhibition is to combine it with targeted molecular therapy, as we have done here. Oncogene-addicted cancers may have less metabolic flexibility in certain fuel pathways, as we have shown with an insignificant change in glucose dependency and capacity in our Mito Fuel test, potentially creating a therapeutic window for mitochondrial therapy in this setting.
Another hypothesis is that imatinib appears to induce other potentially targetable metabolic effects in GIST. After 3 weeks of imatinib treatment, mRNA expression of lactate dehydrogenase A (LDHA) and monocarboxylate transporter 1 (SLC16A1) was significantly upregulated in our murine KitV558del/+ tumors. Since SLC16A1 and LDHA are bi-directional enzymes and can shuttle lactate into a cell, one hypothesis is that prolonged glycolytic suppression by imatinib forces a reverse Warburg effect, where stressed tumor cells incite neighboring stromal cells to export lactate for use by the tumor.50 By obtaining lactate from the tumor environment for input into the TCA cycle (or NADH regeneration in the presence of mitochondrial inhibition), GIST cells may be able to survive despite the dramatic anti-glycolytic effect of imatinib. Similarly, an increased dependence on fatty acid oxidation after imatinib therapy suggests additional metabolic pathways may be activated, introducing new potential targets for metabolic therapy in GIST.
In conclusion, the combination of mitochondrial inhibition with imatinib therapy is a promising therapeutic strategy in GIST. Imatinib significantly alters the metabolic phenotype of remaining GIST cells by decreasing glucose uptake and glycolytic activity while promoting reliance on mitochondrial function. Inhibiting mitochondrial function not only compromises the metabolism of remaining tumor cells, but also drives tumor cells toward a glycolytic phenotype which ultimately increases their sensitivity to the anti-glycolytic and apoptotic effects of imatinib.
Supplementary Material
Translational Relevance.
Metabolic reprogramming is an emerging hallmark of cancer with the potential for therapeutic targeting. Although imatinib’s effect on GIST glucose uptake has been described, compensatory metabolic changes secondary to imatinib therapy are not well defined. Here, we demonstrate that imatinib reduces glucose uptake, which decreases tumor cell glycolytic activity and enhances mitochondrial respiratory capacity. Inhibiting mitochondrial oxidative phosphorylation augments the efficacy of imatinib, highlighting an important limitation of imatinib monotherapy and supporting the use of metabolic therapies in GIST.
Acknowledgments
The investigators were supported by NIH grants R01 CA102613 and T32 CA09501, Betsy Levine-Brown and Marc Brown, David and Monica Gorin (RP DeMatteo); NIH grant F32 CA186534 (JQ Zhang); and GIST Cancer Research Fund (RP DeMatteo and CR Antonescu). We thank members of the Sloan Kettering Institute Laboratory of Comparative Pathology, Molecular Cytology, The Donald B. and Catherine C. Marron Cancer Metabolism Center, Antitumor Assessment core facility, and Research Animal Resource Center. We thank Russell Holmes for logistical and administrative support.
Footnotes
Disclosures: The authors declare no potential conflicts of interest.
References
- 1.Ducimetiere F, Lurkin A, Ranchere-Vince D, Decouvelaere AV, Peoc’h M, Istier L, et al. Incidence of sarcoma histotypes and molecular subtypes in a prospective epidemiological study with central pathology review and molecular testing. PloS one. 2011;6(8):e20294. doi: 10.1371/journal.pone.0020294. [DOI] [PMC free article] [PubMed] [Google Scholar]
- 2.Hirota S, Isozaki K, Moriyama Y, Hashimoto K, Nishida T, Ishiguro S, et al. Gain-of-function mutations of c-kit in human gastrointestinal stromal tumors. Science. 1998;279(5350):577–580. doi: 10.1126/science.279.5350.577. [DOI] [PubMed] [Google Scholar]
- 3.Joensuu H, DeMatteo RP. The management of gastrointestinal stromal tumors: a model for targeted and multidisciplinary therapy of malignancy. Annual review of medicine. 2012;63:247–258. doi: 10.1146/annurev-med-043010-091813. [DOI] [PMC free article] [PubMed] [Google Scholar]
- 4.Blanke CD, Demetri GD, von Mehren M, Heinrich MC, Eisenberg B, Fletcher JA, et al. Long-term results from a randomized phase II trial of standard- versus higher-dose imatinib mesylate for patients with unresectable or metastatic gastrointestinal stromal tumors expressing KIT. Journal of clinical oncology : official journal of the American Society of Clinical Oncology. 2008;26(4):620–625. doi: 10.1200/JCO.2007.13.4403. [DOI] [PubMed] [Google Scholar]
- 5.Verweij J, Casali PG, Zalcberg J, LeCesne A, Reichardt P, Blay JY, et al. Progression-free survival in gastrointestinal stromal tumours with high-dose imatinib: randomised trial. Lancet. 2004;364(9440):1127–1134. doi: 10.1016/S0140-6736(04)17098-0. [DOI] [PubMed] [Google Scholar]
- 6.Takahashi T, Serada S, Ako M, Fujimoto M, Miyazaki Y, Nakatsuka R, et al. New findings of kinase switching in gastrointestinal stromal tumor under imatinib using phosphoproteomic analysis. International journal of cancer. 2013;133(11):2737–2743. doi: 10.1002/ijc.28282. [DOI] [PubMed] [Google Scholar]
- 7.Mahadevan D, Cooke L, Riley C, Swart R, Simons B, Della Croce K, et al. A novel tyrosine kinase switch is a mechanism of imatinib resistance in gastrointestinal stromal tumors. Oncogene. 2007;26(27):3909–3919. doi: 10.1038/sj.onc.1210173. [DOI] [PubMed] [Google Scholar]
- 8.Cohen NA, Zeng S, Seifert AM, Kim TS, Sorenson EC, Greer JB, et al. Pharmacological Inhibition of KIT Activates MET Signaling in Gastrointestinal Stromal Tumors. Cancer research. 2015;75(10):2061–2070. doi: 10.1158/0008-5472.CAN-14-2564. [DOI] [PMC free article] [PubMed] [Google Scholar]
- 9.Antonescu CR, Besmer P, Guo T, Arkun K, Hom G, Koryotowski B, et al. Acquired resistance to imatinib in gastrointestinal stromal tumor occurs through secondary gene mutation. Clinical cancer research : an official journal of the American Association for Cancer Research. 2005;11(11):4182–4190. doi: 10.1158/1078-0432.CCR-04-2245. [DOI] [PubMed] [Google Scholar]
- 10.Demetri GD, van Oosterom AT, Garrett CR, Blackstein ME, Shah MH, Verweij J, et al. Efficacy and safety of sunitinib in patients with advanced gastrointestinal stromal tumour after failure of imatinib: a randomised controlled trial. Lancet. 2006;368(9544):1329–1338. doi: 10.1016/S0140-6736(06)69446-4. [DOI] [PubMed] [Google Scholar]
- 11.Demetri GD, Reichardt P, Kang YK, Blay JY, Rutkowski P, Gelderblom H, et al. Efficacy and safety of regorafenib for advanced gastrointestinal stromal tumours after failure of imatinib and sunitinib (GRID): an international, multicentre, randomised, placebo-controlled, phase 3 trial. Lancet. 2013;381(9863):295–302. doi: 10.1016/S0140-6736(12)61857-1. [DOI] [PMC free article] [PubMed] [Google Scholar]
- 12.Warburg O. On respiratory impairment in cancer cells. Science. 1956;124(3215):269–270. [PubMed] [Google Scholar]
- 13.Warburg O. On the origin of cancer cells. Science. 1956;123(3191):309–314. doi: 10.1126/science.123.3191.309. [DOI] [PubMed] [Google Scholar]
- 14.Warburg O, Wind F, Negelein E. The metabolism of tumors in the body. The Journal of General Physiology. 1927;8(6):519–530. doi: 10.1085/jgp.8.6.519. [DOI] [PMC free article] [PubMed] [Google Scholar]
- 15.Warburg OHPK, Negelein E. über den Stoffwechsel der Tumoren [About the metabolism of tumors] Biochem Z. 1924;152:319–344. [Google Scholar]
- 16.Pavlova NN, Thompson CB. The Emerging Hallmarks of Cancer Metabolism. Cell metabolism. 2016;23(1):27–47. doi: 10.1016/j.cmet.2015.12.006. [DOI] [PMC free article] [PubMed] [Google Scholar]
- 17.Zong WX, Rabinowitz JD, White E. Mitochondria and Cancer. Molecular cell. 2016;61(5):667–676. doi: 10.1016/j.molcel.2016.02.011. [DOI] [PMC free article] [PubMed] [Google Scholar]
- 18.Tan AS, Baty JW, Dong LF, Bezawork-Geleta A, Endaya B, Goodwin J, et al. Mitochondrial genome acquisition restores respiratory function and tumorigenic potential of cancer cells without mitochondrial DNA. Cell metabolism. 2015;21(1):81–94. doi: 10.1016/j.cmet.2014.12.003. [DOI] [PubMed] [Google Scholar]
- 19.Weinberg F, Hamanaka R, Wheaton WW, Weinberg S, Joseph J, Lopez M, et al. Mitochondrial metabolism and ROS generation are essential for Kras-mediated tumorigenicity. Proceedings of the National Academy of Sciences of the United States of America. 2010;107(19):8788–8793. doi: 10.1073/pnas.1003428107. [DOI] [PMC free article] [PubMed] [Google Scholar]
- 20.Gayed I, Vu T, Iyer R, Johnson M, Macapinlac H, Swanston N, et al. The role of 18F-FDG PET in staging and early prediction of response to therapy of recurrent gastrointestinal stromal tumors. Journal of nuclear medicine : official publication, Society of Nuclear Medicine. 2004;45(1):17–21. [PubMed] [Google Scholar]
- 21.Stroobants S, Goeminne J, Seegers M, Dimitrijevic S, Dupont P, Nuyts J, et al. 18FDG-Positron emission tomography for the early prediction of response in advanced soft tissue sarcoma treated with imatinib mesylate (Glivec) European journal of cancer. 2003;39(14):2012–2020. doi: 10.1016/s0959-8049(03)00073-x. [DOI] [PubMed] [Google Scholar]
- 22.Van den Abbeele AD. The lessons of GIST–PET and PET/CT: a new paradigm for imaging. The oncologist. 2008;13(Suppl 2):8–13. doi: 10.1634/theoncologist.13-S2-8. [DOI] [PubMed] [Google Scholar]
- 23.Goerres GW, Stupp R, Barghouth G, Hany TF, Pestalozzi B, Dizendorf E, et al. The value of PET, CT and in-line PET/CT in patients with gastrointestinal stromal tumours: long-term outcome of treatment with imatinib mesylate. European journal of nuclear medicine and molecular imaging. 2005;32(2):153–162. doi: 10.1007/s00259-004-1633-7. [DOI] [PMC free article] [PubMed] [Google Scholar]
- 24.Boichuk S, Parry JA, Makielski KR, Litovchick L, Baron JL, Zewe JP, et al. The DREAM complex mediates GIST cell quiescence and is a novel therapeutic target to enhance imatinib-induced apoptosis. Cancer research. 2013;73(16):5120–5129. doi: 10.1158/0008-5472.CAN-13-0579. [DOI] [PubMed] [Google Scholar]
- 25.DeCaprio JA, Duensing A. The DREAM complex in antitumor activity of imatinib mesylate in gastrointestinal stromal tumors. Current opinion in oncology. 2014;26(4):415–421. doi: 10.1097/CCO.0000000000000090. [DOI] [PMC free article] [PubMed] [Google Scholar]
- 26.Zhang X, de Milito A, Olofsson MH, Gullbo J, D’Arcy P, Linder S. Targeting Mitochondrial Function to Treat Quiescent Tumor Cells in Solid Tumors. International journal of molecular sciences. 2015;16(11):27313–27326. doi: 10.3390/ijms161126020. [DOI] [PMC free article] [PubMed] [Google Scholar]
- 27.Sommer G, Agosti V, Ehlers I, Rossi F, Corbacioglu S, Farkas J, et al. Gastrointestinal stromal tumors in a mouse model by targeted mutation of the Kit receptor tyrosine kinase. Proceedings of the National Academy of Sciences of the United States of America. 2003;100(11):6706–6711. doi: 10.1073/pnas.1037763100. [DOI] [PMC free article] [PubMed] [Google Scholar]
- 28.Taguchi T, Sonobe H, Toyonaga S, Yamasaki I, Shuin T, Takano A, et al. Conventional and molecular cytogenetic characterization of a new human cell line, GIST-T1, established from gastrointestinal stromal tumor. Laboratory investigation; a journal of technical methods and pathology. 2002;82(5):663–665. doi: 10.1038/labinvest.3780461. [DOI] [PubMed] [Google Scholar]
- 29.Tuveson DA, Willis NA, Jacks T, Griffin JD, Singer S, Fletcher CD, et al. STI571 inactivation of the gastrointestinal stromal tumor c-KIT oncoprotein: biological and clinical implications. Oncogene. 2001;20(36):5054–5058. doi: 10.1038/sj.onc.1204704. [DOI] [PubMed] [Google Scholar]
- 30.Zeng S, Feirt N, Goldstein M, Guarrera J, Ippagunta N, Ekong U, et al. Blockade of receptor for advanced glycation end product (RAGE) attenuates ischemia and reperfusion injury to the liver in mice. Hepatology. 2004;39(2):422–432. doi: 10.1002/hep.20045. [DOI] [PubMed] [Google Scholar]
- 31.Balachandran VP, Cavnar MJ, Zeng S, Bamboat ZM, Ocuin LM, Obaid H, et al. Imatinib potentiates antitumor T cell responses in gastrointestinal stromal tumor through the inhibition of Ido. Nature medicine. 2011;17(9):1094–1100. doi: 10.1038/nm.2438. [DOI] [PMC free article] [PubMed] [Google Scholar]
- 32.Hans Prenen CS, Landuyt Bart, Vermaelen Peter, Debiec-Rychter Maria, Bollen Mathieu, Stroobants Sigrid, de Bruijn Ernst, Moertlmans Luc, Sciot Raf, Schoffski Patrick, van Oosterom Allan. Imatinib Mesylate Inhibits Glucose Uptake in Gastrointestinal Stromal Tumor Cells by Downregulation of the Glucose Transporters Recruitment to the Plasma Membrane. Am J Biochem & Biotechnol. 2005;2:95–102. [Google Scholar]
- 33.Tarn C, Skorobogatko YV, Taguchi T, Eisenberg B, von Mehren M, Godwin AK. Therapeutic effect of imatinib in gastrointestinal stromal tumors: AKT signaling dependent and independent mechanisms. Cancer research. 2006;66(10):5477–5486. doi: 10.1158/0008-5472.CAN-05-3906. [DOI] [PubMed] [Google Scholar]
- 34.Rogatzki MJ, Ferguson BS, Goodwin ML, Gladden LB. Lactate is always the end product of glycolysis. Frontiers in neuroscience. 2015;9:22. doi: 10.3389/fnins.2015.00022. [DOI] [PMC free article] [PubMed] [Google Scholar]
- 35.Pfleger J, He M, Abdellatif M. Mitochondrial complex II is a source of the reserve respiratory capacity that is regulated by metabolic sensors and promotes cell survival. Cell death & disease. 2015;6:e1835. doi: 10.1038/cddis.2015.202. [DOI] [PMC free article] [PubMed] [Google Scholar]
- 36.Wang J, Cai J, Huang Y, Ke Q, Wu B, Wang S, et al. Nestin regulates proliferation and invasion of gastrointestinal stromal tumor cells by altering mitochondrial dynamics. Oncogene. 2016;35(24):3139–3150. doi: 10.1038/onc.2015.370. [DOI] [PubMed] [Google Scholar]
- 37.Zhang X, Fryknas M, Hernlund E, Fayad W, De Milito A, Olofsson MH, et al. Induction of mitochondrial dysfunction as a strategy for targeting tumour cells in metabolically compromised microenvironments. Nature communications. 2014;5:3295. doi: 10.1038/ncomms4295. [DOI] [PMC free article] [PubMed] [Google Scholar]
- 38.Antonescu CR. The GIST paradigm: lessons for other kinase-driven cancers. The Journal of pathology. 2011;223(2):251–261. doi: 10.1002/path.2798. [DOI] [PMC free article] [PubMed] [Google Scholar]
- 39.Weinstein IB, Joe A. Oncogene addiction. Cancer research. 2008;68(9):3077–3080. doi: 10.1158/0008-5472.CAN-07-3293. discussion 3080. [DOI] [PubMed] [Google Scholar]
- 40.Elstrom RL, Bauer DE, Buzzai M, Karnauskas R, Harris MH, Plas DR, et al. Akt stimulates aerobic glycolysis in cancer cells. Cancer research. 2004;64(11):3892–3899. doi: 10.1158/0008-5472.CAN-03-2904. [DOI] [PubMed] [Google Scholar]
- 41.Fryknas M, Zhang X, Bremberg U, Senkowski W, Olofsson MH, Brandt P, et al. Iron chelators target both proliferating and quiescent cancer cells. Scientific reports. 2016;6:38343. doi: 10.1038/srep38343. [DOI] [PMC free article] [PubMed] [Google Scholar]
- 42.Demetri GD, Heinrich MC, Fletcher JA, Fletcher CD, Van den Abbeele AD, Corless CL, et al. Molecular target modulation, imaging, and clinical evaluation of gastrointestinal stromal tumor patients treated with sunitinib malate after imatinib failure. Clinical cancer research : an official journal of the American Association for Cancer Research. 2009;15(18):5902–5909. doi: 10.1158/1078-0432.CCR-09-0482. [DOI] [PMC free article] [PubMed] [Google Scholar]
- 43.Van den Abbeele AD, Badawi RD. Use of positron emission tomography in oncology and its potential role to assess response to imatinib mesylate therapy in gastrointestinal stromal tumors (GISTs) European journal of cancer. 2002;38(Suppl 5):S60–65. doi: 10.1016/s0959-8049(02)80604-9. [DOI] [PubMed] [Google Scholar]
- 44.Van Den Abbeele AD, Badawi RD, Manola J, Morgan JA, Desai J, Kazanovicz A, et al. Effects of cessation of imatinib mesylate (IM) therapy in patients (pts) with IM-refractory gastrointestinal stromal tumors (GIST) as visualized by FDG-PET scanning. Journal of Clinical Oncology. 2004;22(14_suppl):3012–3012. [Google Scholar]
- 45.Alvarez-Calderon F, Gregory MA, Pham-Danis C, DeRyckere D, Stevens BM, Zaberezhnyy V, et al. Tyrosine kinase inhibition in leukemia induces an altered metabolic state sensitive to mitochondrial perturbations. Clinical cancer research : an official journal of the American Association for Cancer Research. 2015;21(6):1360–1372. doi: 10.1158/1078-0432.CCR-14-2146. [DOI] [PMC free article] [PubMed] [Google Scholar]
- 46.Gottschalk S, Anderson N, Hainz C, Eckhardt SG, Serkova NJ. Imatinib (STI571)-mediated changes in glucose metabolism in human leukemia BCR-ABL-positive cells. Clinical cancer research : an official journal of the American Association for Cancer Research. 2004;10(19):6661–6668. doi: 10.1158/1078-0432.CCR-04-0039. [DOI] [PubMed] [Google Scholar]
- 47.Le Grand M, Berges R, Pasquier E, Montero MP, Borge L, Carrier A, et al. Akt targeting as a strategy to boost chemotherapy efficacy in non-small cell lung cancer through metabolism suppression. Scientific reports. 2017;7:45136. doi: 10.1038/srep45136. [DOI] [PMC free article] [PubMed] [Google Scholar]
- 48.Elkalaf M, Andel M, Trnka J. Low glucose but not galactose enhances oxidative mitochondrial metabolism in C2C12 myoblasts and myotubes. PloS one. 2013;8(8):e70772. doi: 10.1371/journal.pone.0070772. [DOI] [PMC free article] [PubMed] [Google Scholar]
- 49.Robinson GL, Dinsdale D, Macfarlane M, Cain K. Switching from aerobic glycolysis to oxidative phosphorylation modulates the sensitivity of mantle cell lymphoma cells to TRAIL. Oncogene. 2012;31(48):4996–5006. doi: 10.1038/onc.2012.13. [DOI] [PubMed] [Google Scholar]
- 50.Doherty JR, Cleveland JL. Targeting lactate metabolism for cancer therapeutics. The Journal of clinical investigation. 2013;123(9):3685–3692. doi: 10.1172/JCI69741. [DOI] [PMC free article] [PubMed] [Google Scholar]
Associated Data
This section collects any data citations, data availability statements, or supplementary materials included in this article.