

Abstract
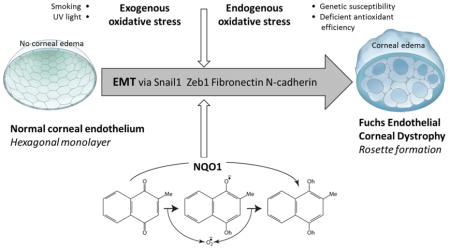
Fuchs endothelial corneal dystrophy (FECD) is a genetic and oxidative stress disorder of post-mitotic human corneal endothelial cells (HCEnCs), which normally exhibit hexagonal shape and form a compact monolayer compatible with normal corneal functioning and clear vision. FECD is associated with increased DNA damage, which in turn leads to HCEnC loss, resulting in the formation rosettes and aberrant extracellular matrix (ECM) deposition in the form of pro-fibrotic guttae. Since the mechanism of ECM deposition in FECD is currently unknown, we aimed to investigate the role of endothelial-mesenchymal transition (EMT) in FECD using a previously established cellular in vitro model that recapitulates the characteristic rosette formation, by employing menadione (MN)-induced oxidative stress. We demonstrate that MN treatment alone, or a combination of MN and TGF-β1 induces reactive oxygen species (ROS), cell death, and EMT in HCEnCs during rosette formation, resulting in upregulation of EMT- and FECD-associated markers such as Snail1, N-cadherin, ZEB1, and transforming growth factor-beta-induced (TGFβI), respectively. Additionally, FECD ex vivo specimens treated with MN displayed a loss of organized junctional staining of plasma membrane-bound N-cadherin, with corresponding increase in fibronectin and Snail1 compared to ex vivo controls. Addition of N-acetylcysteine (NAC) downregulated all EMT markers and abolished rosette formation. Loss of NQO1, a metabolizing enzyme of MN, led to greater increase in intracellular ROS levels as well as a significant upregulation of Snail1, fibronectin, and N-cadherin compared to normal cells, indicating that NQO1 regulates Snail1-mediated EMT. This study provides first line evidence that MN-induced oxidative stress leads to EMT in corneal endothelial cells, and the effect of which is further potentiated when redox cycling activity of MN is enhanced by the absence of NQO1. Given that NAC inhibits Snail-mediated EMT, this may be a potential therapeutic intervention for FECD.
Keywords: cornea, endothelium, oxidative stress, TGFβ, endothelial-mesenchymal transition, menadione, Fuchs endothelial corneal dystrophy
Graphical Abstract
Introduction
Human corneal endothelial cells (HCEnCs) are a monolayer of regular hexagonal cells that form the most posterior layer of the cornea, facing the anterior chamber of the eye. These cells are arrested in post-mitotic state and have minimal proliferative capacity in vivo [1–3]. The post-mitotic arrest is believed to be attributed to contact inhibition [4], transforming growth factor (TGF) -β in the aqueous fluid, and lack of paracrine stimulation by cell cycle promoting growth factors [5]. Fuchs endothelial corneal dystrophy (FECD) is the most common degenerative condition of corneal endothelium, manifesting in gradual and age-related loss of HCEnCs and production of extracellular matrix (ECM) deposits in the form of guttae. These dome shaped excrescences protrude from the underlying Descemet’s membrane (DM), a basement membrane located between the corneal stroma and endothelium, and are thought to be secreted by degenerating endothelial cells [6].
Although little is known about the exact composition of guttae, studies have shown abnormal wide-spaced collagen in the posterior collagenous layer of DM [7, 8], as well as increased collagen VIII, collagen IV, laminin [9, 10], collagen I [11–13], collagen XVI [12], and fibronectin [12, 13]. Similar ECM changes have been associated with endothelial-mesenchymal transition (EMT) occurring during tissue fibrosis and scar formation in other organ systems such as liver, intestine, kidney [14–16], lung [17–19], and heart [20, 21]. EMT is a repair-associated event that leads to organ fibrosis in response to pathological stress [20]. It generates activated mesenchymal-like cells that produce excessive amounts of collagen-rich ECM and results in upregulation of characteristic EMT markers such vimentin, Snail1, ZEB1, collagen 1A1, laminin, fibronectin, and N-cadherin [20–22]. Moreover, TGF-β, the main modulator of EMT, is abundant in aqueous humor [23] and has been shown to induce the production of TGFβI [24], which is known to be upregulated in FECD [25]. Increased levels of TGF-β1 and TGF-β2 have been noted in aqueous fluid of a subgroup of FECD patients [26]. Although components of EMT have been described in FECD, the etiology of purported EMT in endothelial cell degeneration needs further investigation. The mechanism of morphological and functional changes that accompany HCEnC loss and ECM deposition in the development of FECD is not yet known. Both the intracellular crosstalk and the microenvironmental triggers of EMT phenotypes are of particular interest in these mitotically incompetent cells.
One of the major inducers of EMT under pathologic conditions is oxidative stress [27, 28]. Previous studies have implicated oxidative stress and DNA damage in the pathogenesis of FECD [25, 29–34] and have shown that generation of intracellular ROS with menadione (MN) leads to DNA damage during rosette formation in normal HCEnCs, modeling the changes seen in FECD [35]. Rosette formation is prominent feature seen in FECD ex vivo specimens and signifies a degenerative process, during which the endothelial cells form a ring or rosette around the bases of dome-shaped extracellular matrix deposits [36]. In this study, we sought to investigate whether oxidative DNA damage induced by MN causes EMT during rosette formation and leads to cellular remodeling involved in the pathogenesis of FECD. MN is a quinone that is reduced and metabolized by NQO1 to menadiol by 2-electron transfer, quenching ROS generation and macromolecular damage of un-metabolized quinones. NQO1, regulated by Nrf2 transcriptional activation, has a broad role in cellular protection from oxidative stress and has been shown to play a key role in oxidant-antioxidant imbalance seen in FECD [30, 37]. Furthermore, given that TGF-β is one of the main modulators of EMT, we aimed to evaluate the interplay between MN-induced oxidative stress and TGF-β in HCEnCs.
Materials and Methods
Human Tissue
This study was conducted according to the tenets of the Declaration of Helsinki and approved by the Massachusetts Eye and Ear Institutional Review Board. Written and informed consent was obtained from patients undergoing surgical treatment for FECD. After surgical removal, the tissue was immediately placed in storage medium (Optisol-GS; Bausch& Lomb) at 4°C. For western blot, human FECD endothelium was derived from post-keratoplasty specimens (n=4, age range 57–87). Normal donor corneas (n=4, age range 68–75) were purchased from Northeast Pennsylvania Lions Eye Bank according to the criteria previously reported. Tissue used for immunofluorescence microscopy consisted of FECD endothelium (n =6, age range 54–80) and normal donor corneas (n=4, age range 52–65).
Cell Culture
Normal HCEnC-21T cells were immortalized by retrovirus transfection containing pBABE-puro-hTERT [38]. Cells were cultured in Chen’s medium (OptiMEM-I; Invitrogen, Carlsbad, CA), containing 8% fetal bovine serum (HyClone, Rockford, IL), 5 ng/mL epidermal growth factor (Millipore, Billerica, MA), 100 mg/mL bovine pituitary extract (Invitrogen), 200 mg/L calcium chloride (Sigma-Aldrich, St. Louis, MO), 0.08% chondroitin sulfate (Sigma-Aldrich), 50 mg/mL gentamicin (Invitrogen), and 1:100 diluted antibiotic/antimycotic solution (Sigma-Aldrich). Sub-culturing of HCEnCs was performed using 0.05% trypsin (Invitrogen) for 5 minutes at 37°C. Initially, HCEnCs were plated in Chen’s medium for ~22 hours before incubation with 25 or 50 μM MN (Sigma-Aldrich) in DMEM (Life Technologies), with or without 10ng/ml TGF-β1 (Peprotech, Rocky Hill, NJ), for 1 to 5 hours. To rescue cells from EMT, a supplement of NAC (5mM; Sigma-Aldrich) was used. Similarly, NQO1−/− and NQO1+/+ cells were plated in Chen’s medium and subjected to 50 μM MN treatment for 1–5 hours. To enhance the effects of TGF-β1, cells were pre-starved in serum-free medium (low-glucose DMEM) for 24 hours prior to extended 24-hour incubation with 10ng/ml TGF-β1, and/or 3 hours of 25 μM MN treatment.
Generation of NQO1−/− Cells
To abrogate the expression of NQO1 in HCEnC-21T cells, NQO1 locus was targeted for a Crispr-Cas9 mediated excision by transfection of 2μg of either NQO1 Double Nickase plasmid (sc-400326-NIC, Santa Cruz) or Control Double Nickase plasmid (sc-437281, Santa Cruz) in low passage HCEnC-21T cells with 6μl of Lipofectamine 2000 in OptiMEM (Thermo Fisher, Waltham, MA). 48h post-transfection, cells were sorted for GFP expressing cells and were cultured in a 10cm tissue culture dish for one week. Control Double Nickase transfected cells were used for further experimentation as a non-targeted control for NQO1−/− cells. HCEnC-21T cells transfected with NQO1 targeting plasmids were trypsinized and sorted at 100 cells/well in a 24-well and allowed to grow until 100% confluency. Cells from twenty- four wells were expanded further and tested for the expression of NQO1 on a western blot. 14/24 clones showed complete loss of NQO1 and the selected clones were used for further experiments.
Cellular Viability and Morphology
Cell number and viability were measured using an automatic cell counter (Countess; Life Technologies) and trypan blue dye exclusion, respectively. Phase-contrast microscopy (Leica DM IL LED) was employed to visualize cell morphology. Numbers of rosettes were quantified by treating cells in a 6-well plate and manually counting visible rosettes at low magnification from a minimum of 6 random areas at each time point. Rosette number was averaged for each treatment condition.
Detection of ROS in Live Cells
ROS production was measured using Image-iT LIVE Green Reactive Oxygen Species Detection Kit (Molecular Probes, Inc., Eugene, OR, USA). Post-treatment, HCEnCs were stained with 25μM 5-(and-6)-carboxy-2’, 7’-dichlorodihydrofluorescein diacetate (carboxy-H2DCFDA) for 30 minutes at 37°C. Cells were harvested with a scraper, washed with warm HBSS, and centrifuged at 500g for 5 minutes. Cells were then re-suspended in 100 μL warm HBSS and transferred to a flat-bottomed black 96-well plate. The percentage of carboxyl-H2DCF–stained cells was analyzed by measuring their fluorescence (485/520 nm), using a fluorescence microplate reader (BioTek-Synergy 2; BioTek Instruments, Inc., Winooski, VT, USA). Relative fluorescence units were normalized to the cell number.
Immunofluorescent Labelling
HCEnCs cells were treated with 25 or 50μM MN with or without 10ng/ml TGF-β1 for 1–5 hours. Pre-treated cells were fixed with cold methanol and acetone (1:1 ratio) for 1 minute, permeabilized with 0.5% Triton X-100 (Sigma-Aldrich) in PBS for 20 minutes, and blocked for 1 hour with 5% BSA in PBS. FECD ex vivo specimens were fixed with 4% paraformaldehyde for 10 minutes at RT, permeabilized using 0.3% Triton X-100 in 10% normal goat serum for 1 hour at RT, and blocked for 30 minutes with 10% BSA. Both cells and tissue were incubated with primary antibodies (Supplement, Table 1) overnight at 4°C, followed by secondary antibody incubation for 2 hours at RT. Primary antibodies were omitted for negative controls. Nuclei were counterstained with ether DAPI (Mounted with Vectashield; Vector Laboratories, Burlingame, CA), or 100 μg/l PI (Sigma-Aldrich). Images were obtained with a laser scanning confocal microscope (Leica TCS 4D). For each sample, high-resolution images in Z-stacks were collected and a final image was obtained by reconstruction of all stacks with Leica LAS AF Lite software.
RT-PCR
Cells treated with MN and TGF-β1 were lyzed with Trizol (Invitrogen), and aqueous phase was prepared according to the manufacturer’s protocol. The aqueous phase was mixed with 70% ethanol, and RNA extraction was performed with RNeasy Micro Kit with in-column DNase I digestion according to the manufacturer’s protocol (Qiagen, Valencia, CA). RNA quality and quantity were measured using a NanoDrop (LabTech International, Uckfield, UK). Two micrograms of total RNA were reverse-transcribed in a 20μl reaction volume iScript cDNA synthesis kit (Bio- Rad, Hercules, CA), according to the manufacturers protocol. TaqMan primers listed in Supplementary Table 2 were obtained from Applied Biosystems (Foster City, CA). RT-PCR was performed in a Mastercycler Realplex2 (Eppendorf, Hamburg, Germany) as triplicates with Probe Fast Master Mix (Kapa Biosystems, Wilmington, MA). No-template reactions were performed for each assay as negative controls. The results were normalized to their respective GAPDH comparative threshold (CT) values. Relative expression was calculated by subtracting normalized CT values of the reference sample (untreated cells) from the experimental value and expressed as 2ΔΔ−CT.
Western Blot Analysis
Whole cell extracts were lyzed with the protein extraction buffer ER3 (Biorad, Hercules, CA) and 1 mM tributyl phosphine. Proteins were loaded onto 10% Bis-Tris NuPAGE gels (Invitrogen). Peptides were transferred to a polyvinylidene difluoride membrane (Millipore, Billerica, MA) and nonspecific binding was blocked with 5% dry nonfat milk in PBS for 1 hour. Membranes were incubated overnight at 4°C with purified mouse Anti-Actin Ab-5 (BD biosciences) diluted 1:500 and rabbit polyclonal anti–glyceraldehyde-3-phosphate dehydrogenase (anti-GAPDH, 1:4000; Santa Cruz Biotechnology); was used to normalize protein loading. Blots were rinsed, re-blocked, and exposed for 1 hour to horseradish peroxidase–conjugated goat anti-mouse IgG, 1:1500 for Actin blots, and horseradish peroxidase-conjugated anti-rabbit IgG 1:1000 for GAPDH blots. After washing in 0.1% Triton X-100, antibody binding was detected with a chemiluminescent substrate (Thermo Scientific, Pittsburgh, PA). Densitometry was analyzed with ImageJ software (developed by Wayne Rasband, National Institutes of Health, Bethesda, MD; available at http://rsb.info.nih.gov/ij/index.html ), and protein content was normalized relative to GAPDH content. Experiments were repeated a minimum of three times. Results were averaged and SEM values were calculated.
Flow Cytometry
HCEnC-21T control (NQO1+/+) and NQO1−/− cells were seeded in a 6-well plate and cultured for 24 hours prior to treating with 50μM MN in low-glucose DMEM) and incubated for 5 hours. Cells were then trypsinized, washed in cold PBS, and incubated in the dark with 3μl of Annexin-V/FITC (Ann) (Thermo Fisher, Waltham, MA) and 2μl of PI (Sigma-Aldrich) in a total volume of 50μl for 30 minutes at room temperature. Cells were re-suspended in 2ml of Isoflow sheath fluid (Beckman Coulter, Fullerton, CA) and 20,000 live cells were acquired on a LSR II (BD Biosciences) with DIVA software (BD Biosciences) gated for PI and Annexin V with unstained cells as negative control. Data were then analyzed with Summit 4.3 (Beckman Coulter, Fullerton, CA).
Statistical Analysis
Statistical significance was determined using a Student’s t-test for two-sample comparison, and one-way analysis of variance (ANOVA), with Dunnett’s or Tukey’s post-hoc analysis, or two-way ANOVA with Bonferroni post tests for comparison of multiple data sets. All statistical analysis was carried out using Graph-Pad Prism software (GraphPad Software Inc., San Diego, CA).
Results
MN and TGF-β induce ROS during rosette formation in HCEnCs
As FECD has been deemed as an oxidative stress disorder [29, 30, 39], it is important to investigate the mechanism of rosette formation in response to MN-induced intracellular ROS generation, and to assess the interplay between ROS and TGFβ. Our lab demonstrated that MN-induced DNA damage in HCEnCs leads to rosette formation, corresponding to findings in an ex vivo FECD specimen [35]. In order to investigate the role EMT in rosette formation, normal HCEnCs were grown in hexagonal monolayers and exposed to TGF-β1 and MN at doses used to induce DNA damage. The effect of intracellular ROS production on EMT was determined by investigating cellular viability and morphology.
MN treatment resulted in morphological changes, including cell elongation and junctional disruption. Phase-contrast microscopy revealed that MN transformed the typical hexagonal shape of HCEnCs into spindle–like cells with elongated processes extending around the clear acellular centers; thus, forming a rosette (Fig. 1A–H). Rosette-like structures formed as early as 1 hour after 50 μM MN, 3 hours after 25uM MN, and progressively increased in number with incubation time (Supplemental Fig. 1). The centers of rosettes often exhibited a dying or a detaching cell with surrounding cell processes extending toward the detaching cells. (Fig. 1B, D, F). Furthermore, the progressive formation of rosettes within the cell monolayer with MN treatment in a time- and dose dependent manner was confirmed by rosette counting, with 50μM MN treatment producing significantly higher numbers of rosettes after 3 (p < 0.01) and 5 (p < 0.01) hours, compared to 25μM doses. Rosette number increased sequentially with time, with the highest numbers of rosettes observed after 5 hours for all treatment groups (Fig. 2A). The formation of rosettes with MN was characteristic of the ones detected in ex-vivo specimens taken from FECD patients (Fig. 1I). The MN-treated cells exhibited similar fibroblastic morphology to FECD primary HCEnCs (Fig. 1J); both differing from a normal hexagonal monolayer.
Figure 1.

Cell morphological changes following MN and TGF-β treatment observed using phase-contrast microscopy. HCEnCs treated with MN alone (25μM or 50μM) (A–D), or with a combination of MN and TGFβ (E–H), resulted in the formation of rosette structures (stars), where cells formed elongated processes (white arrowheads). Rosettes formed within cell monolayers in a time- and dose-dependent manor. Similar morphological characteristics were observed in ex vivo FECD specimens, with HCEnCs surrounding guttae on the native DM (stars) (I). Cultured primary FECD cells at p0 display a fibroblastic morphology (J). Scale bars = 50μm.
Figure 2.

MN induces rosette formation and elevated ROS levels in HCEnCs. A. Number of rosettes formed in response to varying treatment exposure times (1–5 hours), observed with phase-contrast microscopy. Multiple comparisons were carried out using two-way ANOVA with Bonferroni post-tests, showing a significant interaction (p < 0.0001) between time (p < 0.0001) and treatment condition (p < 0.0001) on rosette number. B. Assessment of cell viability using trypan blue dye exclusion assay following 3 or 5 hours with MN and/or TGF-β1 treatment. Statistical significance tested with one-way ANOVA with Tukey’s post-hoc test. C. HCEnC intracellular ROS production assessed with DCFDA assay after 5 hours following pre-treatment with MN and/or TGF-β1. Statistical significance tested using one-way ANOVA with Dunnett’s post-hoc test comparing all groups to untreated controls. Significant increase in number of rosettes, cell death, and intracellular ROS levels were prevented with the addition of NAC (A,B,C). Data expressed as mean values ± SE (n=6). (*p < 0.05, **p < 0.01, ***p < 0.001).
Addition of TGF-β1 alone to HCEnC monolayer did not induce rosette formation (Supplemental Fig. 2). Treatment of TGF-β1 with MN led to similar morphological changes with cells assuming spindle shape, losing cell-cell junctions and forming rosettes (Fig. 1E–H). However, TGF-β1 and MN treatment resulted in formation of thinner cell processes and more rounded-up cell shape indicative of diminished cell attachments and greater propensity for cell loss. Furthermore, addition of TGF-β1 led to more diffuse cellular morphological changes with cells assuming fibroblastic phenotype throughout the monolayer and less so in the confines of the rosette. Therefore, the numbers of distinct rosettes declined with addition of TGF-β1 to MN at 3 and 5 hours of treatment (Fig. 1G, H; Fig. 2A).
Cell viability was diminished at 3 and 5 hours with MN treatment in dose-dependent manner (Fig. 2B). Indeed, we detected higher level of cell loss when TGF-β1 was added to 25μM and 50 μM MN; such effect was greater at a 5-hour time point than at 3 hours (Fig. 1F, H; Fig. 2B). Therefore, the increase in cell loss after TGF-β1 addition to MN accounted for diminution of typical rosette formation seen in phase-contrast images of the cell monolayer. The highest loss of cell viability was with 50 μM MN and TGF-β1 compared to untreated cells (p <0.0001) (Fig. 2B). Loss of cell viability and increase in rosette formation correlated with increase in ROS production with MN only treatments in a dose-dependent manner (Fig. 2C). A significant increase in ROS production was evident with 25μM MN (p < 0.05) and 50μM MN (p < 0.001) compared to untreated HCEnC. Interestingly, TGF-β1 augmented ROS production with 25μM MN but not with 50 μM MN. NAC is an effective scavenger of ROS and has been shown to rescue the cells from MN-induced DNA damage [35]. Co-treatment of MN with NAC quenched ROS formation, rescued cell viability, and prevented rosette formation (Fig. 2; Supplemental Fig. 2).
Upregulation of EMT markers in FECD ex vivo specimens
To determine whether EMT plays a role in rosette formation in ex vivo FECD specimens, we created tissue whole mounts of HCEnCs attached to native DM and evaluated the EMT protein levels and localization. FECD ex vivo specimens revealed diffuse rosette formation with loss of plasma membrane-bound N-cadherin staining seen in the normal mosaic of hexagonal cells (Fig. 3A). In FECD rosettes, N-cadherin displayed diffuse and punctate cytoplasmic staining with loss of organized junctional staining pattern seen in normal ex vivo controls, indicating altered adherens junctions and disrupted normal tissue integrity. Western blot analysis revealed overall increased levels of N-cadherin (p < 0.05) in FECD compared to normal specimens (Fig. 3C). E-cadherin, which is predominantly synthesized in the cells of epithelial lineage, was very low at basal levels in HCEnCs and was not further downregulated in FECD (data not shown). The upregulation and change in localization of N-cadherin indicates upregulation of EMT and conversion to fibroblastic cells with increased migratory characteristics in FECD [40, 41].
Figure 3.

Expression of endothelial mesenchymal markers in human ex vivo specimens. Immunofluorescence distribution, observed by confocal microscopy, of anti-N-cadherin (A) and anti-Snail (B) reactivity in HCEnCs attached to FECD ex vivo specimens compared to normal controls, showing diffuse rosette formation (stars). A. A loss of organized junctional N-cadherin staining was observed in FECD ex vivo specimens. B. Snail1 protein was highly expressed in the cytoplasm of HCEnCs attached to FECD ex vivo specimens compared to normal control. Cells were stained with propidium iodide (PI) to localize nuclei. No staining was visible in the negative controls. C. Western blot analysis of fibronectin and N-cadherin protein levels reveal a significant increase in FECD tissue. Data are expressed as the mean ± SE (n=4). Students t-test was used to test statistical significance (* p < 0.05). Scale bars = 50μm.
Since EMT process is known to be driven by Snail-mediated induction of genes associated with mesenchymal phenotype [42, 43], we evaluated Snail1 localization in FECD tissues. Although Snail1 was not synthesized in normal tissue specimens, it showed significant upregulation in FECD (Fig. 3B). Interestingly, we did not detect nuclear localization of Snail1 in FECD specimens; instead, Snail1 exhibited diffuse cytoplasmic staining with increased density around the edges of rosettes. Although nuclear translocation is necessary for Snail1 to be transcriptionally active, it is possible that there is a perturbation of nuclear import mechanisms in FECD as loss of ATP seen in FECD may preclude activity of import proteins [44]. Similarly, Snail has been shown to localize to the cytosol of several cancerous cell lines [45]. Moreover, we evaluated the level of fibronectin, which is known to be transcriptionally regulated by Snail1 [46, 47], and detected significant upregulation (p < 0.05) in FECD ex vivo specimens compared to normal controls (Fig. 3C). Vimentin, a protein associated with enhanced motility during the EMT process, was not altered at the protein level in FECD (Fig. 3C).
MN upregulates EMT during rosette formation
To determine whether MN activates EMT during rosette formation, we evaluated EMT marker protein levels in HCEnCs following 5 hours pre-treatment with 50 μM MN. When compared to untreated controls, MN induced an increase in fluorescence of N-cadherin and α-SMA during rosette formation (Fig. 4A). EMT is characterized by tight and adherens junction disassembly, redistribution, and the expression of the myofibroblast marker α-SMA. We further investigated the levels of α-SMA, which is the major component of contractile microfilaments involved in cellular motility seen in EMT, and detected 1.4-fold upregulation of α-SMA at 4 hours (p = 0.033) and 1.7-fold at 5 hours (p = 0.030) of MN treatment compared to untreated cells (Fig. 4B and C).
Figure 4.

EMT and FECD marker expression after 50μM MN exposure in HCEnCs. A. Immunofluorescent labelling, observed with confocal microscopy, reveals N-cadherin and α-SMA protein expression increases following 5 hours pre-treatment with 50μM MN compared to untreated controls. Nuclei were counterstained with propidium iodide (PI) or DAPI. B, C. Quantification of Western blot α-SMA levels in HCEnCs after 1–5 hours 50μM MN exposure reveals a significant increase at 4 and 5 hours compared to untreated controls. Statistical significance tested using a Student’s t-test. D. Changes in EMT and FECD marker mRNA levels in response to MN treatment assessed over a 5-hour period using RT-PCR, with a supplement of NAC added at the 5-hour time point. Relative mRNA expression was normalized to GAPDH. One-way ANOVA followed by Dunnett’s post-hoc test was used to assess statistical significance, with all data time points compared to the 0-hour control. Bar graphs represent mean values ± SE (n=6). Scale bars = 50μm.
As Snail1 was upregulated in ex vivo FECD specimens (Fig. 3B), we evaluated whether Snail1 is involved in MN-induced rosette formation and detected ~37-fold (p < 0.001) increase in Snail1 transcription after 2 hours MN treatment, indicating that Snail1 is key transcription factor in initiating oxidative stress-induced EMT in HCEnCs (Fig. 4D). Moreover, we detected subsequent upregulation of Snail-controlled factors, such as fibronectin (2-fold; p <0.001), N-cadherin (7-fold; p < 0.001) and ZEB1 (6-fold; p < 0.001) at a 5-hour time point of MN treatment. Our previous proteomic analysis detected an increase in various isoforms of TGFβI and clusterin in FECD specimens [25, 31]. Similarly, in this study, MN induced increased expression of TGFβI and clusterin mRNA at all time point, with the highest levels seen at 3, 4 and 5 hours (p < 0.001), compared to untreated controls. TGFβI is an extracellular matrix adhesion molecule that interacts with collagens, integrins, N-cadherin, and fibronectins [48], and its upregulation with MN is consistent with ex vivo specimen data noting coordinated upregulation of both EMT and FECD-specific proteins. Furthermore, addition of NAC rescued HCEnCs from undergoing EMT and decreased all EMT markers to the baseline levels.
MN and TGF-β1 upregulate EMT transcriptional regulators in HCEnCs
Since TGF-β1 is highly concentrated in the aqueous fluid and is a known to be the main activator of EMT during fibrosis and scarring [49], we sought to evaluate the interplay between MN and TGF-β1 during rosette formation. As 50μM MN with TGF-β1 led to significant loss of cell viability, we first pursued the co-treatment experiments of lower-dose MN (25μM) with and without TGF-β1 for 1, 3, and 5 hours and evaluated the expression of key EMT transcriptional regulators involved in FECD (Fig. 5). There was an upregulation of Snail1 with MN at all time points compared to untreated cells (Fig. 5A); however, addition of TGF-β1 to MN led to the decline in Snail1 expression as compared to MN treatment alone at 3 and 5 hours (Bar 3 vs 4; p < 0.001 at 3 hours). Conversely, TGF-β1 had a synergistic effect with MN in upregulating ZEB1 expression at 3 (p < 0.01) and 5 hours (p < 0.001; Fig. 5B), indicating a Snail1 independent mechanism. Additionally, co-treatment with TGF-β1 had a significant synergistic effect on upregulation of TGFβI at 1 (p < 0.05) and 3 hours (p <0.001; Fig 5C), but no effect on N-cadherin expression (Fig. 5D). Addition of NAC to the MN alone, TGF-β1 alone, or MN and TGF-β1 co-treatment samples, led to a reduction in expression of Snail1, ZEB1, TGFβI, and N-cadherin mRNA to baseline levels (p < 0.001; Fig. 5A–D), indicating a ROS-dependent mechanism of EMT activation.
Figure 5.

Relative expression of EMT transcriptional regulators in response to 1–5 hours 25μM MN and/or 10ng/ml TGF-β1 treatment. RT-PCR quantification of relative Snail 1 (A), ZEB1 (B), TGFβI (C), and N-cadherin (D) mRNA levels. MN increased the expression of all markers at every time point, whereas TGF-β1 alone only induced a significant upregulation of ZEB1 and TGFβI. Likewise, combining TGF-β1 with MN had a synergistic effect for ZEB1 and TGFβI expression. Upregulation of each gene was inhibited with the addition of NAC to each treatment condition. Data is normalized to GAPDH and expressed as mean values ± SE (n=6). Statistical analysis carried out on each time point using one-way ANOVA with Tukey’s post-hoc test (*p < 0.05, **p < 0.01, ***p < 0.001).
To evaluate whether different incubation conditions influenced Snail1 expression, we pre-starved the HCEnCs in low nutrient medium, followed by treatment with TGF-β1 for 24 hours and subsequent addition of lower-dose MN to capture potential synergistic effects of MN and TGF-β1 prior to threshold loss of cell viability. Pre-starvation and extended TGF-β1 exposure resulted in a 2-fold increase in Snail1 expression (p <0.05; Supplemental Fig. 3A). Like the previous treatment paradigm, 25μM MN exposure for 3 hours after pre-starvation led to upregulation of Snail1 (p <0.01; Supplemental Fig. 3B). Cells treated with a combination of TGF-β1 and MN resulted in the highest expression of Snail1, providing evidence that TGF-β1 acts synergistically with MN in upregulating Snail1, when serum starvation and/or longer TGF-β1 exposure times are employed.
In order to examine the localization of Snail1 following MN and TGF-β1 treatment, we performed immunofluorescence analysis and detected increased production of Snail1 in the cytoplasm and nuclei of HCEnCs treated with MN (Fig. 6). The fluorescence increased as early as 1 hour after the MN treatment and persisted up to the 5-hour time point, consistent with early upregulation of Snail and sequential increase in Snail1- mediated factors FN, N-cadherin, and ZEB1 (Fig. 4D). Furthermore, Snail1 expression appeared higher in cells surrounding rosettes. Addition of TGF-β1 did not manifest in a significant change of fluorescence intensity. The predominant cytoplasmic localization of Snail1 correlated with findings seen in FECD ex vivo specimens (Fig. 3B).
Figure 6.

Localization of Snail1 protein in HCEnCs treated with MN and TGF-β1. Representative images of Snail1 (green) visualized over a 5-hour period using confocal microscopy, showing an upregulation in response to 25μM MN or a combination of both MN and 10ng/ml TGF-β1. The addition of TGF-β1 to MN did not appear to potentiate Snail1 expression at any time point, compared to treatment with MN alone. Results were obtained from three biological replicates. Nuclei (red) were counterstained with propidium iodide. Scale bars = 50μm.
Loss of NQO1 potentiates MN-induced EMT
We have previously shown that there is a dysregulation of Nrf2-mediated antioxidant defense in FECD, including a deficiency in one of its major transcriptional targets, NQO1 [30, 50]. Since NQO1 is the main metabolizer of MN, we employed Crispr-Cas9 mediated excision and developed an NQO1 knock-down cell line and, after exposure to MN, investigated cellular behavior (Fig. 7). Treatment of NQO1−/− cells with 50 μM MN over a 5-hour period resulted in similar EMT-like morphological changes as those observed in HCEnC. Rosettes began to form after 1 hour and increased in number in a time-dependent manor (Fig. 7A). After 5 hours, fibroblast-like elongated cell processes were evident, in addition to extensive cellular apoptosis. NQO1 knock-down was validated by Western blot (Fig. 7B). Cell viability and ROS measurements revealed that the number of live cells were significantly decreased (by 20%) after 5-hour MN treatment in NQO1−/− cells, compared to NQO1+/+ (p < 0.001; Fig. 7C), correlating with an increase in intracellular ROS levels (p <0.001) (Fig. 7D), highlighting the antioxidant role of NQO1. To further evaluate the role of NQO1 on oxidative-stress-induced apoptosis, control and NQO1−/− cells were pretreated with 50μM MN for 5 hours. At baseline, there were no significant differences between control and NQO1−/− in all population gated for either Ann+, PI+, or both (Fig. 7E, F). However, loss of NQO1 resulted in an increase in late apoptotic cells represented in the PI+ and Ann+ population (91.8%) compared to the control cell line (81.9%) when treated with MN (p = 0.011, Fig. 7E, F), indicating heightened susceptibility to apoptotic cell death caused by NQO1 deficiency.
Figure 7.

Loss of NQO1 potentiates 50μM MN-induced EMT. A. NQO1−/− cells observed with phase-contrast microscopy following 1–5 hours MN treatment. Untreated (0 hour) NQO1−/− cells were used as a control. B. Representative Western blot showing knock-down of NQO1 protein. C. Cell viability (D) and intracellular ROS comparison between MN treated NQO1−/− and control cells assessed. E. Control and NQO1−/− cells were pretreated with 50μM MN for 5 hours and stained with Annexin-V (Ann) and propidium iodide (PI). Representative images of flow cytometry analysis gated for vital (Ann-/PI-), early apoptotic (Ann+/PI-), late apoptotic (Ann+/PI+), and necrotic (Ann-/PI+) cell populations in control and NQO1−/−cells are shown. F. The percentage of late apoptotic cells (PI+ and Ann+). G. Snail1 relative mRNA expression changes over 1–5 hours MN exposure in NQO1−/− and controls cells. H. Relative changes in N-cadherin, fibronectin, and ZEB1 mRNA expression after 5 hours MN treatment. I. Cells were pre-starved in serum-free media before 24 hours TGF-β1 exposure. Snail 1 and TGFβI mRNA levels were assessed in NQO1−/− and control cells. Student’s t-test or one-way ANOVA with Tukey’s post-hoc test was performed to identify the statistical significance (*p < 0.05, **p < 0.01, ***p < 0.001). All RT-PCR data is expressed as fold change and normalized to GAPDH. Bar graphs represent mean values ± SE (n=6). Scale bars = 100μm.
Next, we then sought to investigate whether loss of NQO1 influences EMT induction in response to MN treatment. Snail1 expression increased sequentially with MN exposure time in NQO1−/− cells, showing significantly higher expression after 5 hours (p < 0.01) compared to control cells, which reached highest Snail1 expression after 3 hours MN (Fig. 7G). Moreover, N-cadherin (p < 0.01) and fibronectin (p < 0.05) mRNA levels were higher after 5 hours of MN; however, no difference was observed in ZEB1 expression (Fig. 7H). This data indicates that oxidative stress-induced EMT occurs at an increased rate, at the 5-hour time point, in cells with diminished NQO1. Furthermore, Snail1 and TGFβI expression increased to a significantly higher level in NQO1−/− cells compared to NQO1+/+, when exposed to 10ng/ml TGF-β1 for 24 hours (p < 0.05), indicating a differential susceptibility based on NQO1 presence (Fig. 7I).
Discussion
Corneal endothelium consists of a post-mitotic cell type which is exposed to oxidative stress via chronic exposure to UV light, exuberant metabolic activity of pumping ions to maintain corneal deturgescence, and high mitochondrial respiratory demands. Loss of regular hexagonal mosaic has been the major cause of loss barrier and pumping functions of HCEnCs resulting in corneal edema in FECD [51]. In FECD, excessive deposition of ECM, in the form of guttae, leads to destruction of adjacent endothelial cells and eventual failure of monolayer functioning. In this study we have shown that oxidative stress-induced EMT is the primary mechanism of cellular remodeling involved in the pathogenesis of FECD. Herein, we identified factors associated with tissue fibrosis and inappropriate repair processes that are specifically upregulated by oxidative DNA damaging stimuli, altering HCEnC behavior and mimicking morphological changes observed in human specimens. Loss of NQO1 potentiated the intrinsic susceptibility of FECD HCEnCs to oxidative stress and further exacerbated the EMT findings, indicating a pivotal role antioxidant defense plays in supporting the differentiated and functioning tissue phenotype.
The reprogramming of gene expression profiles characteristic of EMT were achieved by inducing endogenous stress via intracellular ROS production by MN. When studied in naturally proliferating cell lineages, MN has been shown to reduce EMT characteristics and growth potential in cancer cells, providing evidence for use of quinones in anticancer therapies [52, 53]. However, in the post-mitotic cells of ocular tissue, the endogenous ROS production led to the loss of cell-cell junctions, cytoskeletal rearrangements, and changes in basement membrane interactions with increase in migratory characteristics and upregulation of Snail-mediated EMT. This is the first study to show that MN triggers cell behavior changes by inducing Snail and its downstream targets, such as fibronectin, N-cadherin, and ZEB1, all of which are involved in EMT activation during abnormal tissue fibrogenesis. Similarly, a previous study implicated EMT in FECD by showing upregulation of ZEB1 and Snail1, where normal and FECD cell lines were used [13]. In the current study, we undertook a mechanistic approach to induce EMT with a DNA damaging agent and corroborated findings with native specimens, where endothelial cells retained intrinsic attachments to their abnormal basement membrane and formed rosettes. We detected a parallel between intrinsic upregulation of EMT proteins in the ex vivo specimens and in HCEnCs after exposure to an exogenous DNA damaging stressor, stipulating a mechanistic understanding of the involvement of oxidative stress in the disease process.
Oxidative stress has been shown to be a critical factor for development of various EMT-driven disorders, such as pulmonary, liver, and renal fibrosis [54]. In this study we have shown that corneal endothelial cell degeneration in FECD via EMT is likely driven by dysfunction in Nrf2-NQO1 axis and excessive ROS generation. Similarly, Nrf2 has been shown to modulate EMT in renal fibrosis [55, 56], and suppression of Nrf2-dependent enzymes correlated with increased renal fibrosis in Nrf2 null mice [57]. In our experimental model, we generated an NQO1 knockout cell line, the major Nrf2 transcriptional target, and detected enhanced endothelial cell susceptibility to MN-induced ROS generation and cell death compared to control cells. MN is a known substrate for NQO1, which cells ubiquitously utilize for quenching of intracellular ROS; thus, the deficiency in NQO1 vastly potentiates the redox imbalance that triggers cellular acquisition of EMT. A previous study in renal cells has underlined the important role that Nrf2-dependent heme oxygenase-1 plays in inhibiting EMT in renal fibrosis [57]. More recently, in a bleomycin-induced pulmonary fibrosis model, activation of NQO1 with β-lap led to attenuation of EMT in vivo [58]. However, we found that NQO1 deficient cells had a greater upregulation of Snail1 than normal when exposed to MN for 5 hours, indicating that NQO1 may regulate the expression of Snail. Heightened generation of ROS in NQO1 deficiency led to differential upregulation of Snail1 and its main downstream targets N-cadherin and fibronectin, but not ZEB1, which likely has other transcriptional controls outside of Snail. Therefore, our study is the first one to point that NQO1 has a critical role in mediating EMT via activation of Snail1 in post-mitotic corneal cells, thus contributing to the pathogenesis of FECD.
One of the major cytokines in fibrosis development is TGF-β [59], and studies have shown that inhibition of Nrf2 mediated antioxidant response leads to an increase in TGFβ-1-mediated EMT in renal cells [55]. Interestingly, when added to MN, TGF-β decreased cell viability but did not contribute significantly to rosette formation or morphological changes seen in FECD ex vivo. However, NQO1−/− cells were differentially susceptible to TGF-β in upregulating Snail. TGF-β1 is a known modulator of EMT [60, 61] and may be involved in potentiating the Nrf2-NQO1-mediated EMT seen in FECD, given that Snail1 and TGFβI expression was higher in cells lacking NQO1 when treated with TGF-β1 for 24 hours. Since aqueous humor has abundant concentration of TGF-β [62–64], therapeutic modalities aimed at reducing TGF-β activity hold a great promise for stalling fibrogenesis progression in FECD [65].
Our study has shown that therapeutic modalities with NAC, which suppresses ROS generation, has a great promise in ameliorating EMT by reducing rosette formation and suppressing activation of pro-fibrosis factors and FECD-specific proteins [25]. Previous studies have shown that upregulation of Nrf2 defense [66, 67], and/or quenching ROS production [55, 68], is strongly protective of and even capable of reversing EMT. Moreover, Nrf2 agonist sulforaphane, has been shown to suppress EMT activation in pulmonary fibrosis model by regulating Snail [69]. NAC is a thiol compound that provides a cysteine residue to stimulate glutathione redox capacity and has been shown to upregulate Nrf2 antioxidant defense [70–72]. Our study shows that NAC, similar to other Nrf2 agonists, inhibits Snail-mediated EMT induced by oxidant-antioxidant imbalance; thus, providing a promise for halting fibrogenesis in the ocular tissues known to have Nrf2 deficiency [30, 50, 73]. Moreover, various ophthalmic formulations of NAC have been a widely utilized for other corneal disorders [74, 75].
Conclusions
By using an in vitro model that recapitulates characteristic rosette formation in HCEnCs, we detected that oxidative stress induces EMT, causing loss of cell–cell adhesion, acquisition of fibroblastic morphology, and upregulation of Snail1, ZEB1, fibronectin, and N-cadherin in human corneal endothelium. This effect was potentiated when redox cycling activity of MN was enhanced by the absence of NQO1. This data highlights the regulatory role of intracellular changes in inducing EMT in post mitotic corneal cells, which are highly dependent on hexagonal morphology and strong junctional structures for normal functioning. When this is lost during EMT, endothelium is unable to maintain corneal deturgescence and clear vision is greatly diminished. As NAC was shown to inhibit Snail-mediated EMT, this may be a potential therapeutic intervention for FECD.
Supplementary Material
MN and TGF-β1 induces rosette formation in HCEnCs in a time- and dose-dependent manor. HCEnCs were subjected to 25 or 50μM MN, with or without the addition of 10ng/ml TGF-β1 for 1–5 hours. Changes in cell morphology were observed with phase-contrast microscopy, with black stars indicating the presence of rosettes. Bars = 50μm.
NAC inhibits rosette formation in HCECs. Phase-contrast microscopy revealed that cells treated with TGF-β1 alone failed to produce rosettes. Addition of NAC to the MN +/− TGF-β1 treatments groups prevented the distinctive rosette formation as seen in Supplement 1.
TGF-β1 upregulates Snail1 and acts synergistically with MN in pre-starved HCEnCs. HCEnCs were pre-starved in low-glucose DMEM for 24 hours before an extended 24-hour treatment with TGF-β1 (A), +/− 25μM MN for the final 3 hours (B). Snail1 mRNA expression was examined with RT-PCR. Statistical significance tested using a Student’s t-test (n =3).
Highlights.
Menadione-induced oxidative stress activates EMT in HCEnCs
Menadione-induced EMT is potentiated by the absence of NQO1
Menadione-induced EMT is inhibited with the addition of NAC
Acknowledgments
This work was supported by NIH/NEI grants R01EY20581, core grant P30EY003790, Alcon Research Award, and New England Transplantation Fund.
Abbreviations
- BSA
bovine serum albumin
- DAPI
4, 6-diamidino-2-phenylindole
- DM
Descemet’s membrane
- DMEM
Dulbecco’s modified Eagle’s medium
- EMT
endothelial-mesenchymal transition
- ECM
extracellular matrix
- FECD
Fuchs endothelial corneal dystrophy
- FN
fibronectin
- HBSS
Hanks balanced salt solution
- HCEnC
human corneal endothelial cell
- MN
menadione
- NAC
N-acetylcysteine
- NQO1
NAD(P)H-dependent quinone oxireductase
- Nrf2
nuclear factor erythroid 2-related factor
- PBS
phosphate-buffered saline
- PI
propidium iodide
- ROS
reactive oxygen species
- SEM
standard error of the mean
- RT-PCR
Real-time reverse transcription–polymerase chain reaction
- TGF-β
transforming growth factor-beta
- TGFβI
transforming growth factor-beta-induced
- ZEB1
zinc-finger E-box binding homeobox
- 1 α-SMA
alpha-smooth muscle actin
Footnotes
Work performed at: Schepens Eye Research Institute, Massachusetts Eye and Ear, 20 Staniford Street, Boston, Massachusetts 02114, USA.
Publisher's Disclaimer: This is a PDF file of an unedited manuscript that has been accepted for publication. As a service to our customers we are providing this early version of the manuscript. The manuscript will undergo copyediting, typesetting, and review of the resulting proof before it is published in its final citable form. Please note that during the production process errors may be discovered which could affect the content, and all legal disclaimers that apply to the journal pertain.
References
- 1.Joyce NC. Proliferative capacity of the corneal endothelium. Prog Retin Eye Res. 2003;22(3):359–89. doi: 10.1016/s1350-9462(02)00065-4. [DOI] [PubMed] [Google Scholar]
- 2.Peh GS, Toh KP, Wu FY, Tan DT, Mehta JS. Cultivation of human corneal endothelial cells isolated from paired donor corneas. PLoS One. 2011;6(12):16. doi: 10.1371/journal.pone.0028310. [DOI] [PMC free article] [PubMed] [Google Scholar]
- 3.Senoo T, Joyce NC. Cell cycle kinetics in corneal endothelium from old and young donors. Invest Ophthalmol Vis Sci. 2000;41(3):660–7. [PubMed] [Google Scholar]
- 4.Joyce NC, Harris DL, Mello DM. Mechanisms of mitotic inhibition in corneal endothelium: contact inhibition and TGF-beta2. Invest Ophthalmol Vis Sci. 2002;43(7):2152–9. [PubMed] [Google Scholar]
- 5.Chen KH, Harris DL, Joyce NC. TGF-beta2 in aqueous humor suppresses S-phase entry in cultured corneal endothelial cells. Invest Ophthalmol Vis Sci. 1999;40(11):2513–9. [PubMed] [Google Scholar]
- 6.Son HS, Villarreal G, Meng H, Eberhart CG, Jun AS. On the origin of ‘guttae’. The British journal of ophthalmology. 2014;98(9):1308–1310. doi: 10.1136/bjophthalmol-2014-305069. [DOI] [PMC free article] [PubMed] [Google Scholar]
- 7.Levy SG, Moss J, Sawada H, Dopping-Hepenstal PJ, McCartney AC. The composition of wide-spaced collagen in normal and diseased Descemet's membrane. Current eye research. 1996;15(1):45–52. doi: 10.3109/02713689609017610. [DOI] [PubMed] [Google Scholar]
- 8.Bourne WM, Johnson DH, Campbell RJ. The ultrastructure of Descemet's membrane. III. Fuchs' dystrophy. Archives of ophthalmology. 1982;100(12):1952–5. doi: 10.1001/archopht.1982.01030040932013. [DOI] [PubMed] [Google Scholar]
- 9.Gottsch JD, Zhang C, Sundin OH, Bell WR, Stark WJ, Green WR. Fuchs corneal dystrophy: aberrant collagen distribution in an L450W mutant of the COL8A2 gene. Investigative ophthalmology & visual science. 2005;46(12):4504–11. doi: 10.1167/iovs.05-0497. [DOI] [PubMed] [Google Scholar]
- 10.Kelliher C, Chakravarti S, Vij N, Mazur S, Stahl PJ, Engler C, Matthaei M, Yu SM, Jun AS. A cellular model for the investigation of Fuchs' endothelial corneal dystrophy. Exp Eye Res. 2011;93(6):880–8. doi: 10.1016/j.exer.2011.10.001. [DOI] [PMC free article] [PubMed] [Google Scholar]
- 11.Matthaei M, Hu J, Kallay L, Eberhart CG, Cursiefen C, Qian J, Lackner EM, Jun AS. Endothelial cell microRNA expression in human late-onset Fuchs' Dystrophy. Investigative ophthalmology & visual science. 2014;55(1):216–25. doi: 10.1167/iovs.13-12689. [DOI] [PMC free article] [PubMed] [Google Scholar]
- 12.Weller JM, Zenkel M, Schlotzer-Schrehardt U, Bachmann BO, Tourtas T, Kruse FE. Extracellular matrix alterations in late-onset Fuchs' corneal dystrophy. Invest Ophthalmol Vis Sci. 2014;55(6):3700–8. doi: 10.1167/iovs.14-14154. [DOI] [PubMed] [Google Scholar]
- 13.Okumura N, Minamiyama R, Ho LT, Kay EP, Kawasaki S, Tourtas T, Schlotzer-Schrehardt U, Kruse FE, Young RD, Quantock AJ, Kinoshita S, Koizumi N. Involvement of ZEB1 and Snail1 in excessive production of extracellular matrix in Fuchs endothelial corneal dystrophy. Lab Invest. 2015;95(11):1291–304. doi: 10.1038/labinvest.2015.111. [DOI] [PubMed] [Google Scholar]
- 14.Iwano M, Plieth D, Danoff TM, Xue C, Okada H, Neilson EG. Evidence that fibroblasts derive from epithelium during tissue fibrosis. The Journal of clinical investigation. 2002;110(3):341–50. doi: 10.1172/JCI15518. [DOI] [PMC free article] [PubMed] [Google Scholar]
- 15.Kalluri R, Neilson EG. Epithelial-mesenchymal transition and its implications for fibrosis. The Journal of clinical investigation. 2003;112(12):1776–84. doi: 10.1172/JCI20530. [DOI] [PMC free article] [PubMed] [Google Scholar]
- 16.Slattery C, Campbell E, McMorrow T, Ryan MP. Cyclosporine A-induced renal fibrosis: a role for epithelial-mesenchymal transition. The American journal of pathology. 2005;167(2):395–407. doi: 10.1016/S0002-9440(10)62984-7. [DOI] [PMC free article] [PubMed] [Google Scholar]
- 17.Phan SH. The myofibroblast in pulmonary fibrosis. Chest. 2002;122(6 Suppl):286S–289S. doi: 10.1378/chest.122.6_suppl.286s. [DOI] [PubMed] [Google Scholar]
- 18.Willis BC, Borok Z. TGF-beta-induced EMT: mechanisms and implications for fibrotic lung disease. American journal of physiology Lung cellular and molecular physiology. 2007;293(3):L525–34. doi: 10.1152/ajplung.00163.2007. [DOI] [PubMed] [Google Scholar]
- 19.Willis BC, duBois RM, Borok Z. Epithelial origin of myofibroblasts during fibrosis in the lung. Proceedings of the American Thoracic Society. 2006;3(4):377–82. doi: 10.1513/pats.200601-004TK. [DOI] [PMC free article] [PubMed] [Google Scholar]
- 20.Kalluri R, Weinberg RA. The basics of epithelial-mesenchymal transition. The Journal of clinical investigation. 2009;119(6):1420–8. doi: 10.1172/JCI39104. [DOI] [PMC free article] [PubMed] [Google Scholar]
- 21.Zeisberg EM, Tarnavski O, Zeisberg M, Dorfman AL, McMullen JR, Gustafsson E, Chandraker A, Yuan X, Pu WT, Roberts AB, Neilson EG, Sayegh MH, Izumo S, Kalluri R. Endothelial-to-mesenchymal transition contributes to cardiac fibrosis. Nature medicine. 2007;13(8):952–61. doi: 10.1038/nm1613. [DOI] [PubMed] [Google Scholar]
- 22.Peinado H, Olmeda D, Cano A. Snail, Zeb and bHLH factors in tumour progression: an alliance against the epithelial phenotype? Nat Rev Cancer. 2007;7(6):415–28. doi: 10.1038/nrc2131. [DOI] [PubMed] [Google Scholar]
- 23.Joyce NC, Zieske JD. Transforming growth factor-beta receptor expression in human cornea. Investigative ophthalmology & visual science. 1997;38(10):1922–8. [PubMed] [Google Scholar]
- 24.Yellore VS, Rayner SA, Aldave AJ. TGFB1-induced extracellular expression of TGFBIp and inhibition of TGFBIp expression by RNA interference in a human corneal epithelial cell line. Investigative ophthalmology & visual science. 2011;52(2):757–63. doi: 10.1167/iovs.10-5362. [DOI] [PMC free article] [PubMed] [Google Scholar]
- 25.Jurkunas UV, Bitar M, Rawe I. Colocalization of increased transforming growth factor-beta-induced protein (TGFBIp) and Clusterin in Fuchs endothelial corneal dystrophy. Invest Ophthalmol Vis Sci. 2009;50(3):1129–36. doi: 10.1167/iovs.08-2525. [DOI] [PMC free article] [PubMed] [Google Scholar]
- 26.Matthaei M, Gillessen J, Muether PS, Hoerster R, Bachmann BO, Hueber A, Cursiefen C, Heindl LM. Epithelial-Mesenchymal Transition (EMT)-Related Cytokines in the Aqueous Humor of Phakic and Pseudophakic Fuchs' Dystrophy Eyes. Invest Ophthalmol Vis Sci. 2015;56(4):2749–54. doi: 10.1167/iovs.15-16395. [DOI] [PubMed] [Google Scholar]
- 27.Gorowiec MR, Borthwick LA, Parker SM, Kirby JA, Saretzki GC, Fisher AJ. Free radical generation induces epithelial-to-mesenchymal transition in lung epithelium via a TGF-beta1-dependent mechanism. Free radical biology & medicine. 2012;52(6):1024–32. doi: 10.1016/j.freeradbiomed.2011.12.020. [DOI] [PubMed] [Google Scholar]
- 28.Kim J, Seok YM, Jung KJ, Park KM. Reactive oxygen species/oxidative stress contributes to progression of kidney fibrosis following transient ischemic injury in mice. American journal of physiology Renal physiology. 2009;297(2):F461–70. doi: 10.1152/ajprenal.90735.2008. [DOI] [PubMed] [Google Scholar]
- 29.Azizi B, Ziaei A, Fuchsluger T, Schmedt T, Chen Y, Jurkunas UV. p53-regulated increase in oxidative-stress--induced apoptosis in Fuchs endothelial corneal dystrophy: a native tissue model. Invest Ophthalmol Vis Sci. 2011;52(13):9291–7. doi: 10.1167/iovs.11-8312. [DOI] [PMC free article] [PubMed] [Google Scholar]
- 30.Jurkunas UV, Bitar MS, Funaki T, Azizi B. Evidence of oxidative stress in the pathogenesis of fuchs endothelial corneal dystrophy. Am J Pathol. 2010;177(5):2278–89. doi: 10.2353/ajpath.2010.100279. [DOI] [PMC free article] [PubMed] [Google Scholar]
- 31.Jurkunas UV, Bitar MS, Rawe I, Harris DL, Colby K, Joyce NC. Increased clusterin expression in Fuchs' endothelial dystrophy. Invest Ophthalmol Vis Sci. 2008;49(7):2946–55. doi: 10.1167/iovs.07-1405. [DOI] [PMC free article] [PubMed] [Google Scholar]
- 32.Jurkunas UV, Rawe I, Bitar MS, Zhu C, Harris DL, Colby K, Joyce NC. Decreased expression of peroxiredoxins in Fuchs' endothelial dystrophy. Invest Ophthalmol Vis Sci. 2008;49(7):2956–63. doi: 10.1167/iovs.07-1529. [DOI] [PMC free article] [PubMed] [Google Scholar]
- 33.Zhang X, Igo RP, Jr, Fondran J, Mootha VV, Oliva M, Hammersmith K, Sugar A, Lass JH, Iyengar SK. Association of smoking and other risk factors with Fuchs' endothelial corneal dystrophy severity and corneal thickness. Invest Ophthalmol Vis Sci. 2013;54(8):5829–35. doi: 10.1167/iovs.13-11918. [DOI] [PMC free article] [PubMed] [Google Scholar]
- 34.Czarny P, Seda A, Wielgorski M, Binczyk E, Markiewicz B, Kasprzak E, Jimenez-Garcia MP, Grabska-Liberek I, Pawlowska E, Blasiak J, Szaflik J, Szaflik JP. Mutagenesis of mitochondrial DNA in Fuchs endothelial corneal dystrophy. Mutat Res. 2014;760:42–7. doi: 10.1016/j.mrfmmm.2013.12.001. [DOI] [PubMed] [Google Scholar]
- 35.Halilovic A, Schmedt T, Benischke AS, Hamill C, Chen Y, Santos JH, Jurkunas UV. Menadione-Induced DNA Damage Leads to Mitochondrial Dysfunction and Fragmentation During Rosette Formation in Fuchs Endothelial Corneal Dystrophy. Antioxidants & Redox Signaling. 2016;24(18):1072–1083. doi: 10.1089/ars.2015.6532. [DOI] [PMC free article] [PubMed] [Google Scholar]
- 36.Tuberville AW, Wood TO, McLaughlin BJ. Cytochrome oxidase activity of Fuchs' endothelial dystrophy. Curr Eye Res. 1986;5(12):939–47. doi: 10.3109/02713688608995175. [DOI] [PubMed] [Google Scholar]
- 37.Liu C, Chen Y, Kochevar IE, Jurkunas UV. Decreased DJ-1 leads to impaired Nrf2-regulated antioxidant defense and increased UV-A-induced apoptosis in corneal endothelial cells. Invest Ophthalmol Vis Sci. 2014;55(9):5551–60. doi: 10.1167/iovs.14-14580. [DOI] [PMC free article] [PubMed] [Google Scholar]
- 38.Schmedt T, Chen Y, Nguyen TT, Li S, Bonanno JA, Jurkunas UV. Telomerase Immortalization of Human Corneal Endothelial Cells Yields Functional Hexagonal Monolayers. PLoS One. 2012;7(12):e51427. doi: 10.1371/journal.pone.0051427. [DOI] [PMC free article] [PubMed] [Google Scholar]
- 39.Buddi R, Lin B, Atilano SR, Zorapapel NC, Kenney MC, Brown DJ. Evidence of oxidative stress in human corneal diseases. J Histochem Cytochem. 2002;50(3):341–51. doi: 10.1177/002215540205000306. [DOI] [PubMed] [Google Scholar]
- 40.Wheelock MJ, Shintani Y, Maeda M, Fukumoto Y, Johnson KR. Cadherin switching. J Cell Sci. 2008;121(Pt 6):727–35. doi: 10.1242/jcs.000455. [DOI] [PubMed] [Google Scholar]
- 41.Yilmaz M, Christofori G. EMT, the cytoskeleton, and cancer cell invasion. Cancer Metastasis Rev. 2009;28(1–2):15–33. doi: 10.1007/s10555-008-9169-0. [DOI] [PubMed] [Google Scholar]
- 42.Lamouille S, Xu J, Derynck R. Molecular mechanisms of epithelial–mesenchymal transition. Nature reviews Molecular cell biology. 2014;15(3):178–196. doi: 10.1038/nrm3758. [DOI] [PMC free article] [PubMed] [Google Scholar]
- 43.Barrallo-Gimeno A, Nieto MA. The Snail genes as inducers of cell movement and survival: implications in development and cancer. Development. 2005;132(14):3151–61. doi: 10.1242/dev.01907. [DOI] [PubMed] [Google Scholar]
- 44.Muqbil I, Wu J, Aboukameel A, Mohammad RM, Azmi AS. Snail Nuclear Transport: the Gateways Regulating Epithelial-to-Mesenchymal Transition? Seminars in cancer biology. 2014;27:39–45. doi: 10.1016/j.semcancer.2014.06.003. [DOI] [PMC free article] [PubMed] [Google Scholar]
- 45.Dominguez D, Montserrat-Sentis B, Virgos-Soler A, Guaita S, Grueso J, Porta M, Puig I, Baulida J, Franci C, Garcia de Herreros A. Phosphorylation regulates the subcellular location and activity of the snail transcriptional repressor. Mol Cell Biol. 2003;23(14):5078–89. doi: 10.1128/MCB.23.14.5078-5089.2003. [DOI] [PMC free article] [PubMed] [Google Scholar]
- 46.Guaita S, Puig I, Franci C, Garrido M, Dominguez D, Batlle E, Sancho E, Dedhar S, De Herreros AG, Baulida J. Snail induction of epithelial to mesenchymal transition in tumor cells is accompanied by MUC1 repression and ZEB1 expression. J Biol Chem. 2002;277(42):39209–16. doi: 10.1074/jbc.M206400200. [DOI] [PubMed] [Google Scholar]
- 47.Cano A, Perez-Moreno MA, Rodrigo I, Locascio A, Blanco MJ, del Barrio MG, Portillo F, Nieto MA. The transcription factor snail controls epithelial-mesenchymal transitions by repressing E-cadherin expression. Nat Cell Biol. 2000;2(2):76–83. doi: 10.1038/35000025. [DOI] [PubMed] [Google Scholar]
- 48.Runager K, Enghild JJ, Klintworth GK. Focus on molecules: Transforming growth factor beta induced protein (TGFBIp) Experimental eye research. 2008;87(4):298–299. doi: 10.1016/j.exer.2007.12.001. [DOI] [PMC free article] [PubMed] [Google Scholar]
- 49.Xu J, Lamouille S, Derynck R. TGF-beta-induced epithelial to mesenchymal transition. Cell Res. 2009;19(2):156–72. doi: 10.1038/cr.2009.5. [DOI] [PMC free article] [PubMed] [Google Scholar]
- 50.Bitar MS, Liu C, Ziaei A, Chen Y, Schmedt T, Jurkunas UV. Decline in DJ-1 and Decreased Nuclear Translocation of Nrf2 in Fuchs Endothelial Corneal Dystrophy. Investigative Ophthalmology & Visual Science. 2012;53(9):5806–5813. doi: 10.1167/iovs.12-10119. [DOI] [PMC free article] [PubMed] [Google Scholar]
- 51.Schmedt T, Silva MM, Ziaei A, Jurkunas U. Molecular bases of corneal endothelial dystrophies. Exp Eye Res. 2012;95(1):24–34. doi: 10.1016/j.exer.2011.08.002. [DOI] [PMC free article] [PubMed] [Google Scholar]
- 52.Suresh S, Raghu D, Karunagaran D. Menadione (Vitamin K3) induces apoptosis of human oral cancer cells and reduces their metastatic potential by modulating the expression of epithelial to mesenchymal transition markers and inhibiting migration. Asian Pac J Cancer Prev. 2013;14(9):5461–5. doi: 10.7314/apjcp.2013.14.9.5461. [DOI] [PubMed] [Google Scholar]
- 53.Klotz LO, Patak P, Ale-Agha N, Buchczyk DP, Abdelmohsen K, Gerber PA, von Montfort C, Sies H. 2-Methyl-1,4-naphthoquinone, vitamin K(3), decreases gap-junctional intercellular communication via activation of the epidermal growth factor receptor/extracellular signal-regulated kinase cascade. Cancer Res. 2002;62(17):4922–8. [PubMed] [Google Scholar]
- 54.Liu RM, Gaston Pravia KA. Oxidative stress and glutathione in TGF-beta-mediated fibrogenesis. Free Radic Biol Med. 2010;48(1):1–15. doi: 10.1016/j.freeradbiomed.2009.09.026. [DOI] [PMC free article] [PubMed] [Google Scholar]
- 55.Kang SJ, You A, Kwak MK. Suppression of Nrf2 signaling by angiotensin II in murine renal epithelial cells. Arch Pharm Res. 2011;34(5):829–36. doi: 10.1007/s12272-011-0517-1. [DOI] [PubMed] [Google Scholar]
- 56.Kang KW. Angiotensin II-mediated Nrf2 down-regulation: a potential causing factor for renal fibrosis? Arch Pharm Res. 2011;34(5):695–7. doi: 10.1007/s12272-011-0500-x. [DOI] [PubMed] [Google Scholar]
- 57.Shin DH, Park HM, Jung KA, Choi HG, Kim JA, Kim DD, Kim SG, Kang KW, Ku SK, Kensler TW, Kwak MK. The NRF2-heme oxygenase-1 system modulates cyclosporin A-induced epithelial-mesenchymal transition and renal fibrosis. Free Radic Biol Med. 2010;48(8):1051–63. doi: 10.1016/j.freeradbiomed.2010.01.021. [DOI] [PMC free article] [PubMed] [Google Scholar]
- 58.Oh GS, Lee SB, Karna A, Kim HJ, Shen A, Pandit A, Lee S, Yang SH, So HS. Increased Cellular NAD+ Level through NQO1 Enzymatic Action Has Protective Effects on Bleomycin-Induced Lung Fibrosis in Mice. Tuberc Respir Dis. 2016;79(4):257–266. doi: 10.4046/trd.2016.79.4.257. [DOI] [PMC free article] [PubMed] [Google Scholar]
- 59.Blobe GC, Schiemann WP, Lodish HF. Role of transforming growth factor beta in human disease. N Engl J Med. 2000;342(18):1350–8. doi: 10.1056/NEJM200005043421807. [DOI] [PubMed] [Google Scholar]
- 60.Acloque H, Adams MS, Fishwick K, Bronner-Fraser M, Nieto MA. Epithelial-mesenchymal transitions: the importance of changing cell state in development and disease. The Journal of Clinical Investigation. 2009;119(6):1438–1449. doi: 10.1172/JCI38019. [DOI] [PMC free article] [PubMed] [Google Scholar]
- 61.Montorfano I, Becerra A, Cerro R, Echeverria C, Saez E, Morales MG, Fernandez R, Cabello-Verrugio C, Simon F. Oxidative stress mediates the conversion of endothelial cells into myofibroblasts via a TGF-beta1 and TGF-beta2-dependent pathway. Lab Invest. 2014;94(10):1068–82. doi: 10.1038/labinvest.2014.100. [DOI] [PubMed] [Google Scholar]
- 62.Saika S. TGFbeta pathobiology in the eye. Lab Invest. 2006;86(2):106–15. doi: 10.1038/labinvest.3700375. [DOI] [PubMed] [Google Scholar]
- 63.Pasquale LR, Dorman-Pease ME, Lutty GA, Quigley HA, Jampel HD. Immunolocalization of TGF-beta 1, TGF-beta 2, and TGF-beta 3 in the anterior segment of the human eye. Invest Ophthalmol Vis Sci. 1993;34(1):23–30. [PubMed] [Google Scholar]
- 64.Yamamoto N, Itonaga K, Marunouchi T, Majima K. Concentration of Transforming Growth Factor β2 in Aqueous Humor. Ophthalmic Research. 2005;37(1):29–33. doi: 10.1159/000083019. [DOI] [PubMed] [Google Scholar]
- 65.Okumura N, Hashimoto K, Kitahara M, Okuda H, Ueda E, Watanabe K, Nakahara M, Sato T, Kinoshita S, Tourtas T, Schlötzer-Schrehardt U, Kruse F, Koizumi N. Activation of TGF-β signaling induces cell death via the unfolded protein response in Fuchs endothelial corneal dystrophy. Scientific Reports. 2017;7:6801. doi: 10.1038/s41598-017-06924-3. [DOI] [PMC free article] [PubMed] [Google Scholar]
- 66.Yang L, Qu M, Wang Y, Duan H, Chen P, Shi W, Danielson P, Zhou Q. Trichostatin A inhibits transforming growth factor-beta-induced reactive oxygen species accumulation and myofibroblast differentiation via enhanced NF-E2-related factor 2-antioxidant response element signaling. Mol Pharmacol. 2013;83(3):671–80. doi: 10.1124/mol.112.081059. [DOI] [PubMed] [Google Scholar]
- 67.Yu H, Huang J, Wang S, Zhao G, Jiao X, Zhu L. Overexpression of Smad7 suppressed ROS/MMP9-dependent collagen synthesis through regulation of heme oxygenase-1. Mol Biol Rep. 2013;40(9):5307–14. doi: 10.1007/s11033-013-2631-2. [DOI] [PubMed] [Google Scholar]
- 68.Felton VM, Borok Z, Willis BC. N-acetylcysteine inhibits alveolar epithelial-mesenchymal transition. Am J Physiol Lung Cell Mol Physiol. 2009;297(5):31. doi: 10.1152/ajplung.00009.2009. [DOI] [PMC free article] [PubMed] [Google Scholar]
- 69.Zhou W, Mo X, Cui W, Zhang Z, Li D, Li L, Xu L, Yao H, Gao J. Nrf2 inhibits epithelial-mesenchymal transition by suppressing snail expression during pulmonary fibrosis. Sci Rep. 2016;6(38646) doi: 10.1038/srep38646. [DOI] [PMC free article] [PubMed] [Google Scholar]
- 70.Cai Z, Lou Q, Wang F, Li E, Sun J, Fang H, Xi J, Ju L. N-acetylcysteine protects against liver injure induced by carbon tetrachloride via activation of the Nrf2/HO-1 pathway. Int J Clin Exp Pathol. 2015;8(7):8655–62. [PMC free article] [PubMed] [Google Scholar]
- 71.Ji Y, Dai Z, Wu G, Wu Z. 4-Hydroxy-2-nonenal induces apoptosis by activating ERK1/2 signaling and depleting intracellular glutathione in intestinal epithelial cells. Sci Rep. 2016;6(32929) doi: 10.1038/srep32929. [DOI] [PMC free article] [PubMed] [Google Scholar]
- 72.Ji L, Liu R, Zhang XD, Chen HL, Bai H, Wang X, Zhao HL, Liang X, Hai CX. N-acetylcysteine attenuates phosgene-induced acute lung injury via up-regulation of Nrf2 expression. Inhal Toxicol. 2010;22(7):535–42. doi: 10.3109/08958370903525183. [DOI] [PubMed] [Google Scholar]
- 73.Ziaei A, Schmedt T, Chen Y, Jurkunas UV. Sulforaphane decreases endothelial cell apoptosis in fuchs endothelial corneal dystrophy: a novel treatment. Invest Ophthalmol Vis Sci. 2013;54(10):6724–34. doi: 10.1167/iovs.13-12699. [DOI] [PMC free article] [PubMed] [Google Scholar]
- 74.Yalcin E, Altin F, Cinhuseyinoglue F, Arslan MO. N-acetylcysteine in chronic blepharitis. Cornea. 2002;21(2):164–8. doi: 10.1097/00003226-200203000-00007. [DOI] [PubMed] [Google Scholar]
- 75.Schmidl D, Werkmeister R, Kaya S, Unterhuber A, Witkowska KJ, Baumgartner R, Holler S, O'Rourke M, Peterson W, Wolter A, Prinz M, Schmetterer L, Garhofer G. A Controlled, Randomized Double-Blind Study to Evaluate the Safety and Efficacy of Chitosan-N-Acetylcysteine for the Treatment of Dry Eye Syndrome. J Ocul Pharmacol Ther. 2017;33(5):375–382. doi: 10.1089/jop.2016.0123. [DOI] [PubMed] [Google Scholar]
Associated Data
This section collects any data citations, data availability statements, or supplementary materials included in this article.
Supplementary Materials
MN and TGF-β1 induces rosette formation in HCEnCs in a time- and dose-dependent manor. HCEnCs were subjected to 25 or 50μM MN, with or without the addition of 10ng/ml TGF-β1 for 1–5 hours. Changes in cell morphology were observed with phase-contrast microscopy, with black stars indicating the presence of rosettes. Bars = 50μm.
NAC inhibits rosette formation in HCECs. Phase-contrast microscopy revealed that cells treated with TGF-β1 alone failed to produce rosettes. Addition of NAC to the MN +/− TGF-β1 treatments groups prevented the distinctive rosette formation as seen in Supplement 1.
TGF-β1 upregulates Snail1 and acts synergistically with MN in pre-starved HCEnCs. HCEnCs were pre-starved in low-glucose DMEM for 24 hours before an extended 24-hour treatment with TGF-β1 (A), +/− 25μM MN for the final 3 hours (B). Snail1 mRNA expression was examined with RT-PCR. Statistical significance tested using a Student’s t-test (n =3).