

Abstract
Rett Syndrome (RTT) is an X-linked, neurodevelopmental disorder caused primarily by mutations in the Methyl-CpG-binding protein 2 (MECP2) gene, which encodes a multifunctional epigenetic regulator with known links to a wide spectrum of neuropsychiatric disorders. While postnatal functions of MeCP2 have been thoroughly investigated, its role in prenatal brain development remains poorly understood. Given the well-established importance of miRNAs in neurogenesis, we employed isogenic human RTT patient-derived induced pluripotent stem cell (iPSC) and MeCP2 shRNA knockdown approaches to identify novel MeCP2-regulated miRNAs enriched during early human neuronal development. Focusing on the most dysregulated miRNAs, we found miR-199 and miR-214 to be increased during early brain development and to differentially regulate extracellular signal-regulated kinase (ERK/MAPK) and protein kinase B (PKB/AKT) signaling. In parallel, we characterized the effects on human neurogenesis and neuronal differentiation brought about by MeCP2 deficiency using both monolayer and 3D (cerebral organoid) patient-derived and MeCP2-deficient neuronal culture models. Inhibiting miR-199 or miR-214 expression in iPSC-derived neural progenitors (NPs) deficient in MeCP2 restored AKT and ERK activation, respectively, and ameliorated the observed alterations in neuronal differentiation. Moreover, overexpression of miR-199 or miR-214 in WT mouse embryonic brains was sufficient to disturb neurogenesis and neuronal migration in a similar manner to Mecp2 knockdown. Taken together, our data support a novel miRNA-mediated pathway downstream of MeCP2 that influences neurogenesis via interactions with central molecular hubs linked to autism spectrum disorders.
INTRODUCTION
microRNAs (miRNAs) are an evolutionarily conserved subtype of small noncoding RNAs enriched in the mammalian brain that interact with the majority of protein-coding genes to inhibit protein translation and mRNA stability1-3. In recent years, numerous reports have made a compelling case for the importance of miRNAs in prenatal and adult neurogenesis, brain maturation, and synaptic plasticity2-4. Unsurprisingly, given the above, a subset of miRNAs has been shown to be altered in neurodevelopmental and neurological disorders and to contribute to essential molecular networks underlying brain disease pathophysiology2, 3.
Rett syndrome (RTT) is a pervasive neurodevelopmental disorder with early onset that is predominantly caused by mutations that disrupt the function of the X-linked gene MECP25. MeCP2 is known to influence the expression of a wide pool of downstream targets, among which are miRNAs6. Governing this miRNA regulation are interactions between MeCP2 and nuclear miRNA transcription and processing machineries7-10. RTT is a leading cause of intellectual disability in females, resulting in critical disturbances in motor coordination, seizures, autism-like behavior, and respiratory and cardiac abnormalities11. Although initial observations had suggested that female RTT patients appear relatively normal at birth and during very early stages of development, increasing evidence suggests early developmental delays in female RTT patients12, 13. Males born with the mutant MECP2 allele, although very rare due to the predominately paternal origin of MECP2 mutations, display severe neurological deficits from birth, characteristic of a prenatal pathogenesis14, 15.
Existing data on the effectiveness of a subset of postnatal treatment options for RTT mouse models have demonstrated the potential for reversibility of a subset of disease symptoms6, 16-20. However, they have also been interpreted as evidence of an exclusively postnatal pathogenesis of RTT. Due to the above, as well as the findings of increased postnatal expression of Mecp2, the vast majority of studies on RTT have thus far focused on the role of Mecp2 in postnatal brain development and maturation21-23. However, as Mecp2 is also expressed in the prenatal brain23, 24, it remains plausible that it plays a role in embryonic brain development as well. Indeed, recent reports demonstrate that artificially increasing Mecp2 levels in mouse neural progenitor (NP) cultures and chick embryonic neural tubes can impair neurogenesis and lead to premature neuronal differentiation25, 26. On a similar note, measurement of neural precursor and early neuronal marker expression in Mecp2 KO embryonic brains has suggested a potential imbalance in prenatal brain development27.
Furthermore, iPSC models of genetically engineered and RTT patient-derived neuronal cultures have demonstrated the presence of structural, physiological, and molecular disease-related phenotypes during early developmental stages28-32. Specifically, a pivotal study using iPSCs demonstrated reduction in soma size, spine density, neuronal firing, and activity-dependent calcium signaling in RTT iPSC-derived neurons31. Two additional studies later demonstrated that RTT iPSC-derived neurons displayed alterations in neuronal maturation seen through reductions in the expression of the mature neuronal marker Tuj129, as well as aberrant electrophysiological properties, with specific deficiencies in inward currents and action potentials in conjunction with altered sodium channel function28. Furthermore, an additional study reported reduced nuclear and soma size, dendritic complexity, and both excitatory and inhibitory neuronal marker staining, as well as reduced neuronal firing and activity-dependent transcription30. Lastly, two recent studies reported potential alterations in neuronal differentiation, migration, and branching in RTT iPSC-derived neurons32, 33, and highlighted the role of RTT patient-derived astrocytes on the observed neuronal abnormalities32. However, the effects of MeCP2-deficiency in early human neurogenesis and neuronal differentiation and the mechanisms that could underlie them have not been investigated to date in monolayer and 3D models of RTT.
We hypothesized that neurogenesis may be impacted in RTT via MeCP2-regulated miRNAs that modulate critical molecular components of neural progenitor proliferation and differentiation. Utilizing human patient- and MeCP2 knockdown-derived monolayer and 3D neuronal culture models, we have uncovered significant alterations in neurogenesis and neuronal differentiation. Intriguingly, our findings implicate miR-199 and miR-214, two miRNAs robustly upregulated in RTT patient and MeCP2-deficient neuronal progenitors, as important effectors of early neuronal development via their differential effects on AKT and ERK pathway signaling. Overall, our data describe a novel miRNA-mediated molecular cascade downstream of MeCP2 that utilizes known autism spectrum disorder (ASD) pathways to regulate prenatal brain development.
MATERIALS AND METHODS
Human Fibroblast Culture
Fibroblasts from two clinically diagnosed RTT female patients (GM11273 = RTT-Mut1, and GM07982 = RTT-Mut2) and one unrelated, unaffected male (GM08330 = WT1) were purchased from Coriell Institute for Medical Research. Cells were grown in flasks coated with 0.1% gelatin (EMD Millipore), and grown in fibroblast media composed of 10% heat-inactivated FBS (Gemini Bio-Products), 1% Penicillin/Streptomycin (Invitrogen), 1% non-essential amino acids (Invitrogen) and 88% DMEM (Invitrogen) filtered through a 0.22 μm bottle-top low protein-binding PES filter.
Fibroblast Reprogramming and iPSC Expansion
Retroviruses were generated by tripartite transient transfection of pIK-MLV (gag.pol), pHDM-G (VSV), and the specific pMIG vectors carrying the hOCT4, hSOX2, hKLF4 or hc-MYC genes into 293T cells as previously described34, 35. Fibroblasts were plated in single wells of 6-well plates (Corning) at 105 cells per well. These cells were then transduced for 24 hours with the four retroviruses with a multiplicity of infection (MOI) of 10 for pMIG-hOCT4-IRES-GFP (Addgene), pMIG-hSOX2-IRES-GFP (Addgene) and pMIG-hKLF4-GFP (Addgene) and MOI of 1 for MCSV-hc-MYC-IRES-GFP (Addgene). After 24 hours, cells were washed with PBS and fresh media was added, and five days later cells were passaged onto 10 cm gelatin-coated dishes with γ-irradiated mouse embryonic fibroblasts (MEFs) (GlobalStem). The next day the media was changed to iPSC media: 20% Knock-out Serum Replacement (KOSR, Invitrogen), 1% penicillin/streptomycin (Invitrogen), 1% non-essential amino acids (Invitrogen), 0.5% L-glutamine (Invitrogen), 100 μM 2-mercaptoethanol (Bio-Rad), 77.5% DMEM/F-12 (Invitrogen), and 10 ng/mL bFGF (Stemgent) filtered through a 0.22 μm PES filter (EMD Millipore). Dishes had daily media changes until colonies emerged (3 to 6 weeks after transduction). Colonies were first assessed based on morphology, then for silencing of the retroviral vectors (GFP-negative) before being mechanically passaged onto gelatin coated 6-well plates (Corning) with MEFs (GlobalStem) as feeders. Using these methods, multiple clones from each line were chosen for expansion, cryopreservation, and further characterization. In addition to those iPSC created here, iPSCs from an unaffected female control (WT2) were obtained from Coriell Institute for Medical Research (GM23279).
Reprogrammed colonies were picked into separate wells and subsequently grown as separate clones. The first several passages were grown directly on a feeder layer of MEFs (GlobalStem). For removal of MEFs for downstream RT-PCR and embryoid body formation, iPSCs were grown by indirect co-culture with MEFs (GlobalStem) on Matrigel-coated (Corning) polyethylene terephthalate (PET) inserts with 1.0 μm pore-size in 6-well plates (Corning) in iPSC media as described36.
iPSC lines were characterized by alkaline phosphatase expression in live cells (Millipore Detection Kit as per vendor instructions) and by immunocytochemical (ICC) analysis of 4% paraformaldehyde (PFA) fixed undifferentiated colonies. Primary antibodies used for ICC analyses of pluripotent markers: anti-OCT-4 (Santa Cruz, sc-5270), anti-Nanog (Abcam, ab21624), DyLight 488 anti-Tra1-60 (Stemgent, 09-0010) and DyLight 550 anti-SSEA4 (Stemgent, 09-0097). 4G-Band Karyotype analysis was performed on feeder-free iPSC cultures by Cell Line Genetics (http://www.clgenetics.com). Tri-lineage germ layer potency was assessed by embryoid body formation as described37. Briefly, embryoid bodies (EBs) were formed in ultra-low attachment 6-well plates (Corning) in iPSC media without bFGF and 1% heat-inactivated FBS (Gemini Bio-Products). After 20-28 days EBs were fixed in 4% PFA followed by embedding in 1% low-melting temperature agarose. These EB containing agarose pellets were further paraffin embedded, sectioned (5 μM), mounted and followed by hematoxylin and eosin staining, which was performed at the Dana-Farber/Harvard Cancer Center Rodent Histopathology Core Facility.
Neural Differentiation of iPSC Clones
Neural differentiation was initiated from iPSC clones grown under feeder-free conditions to remove MEFs by indirect co-culture with conditioning feeder layers on Matrigel-coated (Corning) 1 μm porosity membrane inserts as described36. For the first set of RTT patient and control (RTT-Mut1 and WT1), neural differentiation was initiated by the formation of embryoid bodies. Briefly, in order to form embryoid bodies, iPSC colonies grown by indirect co-culture were broken up and plated in ultra-low attachment 6-well plates (Corning) in iPSC media supplemented with 20ng/ml bFGF (Stemgent) and 1% heat-inactivated FBS (Gemini Bio-Products) for a minimum of 19 days. NPs were initially isolated by magnetic-activated cell sorting (MACS) using magnetic particles conjugated with antibodies to the polysilated form of neural cell adhesion molecule (PSA-NCAM; Miltenyi Biotech). Isolated cells were expanded in neural expansion medium ((70% DMEM (Invitrogen), 30% Ham’s F-12 (Mediatech) supplemented with B-27 (Invitrogen), 20 ng/ml each EGF (Sigma), and bFGF (R&D Systems)) on poly-ornithine (Sigma)/laminin (Sigma)-coated culture plates. Further purification was performed after initial expansion by fluorescence activated cell sorting (FACS). Sorting was performed at the Massachusetts General Hospital Pathology Flow and Image Core Lab using a Becton-Dickinson 5 Laser Vantage SE DIVA with Sheath Pressure of 20 PSI and 50.2 MHZ drop drive frequency. Cells were stained with CD15 (SSEA1)-FITC (Becton-Dickinson Biosciences, 340703), CD184 (CXCR-4)-APC (Becton-Dickinson Biosciences, 555976), and CD271 (p75)-PerCP-Cy5.5 (Becton-Dickinson Biosciences, 560834) antibodies per vendor protocol. CD15+, CD184+, CD271- cells were collected and further expanded on poly-ornithine/laminin plates in neural expansion media as described above. After five passages in expansion medium, cells were analyzed for Nestin and SOX1 expression by fixation in 4% PFA followed by primary incubation with antibodies against Nestin (Millipore, ab5922) and SOX1 (Millipore, ab15766), and subsequent secondary antibody incubation (Alexa Fluor, Molecular Probes, A-21202, A-31572, A-21449) for 1 hour at room temperature. For RTT patient 2 mutant, isogenic control and non-related unaffected control samples (RTT-Mut2, RTT-WT2, and WT2, respectively), iPSCs were differentiated into NPs and then neurons as previously described38. Briefly, iPSC were cultured on feeder free matrigel coated wells in mTeSR1 (Stemcell Technologies) until confluent, at which point neural induction media containing 10 μM SB431542 (Tocris Bioscience) and 1 μM dorsomorphin (Stemgent) was used for 8-12 days to generate NPs. These NPs were further expanded in neural maintenance media for 8 days with 10 ng/ml of FGF2 (PeproTech) added upon the appearance of rosettes (Day ~4). NPs derived from both methods were plated at 100,000 cells/cm2 for 3 days (NP harvest) or differentiated for 3-14 weeks days at 20,000 cells/cm2 in neural maintenance media (neuronal harvest), and were fed every 3-5 days until the indicated endpoint time. In the case of prolonged (14 week) differentiation cultures treatment with Ara-C (Sigma-Aldrich, C1768) at a final concentration of 5 uM was used when needed to prevent the overgrowth of non-neuronal cell types. Cell pellets were collected by manual scraping, pelleting, and cryopreservation at −80°C until analysis.
Cerebral organoids
Generation
Cerebral organoids were generated from unaffected WT (WT2) iPSCs as previously described39. Briefly, iPSCs were detached from irradiated MEFs and plated at 9×10⁴ per well of an ultralow attachment 96-well plate (Corning) in human ES media supplemented with FGF (4 ng/mL) and Rho associated protein kinase (ROCK) inhibitor (50 μM; Y-27632, Tocris) (Day 0). Embryoid bodies (EBs) were subsequently transferred to N2-based neural induction media (Day 6) in an ultra-low attachment 24-well plate (Corning). EBs were embedded in Matrigel droplets (Corning) on Day 11 and transferred to neural differentiation media supplemented with B27 without vitamin A (Gibco, Life Technologies). On Day 15, embedded EBs were transferred to a shaker and grown in neural differentiation media supplemented with B27 with vitamin A (Gibco, Life Technologies). Patient-derived organoids (RTT-Mut2 and RTT-WT2) were generated as described above with the modification of the addition of dual-SMAD inhibition ((10 μM SB431542 (Tocris Bioscience); 1 μM dorsomorphin (Stemgent)) during the neural induction phase, in order to increase yield of high-quality organoids with a robust neural identity.
Electroporation
Organoids (specifically, the “ventricles” or progenitor zones) were electroporated with either a MeCP2 shRNA construct (validated sequence from Sigma; TRCN0000330971) or control (SHC001, Sigma), each co-injected with a Venus construct (pCAGIG-Venus; gift from Omar Durak and Prof. Li-Huei Tsai) at 8 weeks post-EB formation. Indicated plasmids were mixed at the following concentrations: shRNA (shMeCP2) / control (shControl) plasmids, 1 μg/ μl; pCAG-Venus plasmid, 0.5 μg/μl. Immediately after DNA injection into the organoid, four 50-ms electrical pulses (40V) were applied at 1-s intervals using a 5-mm electrode and an electroporator (EM830, BTX). After 7 days, organoids were fixed (4% PFA) and cryoprotected in 20% and 30% sucrose solutions, respectively, overnight. Fixed organoids were sliced on a cryostat (Leica, CM 3050 S) into 20 μM sections. For tracing migration of newly born neurons, cerebral organoids from Rett-WT2 and RTT-Mut2 cells were co-injected with pCAGIG-Venus and fluorescence beads (Molecular Probes; F13082) that mark the location of the injected ventricles.
Immunocytochemical Analysis
Primary staining of sections from cerebral organoids was performed overnight at 4°C and secondary at room temperature for 1 hour (Alexa Fluor, Molecular Probes). The following primary antibodies were used: MAP2 (Encor Biotechnology 1:1000, CPCA-MAP2); DCX (Aves Labs, 1:200, DCX); PAX6 (Millipore; 1:200, ab2237); Pax6 (DSHB 1:100, PAX6); TBR2 (Abcam; 1:400, ab23345); TBR1 (Abcam 1:400, ab31940). Coverlips were affixed with ProLong Gold antifade reagent with DAPI (Life Technologies) and z-stacks were acquired using either a Leica TCS SP8 or a Zeiss Axiovert microscope. Analysis was performed in ImageJ.
*Additional Materials and Methods can be found in Supplemental Materials.
RESULTS
miRNA dysregulation in MeCP2-knockdown and RTT patient-derived neuronal cultures
To create RTT patient-derived neuronal cultures, fibroblasts from two clinically diagnosed female RTT patients were used: i) GM11273, or “RTT-Mut1”, which carried a single nucleotide substitution (missense mutation, 316C>T) in the methyl-cytosine-binding domain of MECP2, and ii) GM07982, or “RTT-Mut2”, which harbored a single nucleotide deletion (frameshift 705delG) in the transcriptional repression domain that results in premature termination of the MeCP2 transcript (Figure 1a,b). RTT-Mut1 and RTT-Mut2 fibroblasts were reprogrammed to generate iPSCs (Figure 1a,b) using retroviral-mediated transient expression of OCT4, SOX2, cMYC, and KLF4, together with one unaffected male control (GM08330, or “WT1”). Furthermore, we acquired an additional healthy control female iPSC line (GM23279, or “WT2”) generated by the same retroviral-mediated technique34, 35. Pluripotency in all 5 iPSC lines was confirmed via marker analysis (alkaline phosphatase, OCT4, NANOG, Tra1-60, and SSEA4) and embryoid body differentiation demonstrating characteristic ectodermal, endodermal and mesodermal structures, and normal karyotype was validated by G-banding (Supplementary Figure S1a-c).
Figure 1. Mature miRNA profiling in RTT patient-derived NPs and neurons.
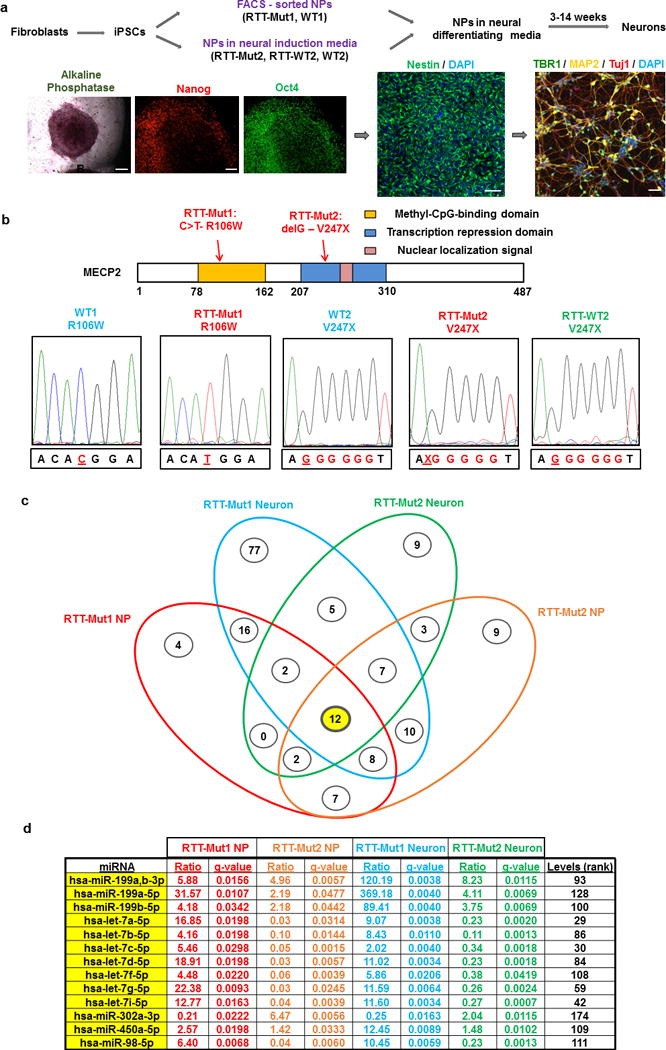
(a) Top: methods of NP derivation and neuronal differentiation for each of the different iPSC-derived RTT patient and control lines. Bottom: Representative examples of immunofluorescence and staining showing markers of pluripotency (Alkaline Phosphatase, Nanog, OCT4) in patient/control-acquired iPSCs, as well as NP (Nestin) and neuronal markers (TBR1, MAP2, Tuj1). Scale bars: 100 μm. (b) Top: Schematic of human MeCP2 functional domains and location of mutations for the two RTT patients examined (RTT-Mut1, RTT-Mut2). Bottom: cDNA sequencing results verifying the presence of the two different RTT-related mutations. WT1,2 controls and RTT-WT2 isogenic controls are also shown. (c) Four-way Venn diagram showing the significantly altered miRNAs in RTT-Mut1 (relative to WT1) and RTT-Mut2 (relative to RTT-WT2) NPs and immature (~3week) neurons based on NanoString miRNA profiling. The numbers of altered miRNAs for each intersection between different groups are shown inside cirlces. The 12 miRNAs that are altered in all four conditions are highlighted in yellow and are shown below (d). (d) Table showing the fold changes (ratio) and q-values (see Supplementary Materials and Methods) of the 12 miRNAs that were altered in all four conditions. Their rank based on average expression (from highest to lowest) is also shown (Levels (rank)).
We utilized two complementary methods for promoting neuronal lineage in each of the two RTT patient-derived iPSCs (Figure 1a). For RTT-Mut1 and the first unaffected control (WT1), we manually picked neural rosettes and used fluorescence-activated cell sorting (FACS) to isolate CD184+, CD271- homogeneous NPs (Figure 1a). Additionally, we used dual-SMAD inhibition38 to generate NPs from iPSCs of the second unaffected control (WT2) and the second RTT patient and isogenic control (RTT-Mut2 and RTT-WT2) (Figure 1a). All NPs were characterized via immunostaining with NP markers including Nestin, PAX6, SOX1, and Musashi (Figure 1a, and Supplementary Figure S1d), and were differentiated into neurons for approximately three to fourteen weeks (Figure 1a).
Screening of miRNA expression was carried out in iPSC-derived NPs and immature (~three weeks of differentiation) neurons from the first patient and control (RTT-Mut1 and WT1) as well as the second patient and its isogenic control (RTT-Mut2 and RTT-WT2), using NanoString nCounter miRNA analysis— a technique capable of specifically detecting mature miRNAs without any amplification steps (see also: Supplementary Materials and Methods). Results uncovered numerous differentially affected miRNAs, twelve of which were significantly altered in both proliferative NP and post-mitotic differentiated neural developmental stages and in both RTT patient lines (Figure 1c,d and Supplementary Table S1). Among them, the most robust changes were in multiple members of the miR-199 and let-7 miRNA families, which were significant after correction for multiple comparisons based on false discovery (FDR) and q-value calculations (Figure 1c,d and Supplementary Table S1). However only the miR-199 family—consisting of miR-199a-5p (produced from both miR-199a-1 and miR-199a-2 precursors – see also Supplementary Figure S2a), miR-199b-5p, and miR-199a,b-3p (identical 3p sequence showing the highest overall expression and produced from both miR-199a-1,2 and miR-199b – see also Supplementary Figure S2a) showed a consistent and robust upregulation in both developmental stages and RTT mutant lines (Figure 1c,d and Supplementary Table S1). Validation with qRT-PCR to measure mature miRNA levels demonstrated a strong correlation to the NanoString results for the miRNAs tested (Supplementary Figure S2b). Results from qRT-PCR measuring levels of miR-199a,b-3p (the most highly expressed of the miR-199 family; heretofore referred to as just miR-199) and the co-expressed (together with miR-199a-2) miRNA miR-214 (see also Supplementary Figure S2a) revealed dramatic increases in expression in both RTT-Mut1 and RTT-Mut2 NPs and three-week neuronal cultures (Figure 2a,b). Less consistent results between the two RTT patient-derived NP lines were seen for let-7 miRNAs, particularly at the neuronal stage (Supplementary Figure S2c,d). The increases in miR-199 and miR-214 in RTT-Mut2 vs RTT-WT2 were also observed at much later stages of neuronal differentiation (14 weeks) (Figure 2c).
Figure 2. Increased miR-199 and miR-214 levels in patient- and shRNA-mediated models of RTT.

(a) Validation of NanoString miRNA profiling results for upregulated miR-199/214 miRNAs using mature miRNA-specific qRT-PCR in patient-derived mutant (RTT-Mut1 and RTT-Mut2 – red bars) and control (WT1, WT2 in blue bars and RTT-WT2 in green bars) NPs. All values are shown as mean ± SEM relative to WT control ratios. Stars depict statistical significance based on two-tailed one sample t-test (WT1, RTT-Mut1) or ANOVA (WT2, RTT-Mut2, RTT-WT2) with Sidak’s multiple comparisons test (*p < 0.05, **p < 0.01, ***p < 0.001). Number of biological replicates (N): WT1 = 6, RTT-Mut1 = 6, WT2 = 8, RTT-mut2 = 8, RTT-WT2 = 5. (b) Quantification of miR-199/214 miRNA expression using mature miRNA-specific qRT-PCR in patient-derived mutant (RTT-Mut1 and RTT-Mut2 – red bars) and control (WT1, WT2 in blue bars and RTT-WT2 in green bars) three-week differentiated neurons. All values are shown as mean ± SEM relative to WT control ratios. Stars depict statistical significance based on Mann-Whitney test (WT1, RTT-Mut1) or ANOVA (WT2, RTT-Mut2, RTT-WT2) with Sidak’s multiple comparisons test (*p < 0.05, ***p < 0.001). N: WT1 = 6, RTT-Mut1 = 8, WT2 = 9, RTT-Mut2 = 8, RTT-WT2 = 5. (c) Mean ± SEM relative to RTT-WT2 miR-199 and miR-214 levels in RTT-WT2 (green bars) and RTT-Mut2 (red bars) 14 week differentiated neurons. Stars depict statistical significance based on two-tailed one sample t-test (*p < 0.05). N: RTT-mut2 and RTT-WT2 = 6 (2 techical replicates of 3 samples). (d) Mean ± SEM relative to control MeCP2 mRNA levels (normalized to 18S rRNA) in MeCP2 shRNA (shMeCP2 – red bar) and shRNA control (shControl – blue bar) expressing NPs and differentiated neurons. Stars depict statistical significance based on two-tailed one sample t-test (***p < 0.001). N: shControl-NPs = 5, shMeCP2-NPs = 5, shControl-Neurons = 6, shMeCP2-Neurons = 6. (e) Mean ± SEM relative to control miR-199 and miR-214 levels in MeCP2 shRNA (shMeCP2 – red bar) and control (shControl – blue bar) expressing NPs. Stars depict statistical significance based on two-tailed one sample t-test (**p < 0.01). N: shControl = 7, shMeCP2 = 7. (f) Mean ± SEM relative to shControl NP stage miR-199 and miR-214 levels in MeCP2 shRNA (shMeCP2 – red bar) and control (shControl – blue bar) expressing 7 week differentiated neurons. Dotted line shows miRNA levels of shControl NPs for comparison. Stars depict statistical significance based on two-tailed Student’s t-test (*p < 0.05). N: shControl = 5, shMeCP2 = 5. (g-h) Graphs showing mean ± SEM relative miR-199a-3p (g), miR-214 (h) in embryonic brain (E12.5), perinatal (P0), and postnatal (P28) brain from WT and Mecp2 mutant (MT) mice. All data are shown as relative to E12.5 WT ratios. Stars depict statistical significance based on two-tailed Mann-Whitney test (**p < 0.01). N: E12.5 WT = 16, E12.5 MT = 5, P0 WT = 5, P0 MT = 5, P28 WT = 5, P28 MT = 5. Small RNAs RNU44 and snoRNA202 were used as normalizers in all human and mouse miRNA qRT-PCRs, respectively.
In order to distinguish between a transcriptional or miRNA processing mechanism underlying the observed increases in miR-199 and miR-214 mature miRNAs in RTT patient-derived cultures, we measured the expression of the primary miRNA precursors (pri-miRNAs) from which mature miR-199 and miR-214 are encoded. Notably, all of the three separate pri-miRNAs that produce identical mature miR-199 sequences and the one pri-miRNA responsible for mature miR-214 synthesis (see also Supplementary Figure S2a) displayed significant reductions (Supplementary Figure S2e). Such a discordance between mature and pri-miRNA expression excludes a transcriptional mechanism and suggests a disturbance in miRNA processing.
We then developed a second isogenic pair of NPs by stably transducing the WT1 NP line with a vector harboring a MeCP2 shRNA insert (shMeCP2) or no insert (shControl) via lentiviral infection. As expected, shMeCP2 samples showed significant reductions in MeCP2 levels at both the NP and neuronal stage (Figure 2d). We subsequently measured miR-199 and miR-214 levels in MeCP2 shRNA NPs using mature miRNA-specific qRT-PCR. Notably and as expected, significant increases in miR-199 and miR-214 were observed in shMeCP2 NPs relative to the shControl isogenic controls (Figure 2e). Following 7 weeks of neuronal differentiation, however, miR-199 was the only one of the two miRNAs still exhibiting a significant upregulation and consistently expressed across differentiation stages. miR-214 did not show a significant increase in shMeCP2 neurons relative to shControl at this timepoint, yet was characterized by a robust developmental increase in shMeCP2 neurons relative to shMeCP2 NPs (Figure 2f).
Given the current inability of iPSC-derived neuronal cultures to reach a level of maturity reminiscent of the human postnatal brain, we re-analyzed the expression of the three miR-199 family miRNAs and miR-214 based on publicly available RNA sequencing results from the Brainspan Atlas of the Developing Brain. This data included multiple brain regions from human postmortem brains from infancy to early adulthood (see also: Supplementary Materials and Methods). Our results revealed miR-199 (miR-199a,b-3p) as by far the most highly expressed in the human postnatal brain among the four miRNAs queried, yet with different developmental trajectories between hippocampus (HIP), ventrolateral prefrontal cortex (VFC) and dorsolateral prefrontal cortex (DFC) (Supplementary Figure 2f-h). To further determine the species- specific differences in miR-199 and miR-214 expression we measured their levels in mouse adult brain, rat adult and late embryonic brain (E20), as well as adult Rhesus macaque brain (Supplementary Figure 2i-j). Our results showed a close to 4-fold and 2-fold decrease in miR-199 and miR-214 expression, respectively, in rat adult vs rat E20 whole brain (Supplementary Figure 2i), as well as increases in both miR-199 and miR-214 expression in rat vs mouse and Rhesus vs mouse adult brain (Supplementary Figure 2j). As a control a highly expressed miRNA let-7e was lower in rat embryonic vs adult brain and showed reduced expression in rat vs mouse brain (Supplementary Figure 2i-j). To elucidate the developmental stage-specific expression of mouse miR-199 and miR-214 as a result of Mecp2 deficiency, we measured their levels in the brains of embryonic, perinatal, and postnatal (cortex-specific) WT and Mecp2 mutant mice (both male null and female heterozygous mice). Our results revealed a transient, robust expression of both miR-199 and miR-214 around embryonic day E12.5, with levels subsequently dropping rapidly, and diminishing at birth and four postnatal weeks in WT mice (Figure 2g,h). Such a developmentally enriched expression pattern in the WT mouse brain has been shown before40, and is in contrast to the observed developmental patterns in human neuronal cultures and human postmortem brain. Notably, expression of the two miRNAs in the brain of Mecp2 mutant mice (n = three male null and three female heterozygote mice) displayed the same developmental expression peak during early neurogenesis. At E12.5, levels of both miR-199 and miR-214 were significantly higher in Mecp2 mutant mice relative to WT animals (Figure 2g,h), validating the observed upregulation of both miRNAs during the early stages of embryonic neurogenesis in an MeCP2- reduced or deficient context. Collectively, our data demonstrate a consistent and robust dysregulation of miR-199 and, to a lesser extent, miR-214 during early human neurogenesis as a result of MeCP2 deficiency, in contrast to a transient increase in both miRNAs in mouse embryonic Mecp2 mutant brains.
MeCP2 deficiency in monolayer and 3D neuronal cultures results in aberrant neurogenesis and neuronal differentiation
Given the known role of miRNAs in regulating neurogenesis and neuronal differentiation and the robust alterations observed in miR-199 and miR-214 expression, we hypothesized an aberrant early neuronal development in RTT patient-derived and MeCP2-deficient NPs and early neurons. Indeed, early neurons generated from RTT-Mut2 exhibited deficits in dendritic complexity, as well as significant reductions in Microtubule-associated protein 2 (MAP2), early neuronal marker Doublecortin (DCX) mRNA expression, which were not observed in isogenic RTT-WT2 lines (Figure 3a,b). We subsequently assayed the proliferation and differentiation balance in RTT-Mut2 neurons in comparison to WT and isogenic WT lines by means of a BrdU assay to measure the percentage of actively dividing cells. Notably, we found significantly higher numbers of BrdU-positive neurons in RTT-Mut2 cells in comparison to WT2 and isogenic RTT-WT2 neurons (Figure 3c,d), demonstrating an increase in the number of dividing cells in the mutant line. Similarly, three-week-old MeCP2-shRNA neurons displayed lower levels of MAP2 protein, DCX, and MAP2 mRNA expression, and reduced dendritic maturation and complexity (Figure 3e-h). Similar increases in cellular proliferation were observed in MeCP2-shRNA three-week cultures upon assaying BrdU incorporation (Figure 3i,j). Taken together, these data suggest that early neuronal differentiation deficits are robust and independent of both the nature of MeCP2 deficiency and the method of neuronal differentiation.
Figure 3. Alterations in neurogenesis and neuronal differentiation in RTT patient-derived and MeCP2-deficient neurons.
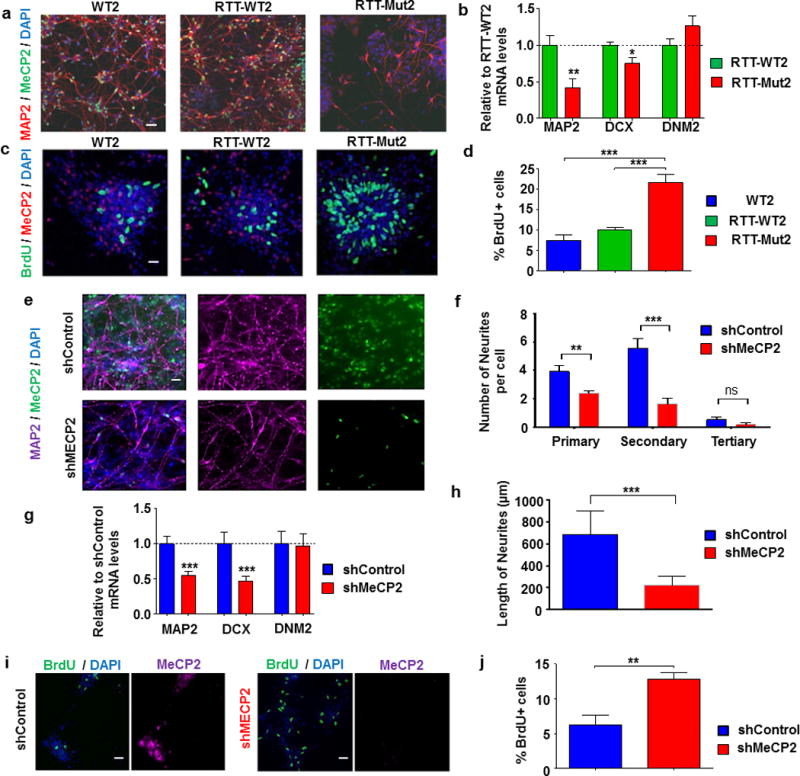
(a) Immunofluorescence for neuronal marker MAP2 in WT2, RTT-WT2, and RTT-Mut2 three-week differentiated neurons. MeCP2 immunostaining using a C-terminus antibody shows no expression in RTT-Mut2 neurons. (b) Graphs showing mean ± SEM relative to control MAP2 and DCX mRNA levels in the same three control and RTT patient-derived three-week neuronal samples. DNM2 mRNA is also shown as an example of non-altered mRNA expression. Stars depict statistical significance based on two tailed one sample t-test (*p < 0.05, **p < 0.01). N: RTT-Mut2 = 8, RTT-WT2 = 5. (c-d) BrdU labeling and MeCP2 staining (c) and BrdU quantification (d) in WT2, RTT-WT2, and RTT-Mut2 early born three-week neurons. Stars depict statistical significance based on ANOVA with Neuman Keuls test (***p < 0.001). N: WT2 = 7, RTT-mut2 = 8, RTT-WT2 = 6. (e) Immunofluorescence for neuronal marker MAP2 in MeCP2 shRNA (shMeCP2) and control (shControl) three week neurons. MeCP2 immunostaining shows no expression in shMeCP2 neurons. (f) Quantification of the number of primary, secondary, and tertiary neurites per cell reveals significant reductions in shMeCP2 cells (**p < 0.01, ***p < 0.001). N: shControl = 13, shMeCP2 = 13. (g) Graph showing mean ± SEM MAP2 and DCX mRNA relative expression following in MeCP2-shRNA and shControl three-week neurons. DNM2 mRNA is also shown as a control. N: shControl = 10, shMeCP2 = 10. (h) Graph showing mean ± SEM average neurite length in shMeCP2 vs shControl neuronal cultures (***p < 0.001). N: shControl = 12, shMeCP2 = 13. (i-j) BrdU labeling and MeCP2 staining (i) and BrdU quantification (j) in MeCP2-shRNA and shControl three-week neurons. N: shControl = 4, shMeCP2 = 3. Stars in (f),(h),(j) depict statistical significance based on two-tailed Student’s t-test (**p < 0.01, ***p < 0.001), and in (g) based on two-tailed one sample t-test (***p < 0.001). 18S rRNA was used as a normalizer for all mRNA qRT-PCRs.
Having observed MeCP2-based deficits in neurogenesis in monolayer culture, we sought to extend our findings of altered neurogenesis to a 3D human model of corticogenesis. Given that embryonic or perinatal postmortem tissue from RTT patients is not available, patient-derived cerebral organoids were generated from our isogenic RTT patient line (RTT-WT2 and RTT-Mut2) using a previously described protocol39 modified to include dual-SMAD inhibition during the neural induction phase (see also: Materials and Methods) in order to increase yield of high-quality organoids with a robust neural identity. Notably, a robust phenotype was observed following 5 weeks of organoid differentiation, in which RTT-Mut2 organoids exhibited increased ventricular area in comparison to the isogenic RTT-WT2 cerebral organoids (Figure 4a,b and Supplementary Figure S3a,b). The characteristics of the ventricles themselves appeared different in RTT-Mut2 organoids compared to that observed in RTT-WT2. The mean ventricle wall thickness (measured as the distance from the apical to the basal surface) was decreased in RTT-Mut2 organoids (Figure 4c) and the distribution of ventricle wall thicknesses was significantly different across groups (Figure 4d). This lateral expansion of ventricles at the expense of basal expansion suggests an increase in the number of NPs and an increase in self-amplifying divisions41. Our findings of increased ventricular area and decreased radial thickness in RTT-Mut2 organoids support our results of enhanced proliferation and decreased maturity in monolayer human MeCP2-deficient cultures. We performed immunostaining experiments to determine the expression levels of dendritic marker MAP2, early neuronal marker DCX, and the sequentially expressed42 early NP marker PAX6, intermediate progenitor marker Tbr2, and first born cortical neuron (layer VI) marker Tbr1 (Figure 4e,f). We found reductions in the levels of neuronal markers MAP2 and DCX (Figure 4g). Concurrently, RTT-Mut2 organoids expressed a larger population of NP marker PAX6(+) cells, and a smaller population of cells expressing Tbr2 and Tbr1 (Figure 4g), suggestive of impaired neurogenesis in RTT patient-derived 3D cerebral organoids.
Figure 4. Patient-derived and MeCP2-deficient 3D cerebral organoids reveal deficits in neurogenesis.
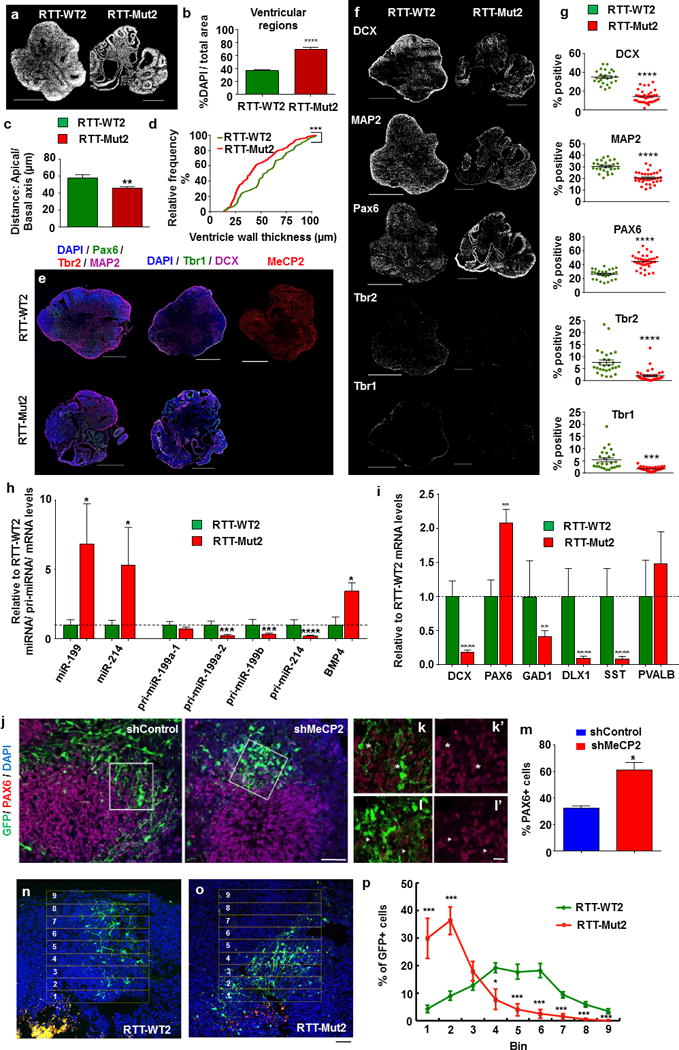
(a) Representative DAPI immunofluorescence reveals structural differences (i.e., expanded ventricular zones) in RTT-Mut2 vs. RTT-WT2 patient-derived organoids differentiated for 5 weeks. Scale bar = 500 μm. (b) Quantification of ventricular zones as a percentage of overall DAPI content reveals a significant increase in the percentage of ventricular zones in RTT-Mut2 organoids (n = 6 slices taken from 3 organoids (WT) and 8 slices taken from 4 organoids (Mut)); ****p < 0.0001, two-tailed Student’s t-test. (c) RTT-Mut2 organoids exhibit a reduction in mean ventricle wall thickness, defined as the distance between apical and basal surfaces of the ventricle. Graph shows mean ± SEM. (n = 60 ventricles measured across 6 slices taken from 3 organoids (WT) and 148 ventricles measured across 8 slices taken from 4 organoids (Mut); ***p < 0.001, Mann-Whitney test). (d) Assessment of the cumulative distribution of ventricle wall thickness reveals significant differences in RTT-Mut2 versus RTT-WT2 organoids. (n = 60 ventricles measured across 6 slices taken from 3 organoids (WT) and 148 ventricles measured across 8 slices taken from 4 organoids (Mut). ***p < 0.001, Kolmogorov-Smirnov test). (e) Representative immunostaining for PAX6 (early neural progenitors; green), TBR2 (intermediate neural progenitors; red), MAP2 (dendrites; magenta), TBR1 (early-born layer 6 cortical neurons; green), and Doublecortin (DCX) (immature neurons; magenta) in RTT-WT2 (top) and RTT-Mut2 (bottom) cerebral organoids. Scale bar = 500 μM. Immunostaining showing RTT-WT2 organoids expressing MeCP2 (red) and absence of MeCP2 protein in RTT-Mut2 organoids (bottom). Scale bar = 500 μm. (f) Representative thresholded images of the staining performed in (e) in RTT-WT2 (left) and RTT-Mut2 (right). Note the small percentage of TBR2- and TBR1-expressing cells in mutant organoids. Scale bar = 500 μM. (g) Quantification of the percentage of organoid expressing the aforementioned progenitor or neuronal marker, normalized to DAPI revealed: 1) significant reduction in DCX in RTT-Mut2 organoids (n = 25 sections from a total of 11 organoids (WT) and 35 sections from a total of 14 organoids (Mut), distributed across three independent organoid differentiation batches); 2) significant decrease in the expression of MAP2 in RTT-Mut2 organoids (n = 26 sections from a total of 11 organoids (WT) and 33 sections from a total of 14 organoids (Mut), distributed across three independent organoid differentiation batches); 3) significant increase in the expression of PAX6 in RTT-Mut2 organoids (n = 26 sections from a total of 11 organoids (WT) and 35 sections from a total of 14 organoids (Mut), distributed across three independent organoid differentiation batches); 4) significant decrease in the expression of Tbr2 in RTT-Mut2 organoids (n = 27 sections from a total of 12 organoids (WT) and 36 sections from a total of 14 organoids (Mut), distributed across three independent organoid differentiation batches); and 5) a significant decrease in the expression of Tbr1 in RTT-Mut2 (n = 26 sections from a total of 11 organoids (WT) and 34 sections from a total of 14 organoids (Mut), distributed across three independent organoid differentiation batches). A total of 79 sections (WT) and 103 sections (Mut) were analyzed for this experiment, which were generated from 3 independent differentiation rounds of both RTT-WT2 and RTT-Mut2 organoids. (***p < 0.001, ****p< 0.0001, two-tailed Student’s t-test). (h) Mean ± SEM relative to RTT-WT2 miR-199 and miR-214 (normalized to RNU44), pri-miR-199-a1,-a2,-b, pri-miR-214, and BMP4 mRNA levels (normalized to 18S rRNA) in RTT-WT2 (green bars) and RTT-Mut2 (red bars) 5 week 3D cerebral organoids. Stars depict statistical significance based on two-tailed Student’s t-test (*p < 0.05, ***p < 0.001, ****p < 0.0001). N for miR-199/214: RTT-Mut2 = 10, RTT-WT2 = 6, N for pri-miRNAs/BMP4: RTT-Mut2 = 4, RTT-WT2 = 5. (i) Mean ± SEM relative to RTT-WT2 DCX, PAX6, GAD1, DLX1, SST, and PVALB mRNA levels (normalized to 18S rRNA) in RTT-WT2 (green bars) and RTT-Mut2 (red bars) 5 week 3D cerebral organoids. Stars depict statistical significance based on two-tailed Student’s t-test (**p < 0.01, ****p< 0.0001). N: RTT-Mut2 = 4, RTT-WT2 = 5. (j) Human iPSC-derived cell organoids co-electroporated with GFP and control vector or MeCP2 shRNAs and examined after 7 days. MeCP2 shRNA-targeted cells exhibit increased number of PAX6+ progenitors. Scale: 100 μm. High-magnification of cells are shown in (k) and (l). The asterisks in (k) denote the PAX6- cells in the control group. Increased PAX6+ progenitors after depletion of MeCP2 are denoted by arrows in (l). (m) The percentages of PAX6+ GFP+ cells were quantified. *p < 0.05 versus control; two-tailed Student’s t-test. More than 100 GFP+ neurons from three organoids were examined in each group. Bars in all graphs represent mean ± S.E.M. (n-p) RTT-WT2 and RTT-Mut2 organoids were electroporated with GFP and fluorescence beads were used to mark the ventricles. Electroporated GFP+ cells in RTT-Mut2 organoids exhibited reduced migration distance (o) as compared to cells in RTT-WT2 organoids (n). Scale: 100 μm. (p) Graph showing significant reduction of migration distance in electroporated GFP+ cells in RTT-Mut2 vs RTT-WT2 organoids. *p < 0.05 versus control; ***p < 0.001 versus control; two-tailed Student’s t-test. More than 700 GFP+ cells from seven organoids were examined in each group. Segments such as those selected in (n,o) were divided in 9 bins. Bars in all graphs represent mean ± S.E.M.
Given the robust dysregulation of miR-199 and miR-214 expression in the monolayer models of MeCP2 deficiency, we hypothesized that their levels would be impacted in RTT patient cerebral organoids as well. Indeed, miRNA qRT-PCR revealed strong upregulation of both miRNAs in RTT-Mut2 compared to RTT-WT2 5 week differentiated cerebral organoids (Figure 4h). Similar to what was observed in monolayer RTT-Mut2 neuronal cultures, expression of the pri-miRNAs that produce miR-199 and miR-214 was either decreased or unchanged in RTT-Mut2 cerebral organoids (Figure 4h), suggestive again of a miRNA processing mechanism. Previous work has suggested that transforming growth factor beta (TGF-beta) and bone morphogenetic protein (BMP) activation of SMAD signaling can increase the processing of pri-miRNAs due to interactions with the nuclear microprocessor complex. In addition, increases in BMP4 have been observed in the brain of mice with mutations in Mecp2 that affect neuronal activity–induced phosphorylation of Mecp2 protein. We therefore measured BMP4 mRNA levels in RTT-Mut2 and RTT-WT2 cerebral organoids. Interestingly, a robust increase in BMP4 mRNA expression was observed in RTT-Mut2 organoids (Figure 4h). Notably, a very robust increase in BMP4 expression was also observed in RTT-Mut2 vs. RTT-WT2 monolayer immature (3 week) and mature (14 week) iPSC-derived neuronal cultures (Supplementary Figure S3c). Furthermore, increases in PAX6 expression and reductions in neuronal markers observed with immunocytochemistry (see Figure 4e-g) were also verified with qRT-PCR (Figure 4i), and were accompanied by notable reductions in GABAergic interneuron marker GAD1 and interneuron specification factor Dlx1 (Figure 4i), suggestive of alterations in GABAergic interneuron differentiation as well. Given that Dlx1 affects the specification of somatostatin (STT) but not parvalbumin (PVALB) interneurons43, we measured SST and PVALB mRNAs in the same 5 week cerebral organoids. Notably, we found a distinct reduction in SST but no changes in PVALB expression in RTT-Mut2 vs. RTT-WT2 cerebral organoids (Figure 4i). Taken together, these findings provide strong evidence for severe alterations in early human neuronal development and miR-199/miR-214 expression as a result of MeCP2 deficiency.
We next sought to assay neuronal migration in a 3D organoid context. We electroporated WT2 iPSC-derived 3D cerebral organoids with a MeCP2 shRNA (or control construct) together with GFP (to visualize transfected neurons and control for efficiency of electroporation) (Supplementary Figure S4a-c). At day 7 post-electroporation, most of the control neurons had attained a unipolar/bipolar shape and had migrated out of the PAX6+ proliferative zone (Figure 4j-l). Strikingly, we found that MeCP2 shRNA-targeted cells showed a rounded morphology with reduced processes (Figure 4j-l). Importantly, MeCP2-depleted cells did not migrate as far and remained in the ventricle-like PAX6+ proliferative zones within the cerebral organoids. (Figure 4j-m). We next electroporated RTT-WT2 and RTT-Mut2 organoids with GFP to assess migration and used fluorescent beads to mark the location of ventricles (Figure 4n,o). As expected, our results clearly showed that electroporated GFP+ cells in RTT-Mut2 organoids exhibited reduced migration distance as compared to electroporated GFP+ cells in RTT-WT2 organoids (Figure 4n-p).
Aberrant prenatal neurogenesis following in vivo inhibition of mouse Mecp2 expression and overexpression of miR-199 or miR-214
To further elucidate the nature of the observed deficits in early neuronal differentiation in mice, WT embryonic mouse brains were electroporated with a Mecp2 shRNA (or control construct) together with GFP construct to visualize the migration of newly-born neurons. Results revealed significant delays in the ability of newly-born Mecp2-shRNA neurons to exit the ventricular/sub-ventricular zone (VZ/SVZ) and migrate towards the cortical plate (Supplementary Figure S5a,b), which is in agreement with a recent study27. In addition, we found that a significantly increased percentage of Mecp2-depleted neurons remained as PAX6+ progenitors, suggesting a stunted differentiation process in these cells (Supplementary Figure S5c). Given the observed abnormalities in prenatal brain development, we anticipated that newly-born Mecp2 mutant mice should exhibit altered neuroanatomical properties. Indeed, male newborn (P0) Mecp2-/y mice were characterized by a small but significantly reduced cortical thickness (Supplementary Figure 5d,e). Thus the observed deficits in prenatal brain development in Mecp2 mutant mice are present but seem less severe than those observed in our monolayer and 3D human neuronal culture RTT models. This is in accordance with the less severe phenotype observed in male Mecp2 mutant mice vs. male RTT patients and the delayed onset of symptoms in Mecp2 heterozygous female mice vs. female RTT patients (onset of symptoms at old age in female heterozygous mice vs. early infancy in female RTT patients).
To determine if overexpression of miR-199 or miR-214 is sufficient to disturb prenatal neurogenesis and neuronal migration we electroporated in utero E13 WT mouse brains with miR-199 and miR-214 overexpressing vectors co-expressing GFP. Neurons overexpressing either miR-199 or miR-214 displayed altered neurogenesis and migration that manifested as a delay to exit the VZ/SVZ or intermediate zone (IZ) as compared to control vector-electroporated neurons (Supplementary Figure S5f-g). Such an effect phenocopied the developmental defects observed in Mecp2-shRNA electroporated neurons (Supplementary Figure S5f-g). Therefore, overexpression of either miR-199 or miR-214 is sufficient to alter prenatal neurogenesis in a manner similar to what is observed in Mecp2 deficient mouse cortices.
miR-199 and miR-214 regulates ERK and AKT activation in early neuronal differentiation and control prenatal neurogenesis
To determine the role(s) of miR-199 and miR-214 dysregulation in the observed deficiencies in early human neuronal development, we first performed in silico analyses of the predicted targets of significantly altered miR-199 and miR-214 miRNAs by Targetscan using the DAVID bioinformatics database. The analysis revealed enrichment in important brain signaling pathways such as MAPK, WNT, Insulin, and mTOR (Supplementary Table S2). Numerous studies have demonstrated that miR-214 targets phosphatase and tensin homolog (PTEN), an ASD-related gene known to inhibit the activation of AKT44. In addition, one validated target for miR-199a-3p is PAK4, a member of a family of serine/threonine kinases that are critical effector proteins regulated by Rho-family GTPases and capable of activating MAPK signaling45. Previous studies have also suggested that both ERK and AKT are important for embryonic brain development, yet control different aspects of neurogenesis: ERK promotes neuronal differentiation and AKT induces neuronal progenitor proliferation and survival46-48. As such, we measured protein levels of PTEN, PAK4, as well as phosphorylated-specific (activated) and total AKT and ERK1/2 (pAKT, tAKT and pERK1/2, tERK1/2) using western blotting in all the samples described above that included isogenic controls (Figure 5a). We found significant reductions in PTEN and PAK4 protein levels in shMeCP2 NPs relative to shControl, accompanied by decreased pERK1/2 to tERK1/2 ratios and increased ratios of pAKT to tAKT (Figure 5a,b). Importantly, measurements of ERK, AKT, PAK4, and PTEN were similarly affected in RTT-Mut2. WT2 and isogenic RTT-WT2 NPs were unaltered, suggestive of a consistently dysregulated pathway (Figure 5a,c). Following three weeks of neuronal differentiation, no significant changes in either AKT or ERK activation were seen, despite consistent reductions in both PTEN and PAK4 (Supplementary Figure S6a). These results suggest that additional factors may contribute to the activation of AKT and ERK during later human neuronal development. Indeed, at the NP stage, significant positive and negative correlations were observed between PAK4 and activated ERK, and PTEN and activated AKT, respectively (Figure 5d,e); these correlations disappeared after three weeks of differentiation (Supplementary Figure S6b,c). Taken together, our results suggest the existence of a consistent molecular network downstream of MeCP2-regulated miRNAs miR-199 and miR-214, which is specifically affected during the early stages of neuronal differentiation. Our results thus far have established a consistent upregulation of both miR-199 and miR-214 as a result of MECP2 mutation or MeCP2 knockdown, which is accompanied by aberrant early neurogenesis and alterations in downstream pathways known to affect neuronal differentiation in both human and animal models.
Figure 5. Inhibition of miR-199 and miR-214 in MeCP2-deficient NPs rescues ERK and AKT activation and ameliorates alterations in neuronal differentiation.
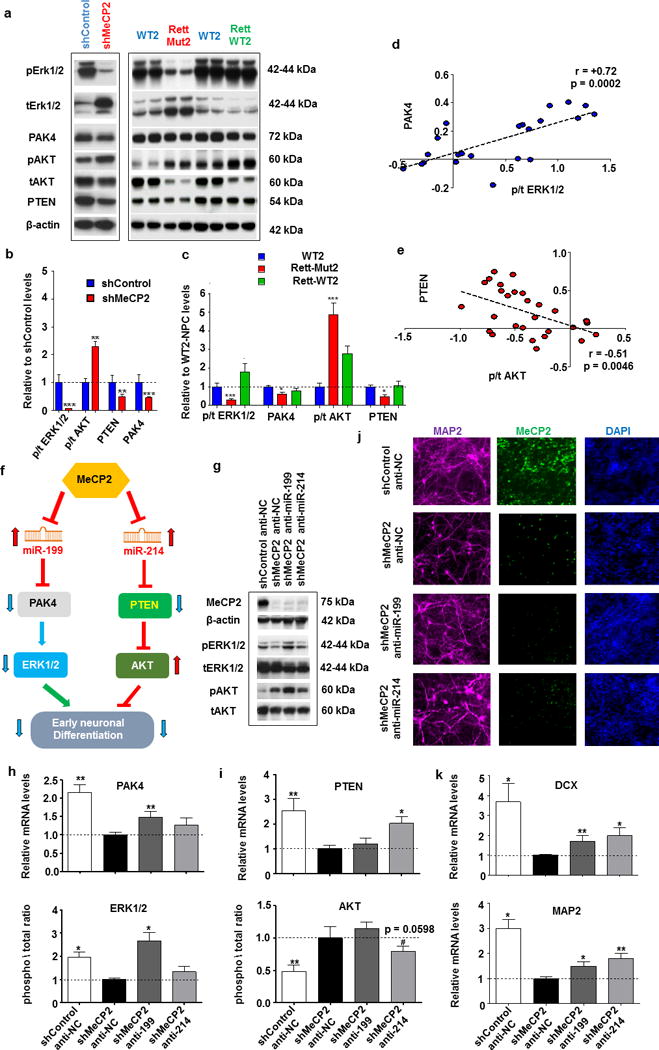
(a) Representative Western blots showing levels of phosphorylated (p) and total (t) ERK1/2 and AKT, PTEN and PAK4 protein levels together with normalizer β-actin in MeCP2 (shMeCP2) or Control shRNA (shControl)- expressing WT NPs (left), as well as in WT2, RTT-Mut2 and RTT-WT2 NPs. (b-c) Graphs based on Western blot analysis showing mean ± SEM for the same proteins mentioned above in shMeCP2 (red bar) and shControl (blue bar) (b) and WT unaffected control (WT2 – blue bar), RTT-Mut2 (red bar) and RTT-WT2 (green bar) (c) samples. Stars depict statistical significance based on two-tailed one sample t-test (shMeCP2, shControl) or ANOVA (WT2, RTT-Mut2, RTT-WT2) with Dunnett’s multiple comparisons test (right) (*p < 0.05, **p < 0.01, ***p < 0.001). N: shControl = 4, shMeCP2 = 4, WT2 = 6, RTT-mut2 = 10, RTT-WT2 = 6. (d,e) Correlation between PAK4 and p/t ERK1/2 (d) and PTEN and p/t AKT levels (e) in WT2, RTT-WT2, RTT-Mut2, as well as shControl and shMeCP2 NPs (log transformed). Each dot represents one sample (Blue dots for positive and red for negative correlations). Spearmann coefficients and p-values are shown in the graphs. (f) Schematic of the proposed molecular mechanism. (g) Representative Western blots showing levels of phosphorylated and total ERK1/2 (pERK1/2 and tERK1/2) and AKT (pAKT and tAKT), and MeCP2 protein levels together with normalizer β-actin, following nucleofection of miR-199 or miR-214 inhibitors (anti-miR-199 and anti-miR-214) in shMeCP2 expressing NPs, as well as with shMeCP2 and shControl NPs nucleofected with a negative miRNA control inhibitor (shMeCP2 anti-NC and shControl anti-NC respectively). (h) Graphs showing mean ± SEM PAK4 mRNA (upper) and phosphorylated vs total ERK1/2 protein in shControl anti-NC, shMeCP2 anti-NC, shMeCP2 anti-miR-199, and shMeCP2 anti-miR-214 NPs. (i) Graphs showing mean ± SEM PTEN mRNA (upper) and phosphorylated vs total AKT protein in the NP samples as above. For all 4 groups N = 5 for protein and N = 8 for mRNA measurements. (j) Representative immunostaining for MAP2 and MeCP2 in three-week anti-miRNA nucleofected MeCP2 shRNA neurons (same groups as above- yet different developmental stage). (k) Graphs showing mean ± SEM DCX (upper) and MAP2 mRNA in the three-week neuronal samples as above. N = 8 for for all 4 groups. Analysis in (h), (i), (k) was based on two-tailed one sample t-test, (*p < 0.05,**p < 0.01, #0.10< p < 0.05). 18S rRNA was used as a normalizer for all mRNA qRT-PCRs.
We hypothesized that miR-199/miR-214 dysregulation could be one mechanism downstream of MeCP2 contributing to the observed alterations in neural development. Toward this end, we correlated levels of neuronal marker MAP2 in RTT-Mut2, WT2, and isogenic RTT-WT2 neurons to miR-199 and miR-214 expression. Our results demonstrated a strong inverse correlation between MAP2 and each of the two affected miRNAs (MAP2 vs miR-199: r = -0.54, p = 0.0006; MAP2 vs miR-214, r = -0.56, p = 0.0003; all based on Spearman correlation). In addition, mRNA expression levels of MAP2 and DCX were found to be decreased in E12.5 Mecp2 mutant mouse brains (MAP2, ~ 1.47 fold decrease in Mecp2 mutant vs WT mice, t=3.135, df=4, p= 0.0280; DCX, ~ 1.71 fold decrease in Mecp2 mutant vs WT mice, t=4.100, df=4, p= 0.0094; both based on two-tailed one sample t-test), and were negatively related to both miR-199 and miR-214 changes (MAP2 vs miR-199: r = -0.60, p = 0.0032; MAP2 vs miR-214, r = -0.58, p = 0.0051, DCX vs miR-199: r = -0.44, p = 0.0396, DCX vs miR-214, r = -0.51, p = 0.0154; all based on Spearman correlation), thus suggesting the possibility of these miRNAs contributing to the observed mouse neuronal phenotype as well.
Due to the complexity of the signaling interactions involved, we sought to establish causality with respect to the observed dysregulation of miR-199 and miR-214 levels during early prenatal neurogenesis. Indeed, such effects could feasibly be an epiphenomenon of delayed neuronal differentiation brought about by additional MeCP2-regulated pathways independent of miR-199/miR-214. In order to elucidate any potential mechanistic role(s) of miR-199/miR-214 dysregulation, we employed nucleofection to transfect shMeCP2 NPs with plasmids encoding small RNA sequences that sequester (sponge) endogenous miR-199 or miR-214, as well as negative control miRNA inhibitors. This approach addressed whether miR-199 and/or miR-214 exerts an inhibitory effect on PAK4 and PTEN, respectively, and whether they influence the observed neuronal differentiation deficits in human neurons via differential effects on ERK and AKT signaling (Figure 5f). Indeed, we found that the reductions in PTEN levels in shMeCP2 NPs relative to shControl NPs were significantly ameliorated by miR-214 inhibition, and miR-199 inhibition was able to significantly reverse the PAK4 reductions seen in shMeCP2 three-week neurons (Figure 5g-i). In addition, the effects of miR-199 and miR-214 inhibition were specific for their targets, as no significant changes in PTEN or PAK4 were observed following miR-199 and miR-214 inhibition, respectively (Figure 5h-i). Measurements of phosphorylated and total ERK and AKT via western blotting revealed that miR-199 inhibition in shMeCP2 NPs resulted in the normalization of ERK activation exclusively, whereas inhibition of miR-214 in shMeCP2 NPs resulted in moderately reduced AKT activation with no effects on ERK signaling (Figure 5g-i). Collectively, these data suggest that in MeCP2-deficient NPs, upregulation of miR-199 and miR-214 differentially regulates ERK and AKT signaling, respectively.
To determine whether increased miR-214 and miR-199 levels are responsible for the observed MeCP2 deficiency-related abnormalities in neuronal differentiation, we tested whether inhibiting these miRNAs via nucleofection in shMeCP2 NPs could increase the expression of neuronal markers such as MAP2 and DCX and improve neuronal complexity. Indeed, both miR-199 and miR-214 single miRNA inhibition significantly increased MAP2 and DCX levels in three-week MeCP2-shRNA neurons, in addition to improving the observed alterations in neuronal maturity (Figure 5j,k). These results strongly suggest that the dysregulation in miR-214 and miR-199 as a result of MeCP2 deficiency is an important component of the molecular machinery underlying the alterations in neuronal differentiation, and that inhibition of either miR-199 or miR-214 expression can partially rescue the observed alterations in early neuronal development due to MeCP2 deficiency.
DISCUSSION
Mutations in MECP2 or altered expression of MeCP2 have been linked to ASD, intellectual disability, schizophrenia, and other neuropsychiatric disorders of developmental origin other than RTT49, 50. However, the vast majority of the existing literature has focused on the role of MeCP2 in postnatal brain maturation and plasticity, and little is known about its effects in prenatal brain development. We hypothesized that MeCP2 could impact early prenatal neurogenesis and neuronal differentiation and that MeCP2-responsive miRNA-mediated pathways could participate in the underlying molecular mechanisms. Through the use of multiple monolayer and 3D neuronal culture models of human MeCP2 deficiency, including iPSC-derived RTT patient and MeCP2 shRNA knockdown cultures, we uncovered robust deficits in prenatal neurogenesis and neuronal differentiation, which were partially observed in Mecp2 mutant mice. We identified consistent alterations in miR-199/214 expression levels and their downstream targets PAK4 and PTEN, respectively, capable of differentially regulating ERK and AKT signaling pathways upstream of neurogenesis. Notably, the degree of miR-199/214 overexpression was found to correlate with the severity of neuronal differentiation deficits, whereas inhibition of their expression was able to ameliorate these effects. Lastly, overexpressing either miR-199 or miiR-214 into WT embryonic brains phenocopied Mecp2 knockdown brains and resulted in aberrant neurogenesis and neuronal migration. Our findings provide a novel mechanism downstream of MeCP2 that may contribute to critical prenatal components of the pathogenesis of neurodevelopmental disorders.
Mouse models with an embryonic (Nestin-cre) deletion of Mecp2 recapitulate the majority of RTT symptomatology, whereas postnatal deletion such as in the case of CamKIIa-cre Mecp2 mutant mice results only in a subset of RTT-related symptoms51-53. Such severe effects of prenatal-specific disruption of Mecp2 support our proposed model. Furthermore, prenatal brain-specific overexpression of Mecp2 results in complete rescue, whereas Mecp2 overexpression via postnatal neuron-specific promoters cannot rescue the observed phenotype17, 54. However, rescue of Mecp2 expression in lox-stop Mecp2 mutant adolescent mice can notably improve survival and ameliorate RTT-related symptoms17, 18. Additionally, numerous therapeutic approaches have been shown to partially rescue RTT phenotypes. The most notable examples have been those aimed at restoring BDNF and IGF1 and β-adrenergic receptor signaling, which also hold clinical promise6, 16, 19, 20, 55-58. Such cases of postnatal amelioration of RTT phenotypes, however, do not exclude the possibility of a prenatal component of RTT, but rather underscore the potential reversibility of RTT symptomatology.
Furthermore, the postnatal developmental expression of miR-199 and miR-214 in human postmortem brains along with data from our mature (fourteen week) iPSC-derived neuronal cultures, are in contrast to the early embryonic brain-enriched expression patterns observed in mice and rat brains. It is, thus, tempting to speculate that the less severe and delayed in onset RTT-symptoms in Mecp2 knockout and heterozygous mice compared to both male and female RTT patients could be a result of inter-species differences in the temporal expression patterns of MeCP2-related miRNAs such as miR-199 and miR-214.
The discrepancy between changes in mature and pri-miRNA expression for miR-199 and miR-214 observed in both monolayer and 3D iPSC-derived mutant neuronal cultures (see Figure 4h, and Supplementary Figure 2e) is indicative of a disturbance in miRNA biogenesis at a stage following the transcription of the pri-miRNA transcripts. Although previous work has suggested that Mecp2 binds to the nuclear miRNA machinery to inhibit pri-miRNA cleavage7, such an interaction is mostly based on the C-terminus and thus cannot explain the observed alterations in both RTT mutant lines. Furthermore, previous work in adult Mecp2 mutant brain miRNA expression identified miR-199b-5p as one of the upregulated miRNAs and determined that Mecp2 is unlikely to directly influence pri-miR-199b transcription since it did not bind to the miR-199 promoter, which remained unmethylated despite the increased mature miRNA expression9. However, additional molecular cascades such as those involved in BMP/SMAD signaling have also been shown to activate pri-miRNA processing59. Given our findings of robustly increased BMP4 mRNA levels in RTT mutant monolayer cultures and cerebral organoids and the known dysregulation of BMP4 mRNA expression in the hippocampus of mice with mutations in Mecp2 that disrupt the phosphorylation of Mecp2 protein, it is tempting to speculate that the observed alterations in pri- and mature miR-199 and miR-214 levels could be a result of an indirect effect of MeCP2 on miRNA processing due to increased BMP4/SMAD signaling. Future work in additional mutant lines is needed to determine whether such an indirect mechanism of MeCP2-induced miRNA dysregulation is in place in RTT.
Neuropathological analysis of the brains of RTT patients has revealed increased cell density and diminished cellular size and dendritic complexity, in addition to reduced early neuronal marker expression60-62. Furthermore, multiple studies in mouse models of RTT have revealed alterations in neuronal maturation and dendritic spine morphology in adolescent or adult mice16, 21-23, 58. Notably, our data in newborn Mecp2 mutant mice also demonstrate a significant reduction in cortical thickness, which by necessity must be a result of aberrant prenatal brain development. Our findings of increased BrdU incorporation in MeCP2-deficient human neuronal cultures and migration deficits in mouse and 3D human models of RTT further support this notion and provide an alternative explanation for the observed alterations in postnatal neuronal morphology. However, due to the strong existing evidence of the role of MeCP2 in postnatal brain maturation and plasticity and the postnatal peak in developmental expression of MeCP2, our proposed model is most likely to be the first part of a “two-hit” scenario that incorporates both pre- and post-natal contributions to RTT pathophysiology. In such a case, future experiments utilizing miR-199 and miR-214 prenatal-specific knockdown and transgenic overexpression will be needed to fully validate our proposed mechanism.
The expanded ventricular zones and presence of enhanced PAX6+ ventricle-like structures in RTT patient-derived mutant cerebral organoids assayed in our study also validates the use of this novel 3D human culture model39 as a tool to study corticogenesis in the context of neurodevelopmental disorders. Interestingly, a recent study using cerebral organoids from patients with idiopathic ASD revealed a significant cell-specific acceleration in neuronal differentiation63, which was accompanied with increased levels of FOXG1, whose deficiency results in perturbed prenatal brain development and a congenital RTT-like phenotype64.
Pivotal studies in iPSC monolayer neuronal culture models of RTT have suggested a deficiency in neuronal differentiation marker expression, neuronal migration, dendritic complexity, and synaptic density in RTT patient-derived neuronal cultures28-33. Our results are in agreement with most of these findings and expand the understanding of the nature of the disturbances in early neurogenesis and neuronal differentiation in RTT patient-derived neuronal cultures. The observed deficiencies in SST but not PVALB expression, in conjunction with the observed excitatory neuronal marker reductions (e.g. Tbr1) in RTT mutant cerebral organoids, are of particular interest given the distinct RTT-like phenotypes associated with deletion of Mecp2 in either SST or PVALB GABAergic interneurons65. Such changes appear to be a result of reduced Dlx1 expression, an interneuron specification marker that drives SST but not PVALB interneuron differentiation, and whose deficiency is known to result in delayed-onset epilepsy43. Moreover, they are in agreement with a previous study that reported deficits in the soma size of GAD1-expressing interneurons in RTT iPSC-derived neuronal cultures30. Additional work, however, is warranted to determine the cell-specific effects of MeCP2 deficiency in early neuronal differentiation and excitatory to inhibitory balance, as well as the importance of miR-199 and miR-214 dysregulation in interneuron specification.
We have previously shown that a crucial mechanism of adrenergic function is to upregulate IGF1 levels via the LIN28A/let-7f miRNA pathway downstream of BDNF20. Notably, alterations in other members of the let-7 family of miRNAs were observed in one of the two RTT patient-derived neuronal cultures examined. Although let-7f itself is mostly enriched in glia66, and is thus greatly underrepresented in the pool of let-7 miRNAs present in NPs (data not shown), other let-7 miRNAs have also been implicated in the control of neurogenesis67. Moreover, we anticipate that additional miR-199 and miR-214 targets, other than PAK4 and PTEN, might be of importance for RTT44, 68.
It is known that too much or too little MeCP2 can result in neurodevelopmental defects including RTT-related phenotype69, 70, and that Mecp2 participates in feedback regulatory loops with additional miRNAs, such as miR-13271. Thus we would predict that reductions in miR-199/214 miRNAs could also be deleterious. Indeed, a recent paper reported that miR-199a-2 knockout mice display some RTT/neurodevelopmental disorder-like symptoms68, supporting the hypothesis of dosage dependency of MeCP2-related miR-199 expression with respect to normal brain development. However, the same study claims small decreases in one of the miR-199 members in mouse E17 or P0 brain-derived hippocampal cultures, and provides in vitro evidence for additional effectors downstream of miR-199. Our results together with previous reports40 show that mouse miR-199 and miR-214 are developmentally enriched in early prenatal brain development (E12.5-E14), and thus we believe that any potential brain region-specific miR-199 changes at later mouse developmental stages will have a much less pronounced physiological effect. However, more studies in mouse RTT models are needed to determine the developmental- or brain region- specific impact of miR-199 and miR-214 on the observed behavioral disease-related phenotypes.
One limitation of our findings is that they are unable to fully conclude whether the observed aberrant neuronal differentiation in RTT neurons Mecp2 mutant mice and miR-199 and miR-214 overexpressing embryonic brains is a result of a delay in neurogenesis or of an initial premature increase in early neurogenesis, which can subsequently result in compensatory reductions in mid- and late-stage neurogenesis. The known differential effects of ERK and AKT on prenatal neurogenesis, however, point toward the latter. Such a premature increase in early neurogenesis followed by a depletion of neurogenic capacity can explain the aberrant early neuronal maturation and dendritic arborization in MeCP2-deficient neurons, as it would severely impact the precise developmental timing needed for the complex and interrelated prenatal brain developmental stages. Furthermore, our findings of transient and opposite disruptions in ERK and AKT signaling during early neurogenesis in human patient-derived neuronal cultures are of particular interest, as reductions in both ERK and AKT activation are observed in certain brain regions of adult symptomatic Mecp2 mutant mice16, 72. On a similar note, the dissociation between ERK and AKT activation from the changes in miR-199/PAK4 and miR-214/PTEN expression observed in three-week differentiated iPSC-derived neurons suggests the presence of compensatory influences on the activation of these two central molecular hubs.
Given the plethora of neuropsychiatric diseases with potential links to MeCP2, our findings of aberrant prenatal neuronal differentiation via alterations in miRNAs such as miR-199 and miR-214 could have implications for additional neurodevelopmental disorders other than RTT, particularly following the growing reports of genetic linkage of ASDs and schizophrenia with additional molecules involved in prenatal neurogenesis73, 74. It is tempting to speculate that early disruptions in brain development could result in increased susceptibility to subtle postnatal deleterious effects on brain maturation and plasticity, thus contributing to the full pathogenesis of neurodevelopmental disorders.
Supplementary Material
Acknowledgments
We would like to thank Ting Fu, Tatiana Karadimitriou, Chuong Le, Anita Liu, Jonathan Woodson, and Arooshi Kumar for excellent technical support, Chloe Delepine for advice on the manuscript, as well as additional members of the Jaenisch, Haggarty, and Sur laboratories for helpful discussion. We would also like to thank Dr. Nora Perrone-Bizzozero, Dr. Andrea Allan, Dr. Meilian Liu, as well as Robert Oliver, Elizabeth Solomon, and Xing Zhang for technical advice and assistance. This manuscript was supported by NIH grant MH085802 (MS), 2R01MH104610-15 (RJ), and the Simons Foundation Autism Research Initiative (MS, RJ), NIH/NIMH R01MH095088 (SJH), Pitt-Hopkins Research Foundation (SJH), FRAXA Research Foundation (SJH), Human Frontier Science Program Long-Term Fellowship (J.P.K.I).
Footnotes
Conflict of Interests
The authors declare no conflict of interests.
References
- 1.Krol J, Loedige I, Filipowicz W. The widespread regulation of microRNA biogenesis, function and decay. Nat Rev Genet. 2010;11:597–610. doi: 10.1038/nrg2843. [DOI] [PubMed] [Google Scholar]
- 2.Coolen M, Bally-Cuif L. MicroRNAs in brain development and physiology. Curr Opin Neurobiol. 2009;19:461–470. doi: 10.1016/j.conb.2009.09.006. [DOI] [PubMed] [Google Scholar]
- 3.Mellios N, Sur M. The Emerging Role of microRNAs in Schizophrenia and Autism Spectrum Disorders. Front Psychiatry. 2012;3:39. doi: 10.3389/fpsyt.2012.00039. [DOI] [PMC free article] [PubMed] [Google Scholar]
- 4.Mellios N, Sugihara H, Castro J, Banerjee A, Le C, Kumar A, et al. miR-132, an experience-dependent microRNA, is essential for visual cortex plasticity. Nat Neurosci. 2011;14:1240–1242. doi: 10.1038/nn.2909. [DOI] [PMC free article] [PubMed] [Google Scholar]
- 5.Amir RE, Van den Veyver IB, Wan M, Tran CQ, Francke U, Zoghbi HY. Rett syndrome is caused by mutations in X-linked MECP2, encoding methyl-CpG-binding protein 2. Nat Genet. 1999;23:185–188. doi: 10.1038/13810. [DOI] [PubMed] [Google Scholar]
- 6.Castro J, Mellios N, Sur M. Mechanisms and therapeutic challenges in autism spectrum disorders: insights from Rett syndrome. Curr Opin Neurol. 2013;26:154–159. doi: 10.1097/WCO.0b013e32835f19a7. [DOI] [PubMed] [Google Scholar]
- 7.Cheng TL, Wang Z, Liao Q, Zhu Y, Zhou WH, Xu W, et al. MeCP2 suppresses nuclear microRNA processing and dendritic growth by regulating the DGCR8/Drosha complex. Dev Cell. 2014;28:547–560. doi: 10.1016/j.devcel.2014.01.032. [DOI] [PubMed] [Google Scholar]
- 8.Szulwach KE, Li X, Smrt RD, Li Y, Luo Y, Lin L, et al. Cross talk between microRNA and epigenetic regulation in adult neurogenesis. J Cell Biol. 2010;189:127–141. doi: 10.1083/jcb.200908151. [DOI] [PMC free article] [PubMed] [Google Scholar]
- 9.Urdinguio RG, Fernandez AF, Lopez-Nieva P, Rossi S, Huertas D, Kulis M, et al. Disrupted microRNA expression caused by Mecp2 loss in a mouse model of Rett syndrome. Epigenetics. 2010;5:656–663. doi: 10.4161/epi.5.7.13055. [DOI] [PMC free article] [PubMed] [Google Scholar]
- 10.Wu H, Tao J, Chen PJ, Shahab A, Ge W, Hart RP, et al. Genome-wide analysis reveals methyl-CpG-binding protein 2-dependent regulation of microRNAs in a mouse model of Rett syndrome. Proc Natl Acad Sci U S A. 2010;107:18161–18166. doi: 10.1073/pnas.1005595107. [DOI] [PMC free article] [PubMed] [Google Scholar]
- 11.Neul JL, Zoghbi HY. Rett syndrome: a prototypical neurodevelopmental disorder. Neuroscientist. 2004;10:118–128. doi: 10.1177/1073858403260995. [DOI] [PubMed] [Google Scholar]
- 12.Einspieler C, Kerr AM, Prechtl HF. Is the early development of girls with Rett disorder really normal? Pediatr Res. 2005;57:696–700. doi: 10.1203/01.PDR.0000155945.94249.0A. [DOI] [PubMed] [Google Scholar]
- 13.Kerr AM. Early clinical signs in the Rett disorder. Neuropediatrics. 1995;26:67–71. doi: 10.1055/s-2007-979725. [DOI] [PubMed] [Google Scholar]
- 14.Schanen NC, Kurczynski TW, Brunelle D, Woodcock MM, Dure LSt, Percy AK. Neonatal encephalopathy in two boys in families with recurrent Rett syndrome. J Child Neurol. 1998;13:229–231. doi: 10.1177/088307389801300507. [DOI] [PubMed] [Google Scholar]
- 15.Trappe R, Laccone F, Cobilanschi J, Meins M, Huppke P, Hanefeld F, et al. MECP2 mutations in sporadic cases of Rett syndrome are almost exclusively of paternal origin. Am J Hum Genet. 2001;68:1093–1101. doi: 10.1086/320109. [DOI] [PMC free article] [PubMed] [Google Scholar]
- 16.Castro J, Garcia RI, Kwok S, Banerjee A, Petravicz J, Woodson J, et al. Functional recovery with recombinant human IGF1 treatment in a mouse model of Rett Syndrome. Proc Natl Acad Sci U S A. 2014;111:9941–9946. doi: 10.1073/pnas.1311685111. [DOI] [PMC free article] [PubMed] [Google Scholar]
- 17.Giacometti E, Luikenhuis S, Beard C, Jaenisch R. Partial rescue of MeCP2 deficiency by postnatal activation of MeCP2. Proc Natl Acad Sci U S A. 2007;104:1931–1936. doi: 10.1073/pnas.0610593104. [DOI] [PMC free article] [PubMed] [Google Scholar]
- 18.Guy J, Gan J, Selfridge J, Cobb S, Bird A. Reversal of neurological defects in a mouse model of Rett syndrome. Science. 2007;315:1143–1147. doi: 10.1126/science.1138389. [DOI] [PMC free article] [PubMed] [Google Scholar]
- 19.Khwaja OS, Ho E, Barnes KV, O’Leary HM, Pereira LM, Finkelstein Y, et al. Safety, pharmacokinetics, and preliminary assessment of efficacy of mecasermin (recombinant human IGF-1) for the treatment of Rett syndrome. Proc Natl Acad Sci U S A. 2014;111:4596–4601. doi: 10.1073/pnas.1311141111. [DOI] [PMC free article] [PubMed] [Google Scholar]
- 20.Mellios N, Woodson J, Garcia RI, Crawford B, Sharma J, Sheridan SD, et al. beta2-Adrenergic receptor agonist ameliorates phenotypes and corrects microRNA-mediated IGF1 deficits in a mouse model of Rett syndrome. Proc Natl Acad Sci U S A. 2014;111:9947–9952. doi: 10.1073/pnas.1309426111. [DOI] [PMC free article] [PubMed] [Google Scholar]
- 21.Fukuda T, Itoh M, Ichikawa T, Washiyama K, Goto Y. Delayed maturation of neuronal architecture and synaptogenesis in cerebral cortex of Mecp2-deficient mice. J Neuropathol Exp Neurol. 2005;64:537–544. doi: 10.1093/jnen/64.6.537. [DOI] [PubMed] [Google Scholar]
- 22.Kishi N, Macklis JD. MECP2 is progressively expressed in post-migratory neurons and is involved in neuronal maturation rather than cell fate decisions. Mol Cell Neurosci. 2004;27:306–321. doi: 10.1016/j.mcn.2004.07.006. [DOI] [PubMed] [Google Scholar]
- 23.Shahbazian MD, Antalffy B, Armstrong DL, Zoghbi HY. Insight into Rett syndrome: MeCP2 levels display tissue- and cell-specific differences and correlate with neuronal maturation. Hum Mol Genet. 2002;11:115–124. doi: 10.1093/hmg/11.2.115. [DOI] [PubMed] [Google Scholar]
- 24.Armstrong DD, Deguchi K, Antallfy B. Survey of MeCP2 in the Rett syndrome and the non-Rett syndrome brain. J Child Neurol. 2003;18:683–687. doi: 10.1177/08830738030180100601. [DOI] [PubMed] [Google Scholar]
- 25.Petazzi P, Akizu N, Garcia A, Estaras C, Martinez de Paz A, Rodriguez-Paredes M, et al. An increase in MECP2 dosage impairs neural tube formation. Neurobiol Dis. 2014;67:49–56. doi: 10.1016/j.nbd.2014.03.009. [DOI] [PubMed] [Google Scholar]
- 26.Tsujimura K, Abematsu M, Kohyama J, Namihira M, Nakashima K. Neuronal differentiation of neural precursor cells is promoted by the methyl-CpG-binding protein MeCP2. Exp Neurol. 2009;219:104–111. doi: 10.1016/j.expneurol.2009.05.001. [DOI] [PubMed] [Google Scholar]
- 27.Bedogni F, Cobolli Gigli C, Pozzi D, Rossi RL, Scaramuzza L, Rossetti G, et al. Defects During Mecp2 Null Embryonic Cortex Development Precede the Onset of Overt Neurological Symptoms. Cereb Cortex. 2016;26:2517–2529. doi: 10.1093/cercor/bhv078. [DOI] [PubMed] [Google Scholar]
- 28.Farra N, Zhang WB, Pasceri P, Eubanks JH, Salter MW, Ellis J. Rett syndrome induced pluripotent stem cell-derived neurons reveal novel neurophysiological alterations. Mol Psychiatry. 2012;17:1261–1271. doi: 10.1038/mp.2011.180. [DOI] [PMC free article] [PubMed] [Google Scholar]
- 29.Kim KY, Hysolli E, Park IH. Neuronal maturation defect in induced pluripotent stem cells from patients with Rett syndrome. Proc Natl Acad Sci U S A. 2011;108:14169–14174. doi: 10.1073/pnas.1018979108. [DOI] [PMC free article] [PubMed] [Google Scholar]
- 30.Li Y, Wang H, Muffat J, Cheng AW, Orlando DA, Loven J, et al. Global transcriptional and translational repression in human-embryonic-stem-cell-derived Rett syndrome neurons. Cell Stem Cell. 2013;13:446–458. doi: 10.1016/j.stem.2013.09.001. [DOI] [PMC free article] [PubMed] [Google Scholar]
- 31.Marchetto MC, Carromeu C, Acab A, Yu D, Yeo GW, Mu Y, et al. A model for neural development and treatment of Rett syndrome using human induced pluripotent stem cells. Cell. 2010;143:527–539. doi: 10.1016/j.cell.2010.10.016. [DOI] [PMC free article] [PubMed] [Google Scholar]
- 32.Williams EC, Zhong X, Mohamed A, Li R, Liu Y, Dong Q, et al. Mutant astrocytes differentiated from Rett syndrome patients-specific iPSCs have adverse effects on wild-type neurons. Hum Mol Genet. 2014;23:2968–2980. doi: 10.1093/hmg/ddu008. [DOI] [PMC free article] [PubMed] [Google Scholar]
- 33.Fernandes TG, Duarte ST, Ghazvini M, Gaspar C, Santos DC, Porteira AR, et al. Neural commitment of human pluripotent stem cells under defined conditions recapitulates neural development and generates patient-specific neural cells. Biotechnol J. 2015;10:1578–1588. doi: 10.1002/biot.201400751. [DOI] [PubMed] [Google Scholar]
- 34.Park IH, Zhao R, West JA, Yabuuchi A, Huo H, Ince TA, et al. Reprogramming of human somatic cells to pluripotency with defined factors. Nature. 2008;451:141–146. doi: 10.1038/nature06534. [DOI] [PubMed] [Google Scholar]
- 35.Sheridan SD, Theriault KM, Reis SA, Zhou F, Madison JM, Daheron L, et al. Epigenetic characterization of the FMR1 gene and aberrant neurodevelopment in human induced pluripotent stem cell models of fragile X syndrome. PLoS One. 2011;6:e26203. doi: 10.1371/journal.pone.0026203. [DOI] [PMC free article] [PubMed] [Google Scholar]
- 36.Abraham S, Sheridan SD, Laurent LC, Albert K, Stubban C, Ulitsky I, et al. Propagation of human embryonic and induced pluripotent stem cells in an indirect co-culture system. Biochem Biophys Res Commun. 2010;393:211–216. doi: 10.1016/j.bbrc.2010.01.101. [DOI] [PMC free article] [PubMed] [Google Scholar]
- 37.Sheridan SD, Surampudi V, Rao RR. Analysis of embryoid bodies derived from human induced pluripotent stem cells as a means to assess pluripotency. Stem Cells Int. 2012;2012:738910. doi: 10.1155/2012/738910. [DOI] [PMC free article] [PubMed] [Google Scholar]
- 38.Shi Y, Kirwan P, Smith J, Robinson HP, Livesey FJ. Human cerebral cortex development from pluripotent stem cells to functional excitatory synapses. Nat Neurosci. 2012;15:477–486. S471. doi: 10.1038/nn.3041. [DOI] [PMC free article] [PubMed] [Google Scholar]
- 39.Lancaster MA, Renner M, Martin CA, Wenzel D, Bicknell LS, Hurles ME, et al. Cerebral organoids model human brain development and microcephaly. Nature. 2013;501:373–379. doi: 10.1038/nature12517. [DOI] [PMC free article] [PubMed] [Google Scholar]
- 40.Lee YB, Bantounas I, Lee DY, Phylactou L, Caldwell MA, Uney JB. Twist-1 regulates the miR-199a/214 cluster during development. Nucleic Acids Res. 2009;37:123–128. doi: 10.1093/nar/gkn920. [DOI] [PMC free article] [PubMed] [Google Scholar]
- 41.Florio M, Huttner WB. Neural progenitors, neurogenesis and the evolution of the neocortex. Development. 2014;141:2182–2194. doi: 10.1242/dev.090571. [DOI] [PubMed] [Google Scholar]
- 42.Englund C, Fink A, Lau C, Pham D, Daza RA, Bulfone A, et al. Pax6, Tbr2, and Tbr1 are expressed sequentially by radial glia, intermediate progenitor cells, and postmitotic neurons in developing neocortex. J Neurosci. 2005;25:247–251. doi: 10.1523/JNEUROSCI.2899-04.2005. [DOI] [PMC free article] [PubMed] [Google Scholar]
- 43.Cobos I, Calcagnotto ME, Vilaythong AJ, Thwin MT, Noebels JL, Baraban SC, et al. Mice lacking Dlx1 show subtype-specific loss of interneurons, reduced inhibition and epilepsy. Nat Neurosci. 2005;8:1059–1068. doi: 10.1038/nn1499. [DOI] [PubMed] [Google Scholar]
- 44.Penna E, Orso F, Taverna D. miR-214 as a key hub that controls cancer networks: small player, multiple functions. J Invest Dermatol. 2015;135:960–969. doi: 10.1038/jid.2014.479. [DOI] [PubMed] [Google Scholar]
- 45.Hou J, Lin L, Zhou W, Wang Z, Ding G, Dong Q, et al. Identification of miRNomes in human liver and hepatocellular carcinoma reveals miR-199a/b-3p as therapeutic target for hepatocellular carcinoma. Cancer Cell. 2011;19:232–243. doi: 10.1016/j.ccr.2011.01.001. [DOI] [PubMed] [Google Scholar]
- 46.Pucilowska J, Puzerey PA, Karlo JC, Galan RF, Landreth GE. Disrupted ERK signaling during cortical development leads to abnormal progenitor proliferation, neuronal and network excitability and behavior, modeling human neuro-cardio-facial-cutaneous and related syndromes. J Neurosci. 2012;32:8663–8677. doi: 10.1523/JNEUROSCI.1107-12.2012. [DOI] [PMC free article] [PubMed] [Google Scholar]
- 47.Samuels IS, Karlo JC, Faruzzi AN, Pickering K, Herrup K, Sweatt JD, et al. Deletion of ERK2 mitogen-activated protein kinase identifies its key roles in cortical neurogenesis and cognitive function. J Neurosci. 2008;28:6983–6995. doi: 10.1523/JNEUROSCI.0679-08.2008. [DOI] [PMC free article] [PubMed] [Google Scholar]
- 48.Zhang J, Shemezis JR, McQuinn ER, Wang J, Sverdlov M, Chenn A. AKT activation by N-cadherin regulates beta-catenin signaling and neuronal differentiation during cortical development. Neural Dev. 2013;8:7. doi: 10.1186/1749-8104-8-7. [DOI] [PMC free article] [PubMed] [Google Scholar]
- 49.Gonzales ML, LaSalle JM. The role of MeCP2 in brain development and neurodevelopmental disorders. Curr Psychiatry Rep. 2010;12:127–134. doi: 10.1007/s11920-010-0097-7. [DOI] [PMC free article] [PubMed] [Google Scholar]
- 50.Hammer S, Dorrani N, Dragich J, Kudo S, Schanen C. The phenotypic consequences of MECP2 mutations extend beyond Rett syndrome. Ment Retard Dev Disabil Res Rev. 2002;8:94–98. doi: 10.1002/mrdd.10023. [DOI] [PubMed] [Google Scholar]
- 51.Akbarian S, Chen RZ, Gribnau J, Rasmussen TP, Fong H, Jaenisch R, et al. Expression pattern of the Rett syndrome gene MeCP2 in primate prefrontal cortex. Neurobiol Dis. 2001;8:784–791. doi: 10.1006/nbdi.2001.0420. [DOI] [PubMed] [Google Scholar]
- 52.Chen RZ, Akbarian S, Tudor M, Jaenisch R. Deficiency of methyl-CpG binding protein-2 in CNS neurons results in a Rett-like phenotype in mice. Nat Genet. 2001;27:327–331. doi: 10.1038/85906. [DOI] [PubMed] [Google Scholar]
- 53.Guy J, Hendrich B, Holmes M, Martin JE, Bird A. A mouse Mecp2-null mutation causes neurological symptoms that mimic Rett syndrome. Nat Genet. 2001;27:322–326. doi: 10.1038/85899. [DOI] [PubMed] [Google Scholar]
- 54.Luikenhuis S, Giacometti E, Beard CF, Jaenisch R. Expression of MeCP2 in postmitotic neurons rescues Rett syndrome in mice. Proc Natl Acad Sci U S A. 2004;101:6033–6038. doi: 10.1073/pnas.0401626101. [DOI] [PMC free article] [PubMed] [Google Scholar]
- 55.Chang Q, Khare G, Dani V, Nelson S, Jaenisch R. The disease progression of Mecp2 mutant mice is affected by the level of BDNF expression. Neuron. 2006;49:341–348. doi: 10.1016/j.neuron.2005.12.027. [DOI] [PubMed] [Google Scholar]
- 56.Ogier M, Wang H, Hong E, Wang Q, Greenberg ME, Katz DM. Brain-derived neurotrophic factor expression and respiratory function improve after ampakine treatment in a mouse model of Rett syndrome. J Neurosci. 2007;27:10912–10917. doi: 10.1523/JNEUROSCI.1869-07.2007. [DOI] [PMC free article] [PubMed] [Google Scholar]
- 57.Schmid DA, Yang T, Ogier M, Adams I, Mirakhur Y, Wang Q, et al. A TrkB small molecule partial agonist rescues TrkB phosphorylation deficits and improves respiratory function in a mouse model of Rett syndrome. J Neurosci. 2012;32:1803–1810. doi: 10.1523/JNEUROSCI.0865-11.2012. [DOI] [PMC free article] [PubMed] [Google Scholar]
- 58.Tropea D, Giacometti E, Wilson NR, Beard C, McCurry C, Fu DD, et al. Partial reversal of Rett Syndrome-like symptoms in MeCP2 mutant mice. Proc Natl Acad Sci U S A. 2009;106:2029–2034. doi: 10.1073/pnas.0812394106. [DOI] [PMC free article] [PubMed] [Google Scholar]
- 59.Davis BN, Hilyard AC, Lagna G, Hata A. SMAD proteins control DROSHA-mediated microRNA maturation. Nature. 2008;454:56–61. doi: 10.1038/nature07086. [DOI] [PMC free article] [PubMed] [Google Scholar]
- 60.Bauman ML, Kemper TL, Arin DM. Pervasive neuroanatomic abnormalities of the brain in three cases of Rett’s syndrome. Neurology. 1995;45:1581–1586. doi: 10.1212/wnl.45.8.1581. [DOI] [PubMed] [Google Scholar]
- 61.Armstrong DD. Rett syndrome neuropathology review 2000. Brain Dev. 2001;23(Suppl 1):S72–76. doi: 10.1016/s0387-7604(01)00332-1. [DOI] [PubMed] [Google Scholar]
- 62.Armstrong D, Dunn JK, Antalffy B, Trivedi R. Selective dendritic alterations in the cortex of Rett syndrome. J Neuropathol Exp Neurol. 1995;54:195–201. doi: 10.1097/00005072-199503000-00006. [DOI] [PubMed] [Google Scholar]
- 63.Mariani J, Coppola G, Zhang P, Abyzov A, Provini L, Tomasini L, et al. FOXG1-Dependent Dysregulation of GABA/Glutamate Neuron Differentiation in Autism Spectrum Disorders. Cell. 2015;162:375–390. doi: 10.1016/j.cell.2015.06.034. [DOI] [PMC free article] [PubMed] [Google Scholar]
- 64.Ariani F, Hayek G, Rondinella D, Artuso R, Mencarelli MA, Spanhol-Rosseto A, et al. FOXG1 is responsible for the congenital variant of Rett syndrome. Am J Hum Genet. 2008;83:89–93. doi: 10.1016/j.ajhg.2008.05.015. [DOI] [PMC free article] [PubMed] [Google Scholar]
- 65.Ito-Ishida A, Ure K, Chen H, Swann JW, Zoghbi HY. Loss of MeCP2 in Parvalbumin-and Somatostatin-Expressing Neurons in Mice Leads to Distinct Rett Syndrome-like Phenotypes. Neuron. 2015;88:651–658. doi: 10.1016/j.neuron.2015.10.029. [DOI] [PMC free article] [PubMed] [Google Scholar]
- 66.Selvamani A, Sathyan P, Miranda RC, Sohrabji F. An antagomir to microRNA Let7f promotes neuroprotection in an ischemic stroke model. PLoS One. 2012;7:e32662. doi: 10.1371/journal.pone.0032662. [DOI] [PMC free article] [PubMed] [Google Scholar]
- 67.Cimadamore F, Amador-Arjona A, Chen C, Huang CT, Terskikh AV. SOX2-LIN28/let-7 pathway regulates proliferation and neurogenesis in neural precursors. Proc Natl Acad Sci U S A. 2013;110:E3017–3026. doi: 10.1073/pnas.1220176110. [DOI] [PMC free article] [PubMed] [Google Scholar]
- 68.Tsujimura K, Irie K, Nakashima H, Egashira Y, Fukao Y, Fujiwara M, et al. miR-199a Links MeCP2 with mTOR Signaling and Its Dysregulation Leads to Rett Syndrome Phenotypes. Cell Rep. 2015;12:1887–1901. doi: 10.1016/j.celrep.2015.08.028. [DOI] [PubMed] [Google Scholar]
- 69.del Gaudio D, Fang P, Scaglia F, Ward PA, Craigen WJ, Glaze DG, et al. Increased MECP2 gene copy number as the result of genomic duplication in neurodevelopmentally delayed males. Genet Med. 2006;8:784–792. doi: 10.1097/01.gim.0000250502.28516.3c. [DOI] [PubMed] [Google Scholar]
- 70.Van Esch H, Bauters M, Ignatius J, Jansen M, Raynaud M, Hollanders K, et al. Duplication of the MECP2 region is a frequent cause of severe mental retardation and progressive neurological symptoms in males. Am J Hum Genet. 2005;77:442–453. doi: 10.1086/444549. [DOI] [PMC free article] [PubMed] [Google Scholar]
- 71.Klein ME, Lioy DT, Ma L, Impey S, Mandel G, Goodman RH. Homeostatic regulation of MeCP2 expression by a CREB-induced microRNA. Nat Neurosci. 2007;10:1513–1514. doi: 10.1038/nn2010. [DOI] [PubMed] [Google Scholar]
- 72.Ricciardi S, Boggio EM, Grosso S, Lonetti G, Forlani G, Stefanelli G, et al. Reduced AKT/mTOR signaling and protein synthesis dysregulation in a Rett syndrome animal model. Hum Mol Genet. 2011;20:1182–1196. doi: 10.1093/hmg/ddq563. [DOI] [PubMed] [Google Scholar]
- 73.Casanova EL, Casanova MF. Genetics studies indicate that neural induction and early neuronal maturation are disturbed in autism. Front Cell Neurosci. 2014;8:397. doi: 10.3389/fncel.2014.00397. [DOI] [PMC free article] [PubMed] [Google Scholar]
- 74.Gulsuner S, Walsh T, Watts AC, Lee MK, Thornton AM, Casadei S, et al. Spatial and temporal mapping of de novo mutations in schizophrenia to a fetal prefrontal cortical network. Cell. 2013;154:518–529. doi: 10.1016/j.cell.2013.06.049. [DOI] [PMC free article] [PubMed] [Google Scholar]
Associated Data
This section collects any data citations, data availability statements, or supplementary materials included in this article.