

Abstract
Almost a decade ago, hyperspectral imaging (HSI) was employed by the NASA in satellite imaging applications such as remote sensing technology. This technology has since been extensively used in the exploration of minerals, agricultural purposes, water resources, and urban development needs. Due to recent advancements in optical re-construction and imaging, HSI can now be applied down to micro- and nanometer scales possibly allowing for exquisite control and analysis of single cell to complex biological systems. This short review provides a description of the working principle of the HSI technology and how HSI can be used to assist, substitute, and validate traditional imaging technologies. This is followed by a description of the use of HSI for biological analysis and medical diagnostics with emphasis on single-cell analysis using HSI.
Keywords: spectroscopy, surface plasmon resonance, multivariate curve resolution, spectral angle mapping, stem cell differentiation, nanorods
Introduction
Nanotechnology applications are becoming omnipresent in a variety of daily activities and research endeavors. For example, investigating, fabricating, and modifying substances at the nanoscale have helped advance and transform products ranging from clothing/wearable technologies, bio-sensors, coatings with self-healing capacities, energy storage and transmission, sports equipment to computers. Concurrently, significant improvements in the field of nano-imaging and analysis have vastly improved the modalities in precision/personalized medicine, targeted drug delivery systems and image-guided surgery. To further advance these transformative activities precise and highly accurate probing methods to detect, characterize, and measure distinct characteristics of nanosubstances are required, apart from the currently available microscopy and spectroscopy technologies such as optical microscopy [1], transmission electron microscopy (TEM), electron energy-loss spectroscopy [2], cryo-electron-microscopy [3], atomic force microscopy (AFM) [4], scanning ion-conductance microscopy, atom probe tomography [5], positron emission tomography[6], scanning electro-chemical microscopy [7], X-ray microscopy [8], linear and nonlinear vibrational spectroscopy [9], mass spectrometry, Fourier-transformed infrared spectroscopy and nuclear magnetic resonance imaging with paramagnetic metal particles [10]. Microscopy technologies provide two-dimensional intensity information at each pixel (x, y) of the images. On the other hand, spectroscopy technologies provide averaged spectral information (λ) of the entire field of view. Hyperspectral imaging (HSI) combines both of these modalities by providing intensity and spectral information (x, y, λ) at each pixel.
When a precisely deflected beam of light enters or impinges upon a heterogeneous sample (for example, a surface or a biological tissue or cell), various light-matter interactions such as scattering, absorption, and transmission takes place due to the intrinsic radiative properties of the surface and/or the sample. These radiative properties can be correlated to, and are intrinsic, to the multiple multisized structures and/or organelles present within the sample. The underlying principle of spectral imaging (e.g., HSI), thus, is simple and straightforward: By quantifying the radiative properties (reflectance in-homogeneities) for a given sample at the subwavelength level, it should be possible to analyze and assess characteristics of the system under investigation. Spectral imaging is typically achieved by a combination of optical imaging with specialized spectrographic attachments for data storage as well as specialized software for data analysis [11]. Due to successive advancements in optical simulation techniques and optics, spectral imaging can now be translated down to macro- and nanoscales and radiative properties collected across the entire electromagnetic spectrum; such a system is termed as HSI. Specifically, advances in dark-field imaging conditions enabled high contrast and signal-to-noise ratio and consequently, an ability to focus light on samples with high collimation even at oblique angles and with controlled detection settings [12–14]. HSI enables precise information (quantitative and qualitative) about various surfaces and morphologies to be stored in the form of optical images. These optical images consist of hundreds of pixels; each pixel is stored as a three-dimensional (3D) hypercube data set containing information on two spectral dimensions and one spatial dimension [15,16]. Ideally, the hypercube data from the entire electromagnetic spectrum in visible-near infrared range are stored using an imaging spectrophotometer. The stored data can then be compared and cross-correlated with previously obtained reference spectral libraries to develop protocols for precise and quick analysis of micro- and nanomaterials. Additionally, by integrating HSI with other imaging techniques, one can produce complimentary data; for example, in combination with fluorescence microscopy, one can also obtain information about chemical changes or by solely using light for quantification without any additional probes, one can develop noninvasive medical diagnostic platforms as well as image guided surgical techniques [15].
This review is organized to give a brief description of the operating principles and the limitations of HSI as well as a description of the various components within a typical HSI system. This is followed by an overview of the optical properties of biological systems along with a brief survey of the current diagnostic modalities for biological imaging/medical diagnostics. A comparative analysis of HSI and conventional diagnostic platforms/methods is then presented. The review then concludes with summary and future directions for single-cell analysis and medical imaging applications of HSI.
Hyperspectral Imaging: Operating Principles, Hardware, Software, and Limitations
Traditionally, the following spectral ranges have been defined for various imaging techniques: ultraviolet (200–400 nm), visible (400–780 nm), near-infrared (780–2500 nm), and mid-infrared (2500–25,000 nm), as shown in Fig. 1. Figure 1(a) depicts some of the major differences between various imaging modalities: monochrome, RGB, spectroscopy, multispectral, and hyperspectral imaging. Monochrome collects light interacting with a sample at a single wavelength, RGB at three distinct wavelengths (red, green, and blue) as well as information on the location (spatial) from which the light is being collected while spectroscopy allows a full range of wavelengths to be collected but not the location, while multispectral imaging or HSI allows a full range of wavelengths to be collected as well as location information [15]. However, multispectral imaging has a spectral resolution greater than 10 nm and the number of spectral bands are limited from three to ten spaced bands while commercially available HSI systems have a finer resolution (<5 nm) with spectral bands numbering from tens to hundreds in a continuous range (as shown in Fig. 1(a)). The differences between HSI and RGB are illustrated in Fig. 1(b), which depicts light reflectance curve of a single pixel from an arbitrary sample imaged using both these methods. The hyperspectral image contains information in a continuous visible near-infrared spectrum compared to the intensity curve from RGB imaging that provides data centered at only three prominent wavelengths. The additional spectral information contained with the continuous hyperspectral image can be utilized to more accurately analyze and understand micro- and nanoscale features that are not feasible using the discrete RGB imaging dataset [15–17]. Additionally, HSI, unlike other spectral imaging methods, collects and processes information from across the entire electromagnetic spectrum [11–14,18–21]; see Fig. 2 for a schematic diagram of a typical HSI system. The various hardware components of a typical HSI system are as follows:
Fig. 1.
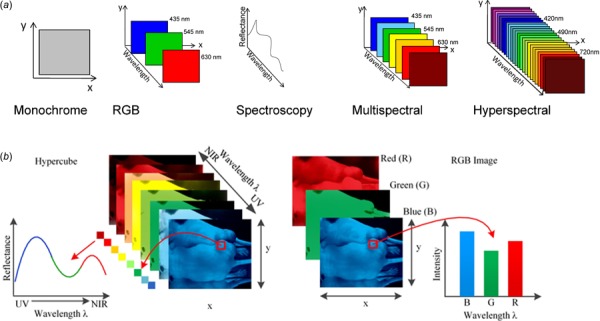
(a) Schematic showing the features of monochrome, red-green-blue (RGB), spectroscopy, multispectral, and HSI [17]. As shown in the figure, both spectroscopy and HSI can store wavelength information over the entire spectrum. However, spectroscopy cannot provide precise spatial (location within the sample) information. RGB imaging does not allow for spectral information at all (information across multiple wavelengths) and is insensitive to components that are at different wavelengths than red (630 nm), green (545 nm) and blue (435 nm) but does enable spatial information. Spectroscopy allows for spectral information to be gleaned but doesn't allow for spatial information. HSI (300–2600 nm) can collect spatial, spectral, multicomponent while being sensitive to a variety of different wavelengths or components. (b) Detailed comparison showing the differences between HSI and RGB imaging [15]. The figure depicts light reflectance curve of a single pixel from an arbitrary sample imaged using hyperspectral spectroscopy and RGB imaging. The hyperspectral image contains information in a continuous visible near-infrared spectrum compared to the intensity curve from RGB imaging that provides data at only three prominent wavelengths. The additional spectral information contained with the continuous hyperspectral image can be utilized to more accurately analyze and understand micro- and nanoscale features that are not feasible using the discrete RGB imaging dataset. The caption text refers to online color version of the figure.
Fig. 2.
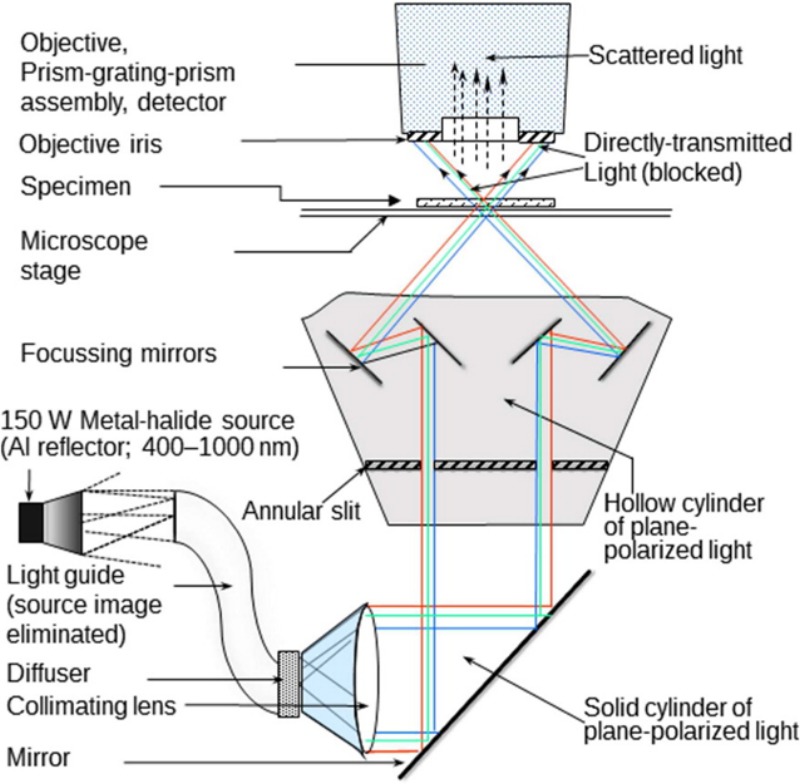
The various components in a CytoViva HSI system [14]. Briefly, the components are (i) a light source; (ii) a high resolution light collimator or adapter; (ii) mirror(s) to generate plane-polarized light or light dispersive elements to disperse incident white light into its constitutive spectra; (iii) a microscopy stage for the specimen; (iv) an optical module for bright- and dark-field analysis; (v) visible and near infra-red spectrometer to collect and convert electromagnetic energy into electrical signals for image formation; (vi) an image capture modality (see Fig. 3) and (vii) computer for data collection and software analysis (not shown).
-
(i)
a light source, to illuminate the sample and depending on the application, is either a light emitting diode or a halogen bulb or a tunable laser. The source image is eliminated by passing the light through light-guide and the image is further reflected inside a light adapter.
-
(ii)
a high-resolution light collimator or adapter.
-
(iii)
a visible and hyperspectral spectrometer or detector array, which is situated at the focal point in the HSI setup and receives and converts the electromagnetic energy into electrical signals for hyperspectral image formation. Charged-coupled devices (CCDs) are widely used as detector arrays and are mainly made up of materials like silicon, indium gallium arsenide, mercury cadmium telluride, and indium antimonite. A cooling system is typically attached to the CCDs to reduce thermal vibrations and to minimize dark-current noises. Other detector arrays used in HSI systems are photo-multiplier tubes and metal oxides [15].
-
(iv)
a stage that commonly includes an optical microscope or a Fourier transform spectrometer and/or a Raman imaging system.
-
(v)
an optical dual mode fluorescence module coupled with an optical imaging camera and other lens/slit combinations for bright-field and dark-field analysis.
-
(vi)
several light dispersive elements such as prism-grating, monochromatic lens, or optical filters. These elements disperse incident white light into its constituent color spectrum and project the spectrum onto the detector arrays.
-
(vii)
Different HSI image capture schemes are implemented in commercial microscopy systems. These HSI image capture schemes are classified as whiskbroom (spatial or point scan), push broom (line scanning), staring (spectral scan), and snapshot (no scan) and are shown in Fig. 3. A more detailed description of these approaches can be found in the following excellent Refs. [22–25]. All these hyperspectral data cube acquisition strategies affect the light throughput and image acquisition time. For example, the snapshot will be the fastest one as it captures the whole data cube in a single acquisition. Table 1 summarizes the mode of data acquisition for various HSI systems and their medical applications.
-
(viii)
Software for the hyperspectral imaging system is highly specialized. For example, the number of scan lines and the RGB default bands are user defined in accordance with the desired field of view and the sensitivity of the application. In general, 200–300 lines are sufficient for single cell imaging. Proprietary imaging software provides an easy to use interface to enhance acquired images and to improve the signal-to-noise ratio by filtering end wavelengths. Spectral data of each pixel or for a collection of selected area pixels as well as that of an entire image can be stored in the spectral library for further analysis. Ideally, the imaging software should also provide a normalizing procedure to filter out spectral irregularities, loss of information, and to account for false information due to effects of fiber optics cables, camera, and the spectrograph. The most important function embedded within the imaging software is the single angle mapper (SAM) or spectral angle mapping function. As described in the CytoViva system user manual, the SAM method determines the distance from the origin to the intensity of light registered in each band of the known spectrum (such as control or reference sample) and the unknown spectrum (target sample under probe) and stores this as an N-dimensional vector(s). The direction of these vector(s) is a unit vector in the N-dimensional space representing the unknown as well as the reference spectrum. The angle between these two unit vectors one obtained from the sample and another from the reference is a measure of spectral match or mismatch between them. Thus, by analyzing the data cube and comparing the spectrum at each pixel from different samples, one can deduce similarities and differences between samples and subsequently, if baseline (reference) libraries are available, precise, and quantitative analysis of the samples can also be performed with the purpose of finding objects, identifying materials, or detecting processes.
Fig. 3.
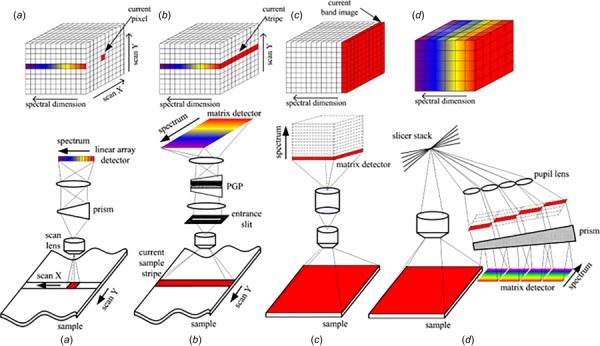
Schematic showing different approaches used for HSI [17]: (a) Whiskbroom, (b) push broom, (c) staring, (d) snapshot. Briefly, the dispersive element for whiskbroom, push broom, and snapshot is either a prism, a grating, or a prism gating prism while for spectral scan, it is a tunable filter or an interferometer. The wavelength range is wide for whiskbroom, push broom, and snapshot while it is medium for staring. The wavelength selection is partial for both whiskbroom and push broom and complete for staring and unavailable in snapshot. The spectral resolution is high for both whiskbroom and push broom while it is low for snapshot and medium for staring. Whiskbroom and staring are hyperspectral while snapshot is multispectral. The throughput is high for whiskbroom, push broom, and snapshot and low for staring. The data cube collection is relatively long for both whiskbroom and push broom while it is short for staring and fast for snapshot. However, the complexity is high for whiskbroom and push broom while it is simple for staring and medium for snapshot. The associated costs are low for both whiskbroom and push broom, medium for snapshot, and high for staring.
Table 1.
A summary of various HSI systems and their medical applications
| Mode of acquisition | Medical application | Spectral range | Measurement modality | Ref. |
|---|---|---|---|---|
| Staring | Wound | 400–720 nm | Reflectance | [26] |
| Staring | 500–600 nm | Reflectance | [27] | |
| Push broom | 530–680 nm | Transmission | [28] | |
| Staring | 400–1100 nm | Reflectance | [29] | |
| Staring | Cancer | 400–720 nm | Reflectance | [30] |
| Staring | 450–950 nm | Reflectance | [31] | |
| Push broom | 1000–2500 nm | Reflectance | [32] | |
| Staring | 450–700 nm | Reflectance | [33] | |
| Staring | 440–640 nm | Fluorescence and Reflectance | [34] | |
| Staring | 330–480 nm | Fluorescence and Reflectance | [35] | |
| Push broom | Skin | 400–2500 nm | Reflectance | [36,37] |
| Push broom | 365–800 nm | Transmission | [38] | |
| Staring | Nerves | 550–1000 nm | Transmission | [39] |
| Staring | Dental | 900–1700 nm | Reflectance | [40] |
| Push broom | Laryngeal disorders | 390–680 nm | Reflectance | [41] |
| Push broom | Heart | 410–1000 nm | Reflectance and fluorescence | [42] |
| Push broom | Intestine | 400–1700 nm | Reflectance | [43] |
| Snapshot | Eye | 450–700 nm | Reflectance | [44] |
| Staring | Blood Vessel | 400–720 nm | Fluorescence | [45] |
| Staring | Crevice | 200–700 nm | Fluorescence and Reflectance | [46] |
Table 2 provides a summary of the current commercially available HSI systems. Briefly, spectral resolution below 1 nm can be achieved using hyperspectral imaging systems from P&P Optica, Photon Etc., Gooch & and PARISS. Other commercially available HSI systems include Montana-based Resonon and Alabama-based CytoViva both of whom offer resolution of ∼2 nm while the San Diego-based Surface Optics Corporation has a lower resolution of ∼4 nm. Irrespective of the resolution of these systems, all of these systems are capable of assessing subcellular components (at submicron scales). Thus, there is no relative advantage or disadvantage between these systems for single cell analysis. However, P&P Optica offers wider spectral range from 350–2500 nm (i.e., the spectrum of visible and near-infrared) while the other three systems have a range within visible and some part of near-infrared region (i.e., between 360–1000 nm). Although it should be noted that the spectral range of those system can be increased by changing the Si-based detector to InGaAs detectors for the short-wave infra-red regions. The wider spectral range should theoretically enable more information to be gleaned from the system but the accompanying complexity in data analysis should also be noted. The light source used in the system from Photon etc. is a laser compared to halogen light sources offered in most other systems. Norway headquartered Norsk Elekto Optikk offers relatively different illumination mode consisting of a light emitting diode source. CytoViva hyperspectral imaging system is comparatively newer and has been most widely used in recent research studies [47]. The relative advantages and disadvantages of these systems are dependent on the choice of specific applications as well as the availability of references libraries for data analysis, all of which can affect the overall cost of the system.
Table 2.
A summary of the current commercially available HSI systems
| Commercially available hyperspectral imaging systems | Spectral resolution | Illumination source for the HSI | Spectral range | Software | Origin |
|---|---|---|---|---|---|
| Bayspec | <5 nm | — | 600–1000 nm | ENVI | California, USA |
| CytoViva | 2.0 nm | High intensity halogen | 400–1000 nm | ENVI | Alabama, USA |
| Gooch & Housego | 0.6 nm | Halogen | 400–1000 nm | -Manager | Ilminster, United Kingdom |
| Norsk Elektro Optikk | 3.7 nm | LED | 400–2500 nm | — | Skedsmokorset, Norway |
| PARISS | 1 nm | Application based | 365–920 nm | PARISS | USA |
| P&P Optica | 0.1 nm | Halogen | 350–2500 nm | PPO IRIS | Ontario, Canada |
| Photon Etc. | 0.2 nm | Tunable laser | 400–1000 nm | PHySpec | Montreal, Canada |
| Resonon | 2.1 nm | Halogen | 350–1700 nm | SpectrononPro | Montana, USA |
| SPECIM | 2.8 nm | Application based | 400–1000 nm | SpecSensor SDK | Oulu, Finland |
| Surface Optics Corporation | 4.68 nm | Halogen | 400–1000 nm | SRAnalysis | California, USA |
Single-Cell Analysis and Medical Imaging Applications for Hyperspectral Imaging
Although individual cells in a particular organ, tissue, or cell culture may be morphologically and genetically identical, they are heterogeneous in nature. Study of single cells will enable the analysis of cell-to-cell variations within a heterogeneous population. These variations are important for further analysis and understanding of disease propagation, drug development, stem cell differentiation, embryos development, and how cells respond to each other and their environment. Some of the most commonly used single-cell imaging techniques include differential interference contrast (DIC), scanning electron microscopy (SEM), AFM, laser scanning confocal fluorescence microscopy, fluorescence cross-correlation spectroscopy (FCCS), and matrix-assisted laser desorption/ionization-mass spectrometry (MALDI-MS) [48–54] (Fig. 4). The primary advantage of HSI over these techniques is an ability to allow for a more accurate segmentation and classification of the acquired image. For example, in cellular imaging, taking into account only monochromatic color change to detect abnormalities is always not enough as certain bio-phenomena might not produce significant optical contrast. HSI offers a significant advantage by storing the value of an entire spectrum within one single pixel in the image along with the precise spatial (location) information. As is well known, biological cells are composed of different subcellular level organelles varying in size that ranges from a couple of nanometers to a few tens of microns. Scattering and absorption of light from each of these minor components are mainly dependent on their molecular composition. Refractive index of the components such as fatty acids which find a match with index of HSI microscope objective lubricant show extremely redundant high-noise spectra whereas organelles such as mitochondria are the dominant scatters. Scattering spectra variation from the cellular walls is mainly due to structural formation against molecular composition [15]. Hence, the absorbed, scattered, and transmitted light from the biological sample captured by HSI at a resolution less than 50 nm can capture spectral data from minute components of a single cell. This facility is not possible to achieve in spectroscopy, RGB or monochrome.
Fig. 4.
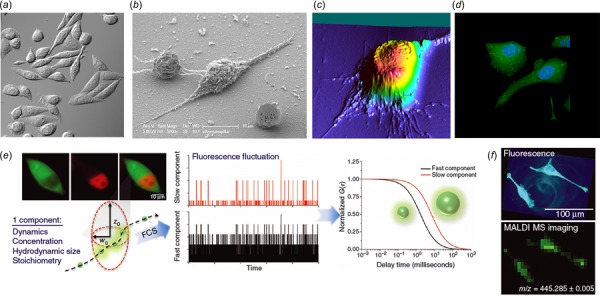
Conventional cell imaging approaches. Images of CHO cells using (a) DIC [51]. DIC is an optical microscopy methodology based on beam-shearing interference system, i.e., optical rays illuminated at oblique angles create interference patterns to generate 3D images. Unlike HSI, DIC does not capture the surface (or spectral) variations between samples. (b) SEM [52]. Compared to HSI, SEM is an expensive electron gun-assisted imaging technique and suffers from sample distortion and biological vaporization due to the high voltage current applied. (c) AFM. Contact or noncontact probes in AFM do generate precise results for relatively hard surface topography but the probing pressure has the potential to alter results obtained on biological membranes due to their soft and pliable nature. Additionally, interior (subsurface) abnormalities and dynamic physiological process are hard if not impossible to quantify using AFM methods. (d) Laser scanning confocal fluorescence microscopy (LSCFM) [52]. Unlike HSI, living specimens for LSCFM require special care. Additionally, LSCFM can generate false labels when the specimens are sensitive to fluorophores and photobleaching and also result in weak signals due to low concentration of fluorescent markers limiting the scanning probe data. (e) FCCS to perform single-cell analysis to monitor the dynamic motion of biomolecules [53]. Unlike HSI, FCCS cannot capture both location (spatial) and surface (spectral) information, and data can only be obtained in a limited region potentially missing vital information at other locations within the sample. (f) Image of 3,3′-Dihexyloxacarbocyanine iodide [DIOC6(3)] inside a single cell using MALDI-MS [54]. Although. MALDI is an excellent tool to understand the chemical composition of cellular components, the sample preparation method is rather involved and cumbersome. MALDI also does not enable repeated measurements from the same sample due to laser vaporization of the sample during the measurement process and also does not allow in vivo analysis. The interested reader is referred to the cited references for further details on the imaging modalities.
As noted earlier, a primary requirement for the use of HSI is a reference library (or prior knowledge of the optical-radiative properties of control samples). Fortuitously, an extensive body of supporting literature exists to describe the optical properties of biological samples (such as absorption and scattering in tissues, fluorescence anisotropy, diffused scattering, refractive index modulation within cells) and their properties/values have been extensively studied and tabulated [55–57]. An excellent review by Jacques [58] calculates the anisotropy, g, to characterize the effective scattering in tissues in terms of optical absorption coefficient (μa), average hemoglobin concentration in the tissue, scattering coefficient (μs), and angle of scattering (p(θ)). Jacques [58] argues that “generic tissue” properties may be adequate, but not sufficient to address subject specific, temporal, and variations between patients. Thus, accurate prediction(s) will necessitate real-time optical property quantification when working on individual patients as well as in analyzing the in vitro response of cell populations, a task which HSI is uniquely qualified to accomplish.
Extensive literature exists for single-cell analysis of cancer cells and tissues. Here, we will focus on the monitoring and quantification of stem cell functionality, viability, and/or differentiation. Controlled differentiation and maintaining the purity of differentiated cells are two of the most important challenges today in stem cell research. For example, it is important to monitor stem cell differentiation carefully for clinical application as undifferentiated implanted cells may lead to teratomas. Routinely used methods include cell staining and flow sorting techniques; cell staining can be tedious, laborious, and error-prone if improperly handled or assessed, while cell sorting techniques are quite fast and quantitative but are population/average based and are unable to capture cell to cell variations and spatial variations within the cell sample. Additionally, due to photo-bleaching and photo-stability issues, the cell-sorting technique cannot readily be translated for use with long-term cell differentiation studies. Both these techniques, cell staining and flow methods are also damaging and rate-limiting processes, i.e., cells utilized for these assays are treated as waste materials and unable to be processed further. Thus, additional matching and duplicate/representative samples need to be prepared for parallel biological assays (e.g., ribonucleic acid, complementary deoxyribonucleic acid analysis) studies. For example, to monitor the progression of osteogenesis in stem cells, at different time points, requires multiple cell cultures with a concomitant reduction in efficiency and an increased use of costly operational resources [59].
In general, spectroscopy-based techniques are also ideally suited to address the challenge of stem cell sorting and to ensure their purity (see Fig. 5 for some examples of label-free imaging of single cells using Raman spectroscopy). Currently available and magnetic bead-based cell sorting assays are limited and cell specific, and suboptimal for therapy. Hence, there is a need to develop techniques that are noninvasive, sensitive, easy to use, and rapid, to analyze single cells as well as to monitor or sort through a population of cells. Specifically, an HSI-based spectroscopic mapping method has the potential to rapidly and noninvasively monitor cell differentiation. The usage of spectroscopy-based techniques will also allow for a direct correlation between the osteogenic (mineralization) data and ribonucleic acid/complementary deoxyribonucleic acid analysis. This capability has the potential to significantly improve the robustness and sensitivity of cell differentiation studies. In addition, by combining microfluidic devices and technologies to the spectroscopy-based techniques, the HSI system can achieve high-throughput screening as well as sorting-based assays [60–63].
Fig. 5.
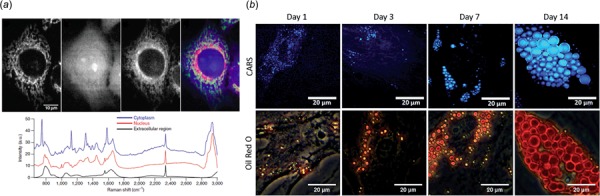
Label-free imaging of single cell using Raman spectroscopy. (a) Raman scattering images of unstained living HeLa cells at 753 cm−1 (showing cytochrome c), 1686 cm−1 (showing protein), and 2852 cm−1 (showing lipid). The fourth image is an overlay image merging intracellular distribution of cytochrome c, protein, and lipid colored as green, blue, and red channels, respectively. The excitation laser wavelength was 532 nm [60]. The authors demonstrated an easy to construct Raman microscope with high resolution as well as dynamic surface imaging. (b) Comparison of Coherent anti-Stokes Raman scattering imaging and Oil Red O stained images for adipogenic differentiation of skeletal stem cells (SSCs). SSCs were cultured in adipogenic media for 1, 3, 7, and 14 days. Scale bars correspond to 20 μm. Coherent anti-Stokes Raman scattering provided a chemically selective and label-free approach as well as higher sensitivity toward detection of small lipid droplets (blue) [61]. This study demonstrated an enhanced resolution and early analysis of adipogenesis in SSCs as well as delineating the lipid droplet changes within the stem cell. The caption text refers to online color version of the figure.
Vermaas et al. [20] combined fluorescence and a label-free Raman spectroscopy technique (resonance Raman scattering) to visualize carotenoid within the cell wall and the membranes of live photosynthetic (Synechocystis) cells. Vermaas et al. [20] utilized the hyperspectral confocal fluorescence imaging system along with multivariate curve resolution (MCR) algorithms to achieve a spatial resolution that is diffraction-limited (∼ 250 × 250 × 600 nm). Vermass et al. [20] were then able to distinguish and analyze the maximum intensity of the fluorescence spectrum that was only 10–15 nm apart and also illustrated the confidence level of multivariate data by analyzing the signal-to-noise ratio of the experimental data as well as the level of the agreement between the experimentally collected and the simulated spectra. Thus, this MCR based approach by Vermaas et al. [20] allowed for a thorough analysis of each fluorescent component and their intensities compared to each other within a single cell in three dimensions. Interestingly, Haaland and Thomas [64] suggest an improvement over the MCR algorithm by using partially constrained models instead of the fully constrained MCR models used by Vermaas et al. [20]. Haaland and Thomas [64] applied the new partially constrained algorithm to fixed lung epithelial cells as well as to images of mercurochrome-stained endosperm portions of a wild-type corn seed and showed improved interpretability of the results. Thus, careful attention to the modalities of the MCR algorithms is required when analyzing the hyperspectral imaging data [65].
It is worth mentioning that, besides HSI, other spectroscopy techniques are also capable of doing single stem cell analysis with high spatial (x, y) resolution. Here, we will mention two of those techniques such as nonlinear Raman spectroscopy imaging (Fig. 5(b)) and surface plasmon resonance (SPR) imaging (Fig. 6). Those two techniques are chosen here as they are capable of performing video-rate acquisition similar to HSI. Wang et al. [66] presented a new label-free technique called electrochemical impedance (EIM) based on SPR. SPR are surface waves at a metal/dielectric interface due to the collective oscillation of free electrons, reported first by Wood in 1902 [67]. Subsequently, in 1968, both Otto [68] and Kretschmann and Raether [69] showed that SPR can be generated on a glass–metal interface using two different configurations. In the Otto's configuration, the thin metal film is separated from the glass block (prism) through which light with a precise wavelength and incident angle can undergo total internal reflection to generate SPR. In the Kretschmann and Raether's setup, the thin metal film is evaporated on to the glass block (prism) through which light with a precise wavelength and incident angle generate SPR. SPR is highly sensitive to refractive index changes and hence can be utilized as a sensor. However, the effectiveness of SPR lies within the penetration depth of the evanescent wave (typically ∼ 200 nm). The EIM method developed by Wang et al. [66] is based on the inter-dependence between SPR and the surface charge density as opposed to changes in refractive index resulting from the molecular binding process [70]. By simultaneously recording the optical, SPR, and EIM images, Wang et al. [66] studied the induction and progression of cellular apoptotic events in the human papilloma virus 16 infected cervical SiHa cell line (see Fig. 6) as well as electroporation in individual adherent cultured mammalian cells. Wang et al. [71] then imaged the cell–substrate interaction on a single cell with a resolution that is finer than the dimension of a cell. By varying the osmotic pressure from 300 mOsm to 350 mOsm (achieved by varying the concentration of mannitol in solution), they measured the associated SPR intensity changes. By postulating that the larger displacement obtained from the SPR intensity changes signifies smaller adhesion strength, they mapped the local adhesion strength of the cell to the substrate. Thus, the EIM method allowed Wang et al. [66] to monitor with submicron spatial resolution the dynamics of apoptosis and electroporation of individual cells with millisecond time resolution.
Fig. 6.
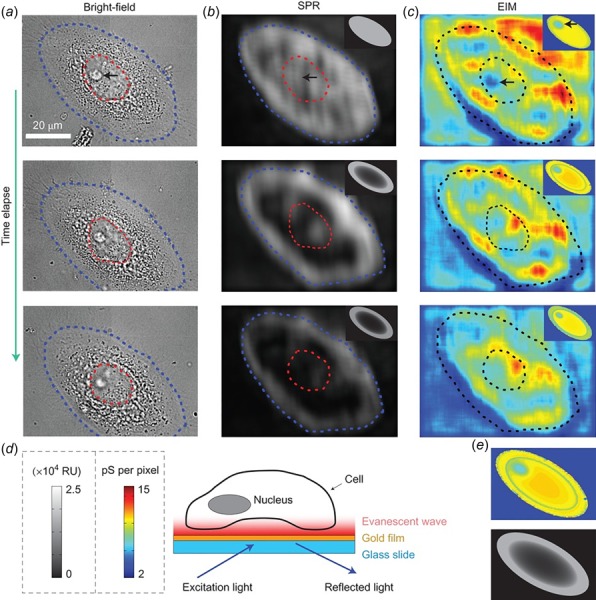
Impedance images of a human cervical cell using SPRi and electrical impedance microscopy (EIM)—see text and Wang et al. [66] for further details. (a) Bright field (b) SPR (c) EIM at 0 min (top row), 30 min (middle row), and 75 min (bottom row) after apoptosis treatment. EIM is a label-free, noninvasive imaging methodology with high spatial and temporal resolutions and provides localized impedance information not previously available [66]. (d) Schematic illustration showing the evanescent field of SPRi mainly localized near the bottom portion of a cell. (e) Simulated EIM (top) and SPR (bottom) images.
Current SPR imaging (SPRi) is typically achieved by scanning the laser and collecting the surface plasmon wave light using a microscope objective. SPRi can be generated through evanescent wave coupling of prism excitation or free wave coupling with metallic nanostructures. Being a label-free imaging modality, SPRi preserves the integrity of the cells and allows observation of external and internal cellular processes (within a penetration depth). So far, SPRi has been used for cell adhesion and basic cell biology studies [72] and for rapid and accurate detection of bacteria at low concentrations in health and food industries [73]. More importantly, these studies provided statistically significant data through the analysis of individual cells [74]. Thus, demonstrating that SPRi is capable of providing high spatial resolution required to perform single-cell level analysis as well as providing a wide field of view to observe a statistically significant number of cells concurrently within the analysis zone [75].
Building upon these early studies, recent advances in dark field-based HSI techniques represent an encouraging analytical tool for investigating objects that scatter efficiently (e.g., nanoparticles) in bio-systems. As stated earlier, HSI is capable of combining imaging with spectroscopy, thus allowing for the positive identification of the location and distribution of unknown nanoparticles in vivo or ex vivo [47]. Other advantages of using HSI systems over conventional imaging techniques include minimal and nondestructive sample preparation, rapid image acquisition and analysis, a relatively cheap and cost-effective system, and the ability to determine the spatial distribution and identification of materials in complex matrices (with known or custom-built reference libraries) [47]. HSI has also been successfully applied to provide real-time images of biomarker information and to analyze cell pathophysiology based on the spectral resonance characteristics of relevant tissues. Therefore, the use of HSI for medical diagnostics and image-guided surgeries is on an upward slope. HSI has been reportedly used for the diagnosis of peripheral artery disease, the assessment of hemorrhagic shock, early recognition of dental decay/cavities, faster classification of kidney stones, and in detecting laryngeal disorders [76–87] as summarized in Table 3 and also, briefly described below.
Table 3.
A summary of the single cell analysis/applications using HSI modalities
| Medical application | Study | Cell-line used | Equipment and mode | Software | Spectral range | Band/spectral wavelength | Resoln. | Label | Ref. |
|---|---|---|---|---|---|---|---|---|---|
| Alzheimer's disease | Amyloid aggregates | Human neuroblastoma cell line, SH-SY5Y | CytoViva Hyperspectral Microscope -Transmission | ENVI 4.4 | 400–1000 nm | 450–580 nm | 2.5 nm | No external labelInternal- N-terminal fluorescein isothiocyanate | [14] |
| Epigenetic screening (gene expression and genome stability) | Quantity of 5-carboxylcytosine (5caC) | Human breast adenocarcinoma cell line MCF-7, primary glioblastoma multiforme cell line SF767, and cervical cancer cell line HeLa | Home-built: Olympus BX51; CytoViva Condenser; CCD Spectrograph | NA | 350–900 nm | AuNPs 537-555 nm & AgNPs 419 nm | 0.5 nm | 30 nm Au & 20 nm Ag nanoparticles functionalized with anti-body | [12] |
| RBC | 8 Erythrocyte constituents | EDTA treated whole blood | CytoViva Hyperspectral Microscope | ENVI 4.4 | 400–1000 nm | 500–675 nm | 2 nm | No label | [13] |
| Parkinson's disease | Cellular iron | Neuroblastoma dopaminergic cells (SHSY5Y) | CytoViva Hyperspectral Imager | CytoViva Imaging, t-test SPSS19 | 600 nm | Near 500 nm | 40–90 nm | No external labelInternal label- Fe2+ to Fe3+ | [18] |
| Pigment localization and organization | Chlorophyll, phycobilins, and carotenoids | Cyanobacterium synechocystis PC 6803 | Hyperspectral confocal fluorescence microscopy, 488 nm Laser | Matlab, C++ | 500–800 nm | 500–750 nm | 1–500 nm and 3–800 nm | PC, APC and APC-B | [20] |
| White blood cells (WBC) | Active and Inactive neutrophils differentiation | Neutrophil granulocytes | CytoViva Hyperspectral Microscope | ENVI 4.4 | 400–1000 nm | 520 nm, 600 nm, 620 nm | 2.5 nm | No label | [19] |
| Cancer diagnosis | Differentiating noncancerous and cancerous cells | Noncancerous human fibroblasts, cervical cells, squamous cells, carcinoma cells | Nikon Eclipse 800, V100 Hyperspectral Camera System | ITD Hyper-Visual Software | 400–1000 nm | 470–690 nm | 2.5 nm | Hematoxylin and eosin | [76] |
| Dynamic imaging of live cells | Trafficking mechanisms of the epidermal growth factor receptor | A431 keratinocytes | Leica DM6000 and SPOT Pursuit XS Camera | C++ | 450–750 nm | 531–561 nm, 554–594 nm, 553–641 nm | — | Anti-EGFR Gold nanoparticles | [77] |
| Novel antifungal agents | Detecting antifungal efficacy of metal nanoparticle | Candida albicans cells and hyphae | Cytoviva Hyperspectral Microscope And Leitz LaborLux S Flourescence Microscope | AutoQuant X software v 2.0 | 400–100 nm | — | 90–100 nm | Metal nanoparticles | [78] |
| Cancer diagnosis | 3D Imaging of localized surface Anti-bodies | MDA-MB-231 cells (human Breast cancer cell-line) | Nikon Eclipse Ti Microscope with ORCA-R2 Camera | LabView | 400–1000 nm | 563–575 nm | 2.5 nm | Anti-CD44-PEG conjugated gold nanoparticles | [79] |
| Cellular imaging and therapy in cancer and atherosclerosis | Uptake of supra-magnetic nanoclusters by macrophages | Macrophages | PARISS Hyperspectral Imaging System | — | 300–780 nm | 532 nm, 730 nm, 755 nm | 2.5 nm | Iron oxide and gold nanoclusters | [80] |
| Cellular imaging applications | Cytotoxicity reduction of CTAB-Gold Nanorods using pluronic | Oral squamous cell carcinoma cell-line | Nikon Eclipse 80i with Hyperspectral Camera Module | — | 400–800 nm | 600–700 nm | — | Pluronic coated CTAB-Gold Nanorods | [81] |
| Ultrasensitive bio imaging applications | Gold Nano spheres and Gold Nanorods formulations | Oral squamous cell carcinoma cell line | Nikon Eclipse 80i with hyperspectral Camera Module | Spectral Cube And ENVI 4.6+IDL 7.0 | 400–1000 nm | 400–550 nm, 550–700 nm | 2.8 nm | Anti-EGFR Antibody-conjugated Gold Nanospheres and Gold Nanorods | [82] |
| Sugar beet diseases | The detection of Cercospora leaf-spot, powdery mildew and sugar beet rust | Sugar beet leaves | Optical Microscope with ImSpector V10E | Spectral cube and ENVI 4.6+IDL 7.0 | 400–1000 nm | 400–550 nm, 550–700 nm | 2.5 nm | No label | [83] |
| Photo-thermal tumor ablation | Irradiation of nano-aggregates to produce heat killing cancer cells | MDA-MB-231 cells | Cytoviva Hyperspectral System | ENVI 4.4 | 400–1000 nm | 550 nm, 785 nm | 2.5 nm | Nanoparticles | [84] |
| Oxygenation and hypoxia in tumor growth and angiogenesis | Micro-vascular tumor oxygen transport | 4T1 mouse mammary carcinoma cells | Zeiss Axioskop 2 | LabVIEW | 400–720 nm | 500–575 nm, 580–630 nm | — | GFP and RFP | [45] |
| Breast tumor diagnosis | Distinguish between tumor and normal tissues | Rat mammary gland tumor cells | MHSI Workstation with Kodak CCD | MATLAB and SAS version 9 | 450–700 nm | — | 10 nm, 5 nm between 500-600 nm | No label | [33] |
| Semi-quantitative Analysis of Hyperspectral Imaging | Synthetic nanoparticle uptake by Protozoa | Tetrahymena thermophila | Cytoviva Hyperspectral Microscope with dual mode fluorescence (DMF) | ENVI 4.8, R version 3.01, and ANOVA | 400–1000 nm | 521–547 nm, 641–677 nm, 635–651 nm, 660–710 nm, 432 nm, 791–829 nm | 2.5 nm | Au, Ag, TiO2, CuO nanoparticles | [85] |
| Prostate cancer detection | Classification of prostate tumor tissue | CWR22 cancer cells | CRi Camera Systems | LS-SVM | 450–950 nm | — | 2 nm | Hematoxylin and Eosin | [31] |
| Cytotoxicity evaluation of nanoparticles | Nanoparticles cellular uptake | Bronchial Epithelial cell-line BEAS-2B, Chinese hamster ovary cell line CHO, and the human embryonic kidney cell line HEK 293 | Cytoviva Hyperspectral Microscope 1.1 | ENVI | 400–1000 nm | 490 nm | 2.5 nm | Gold nanoparticles | [86] |
| Analysis of single erythrocytes | Erythrocyte | Human-derived ferrous-stabilized HbAo | Gooch & Housego OL490 coupled with Zeiss 63x achroplan and Hamamatsu ORCA2 | MATLAB IMAGE J and ENVI | 380–780 nm | 525–575 nm, 415 nm, 630 nm | 5 nm | NaNo2 | [87] |
As it stands, HSI spectral imaging is sufficiently validated as a modality for ex vivo Aβ aggregate detection in mouse brain and retina, in vitro screening of chemical entities for amyloidogenesis modulatory activity [14]. These findings have served as the basis for an extensive ongoing program on in vivo HSI imaging of live mouse/human retina [88,89]. Taking advantage of the plasmonic nanoprobes with characteristic localized SPR, Wang et al. [12] have demonstrated the capability of a dark-field HSI method for quantification and mapping of multiple epigenetic marks at a resolution, which allows this analysis in single cells (Fig. 7). The dark-field HSI was used for breaking the spatial diffraction limit and improved the low signal-to-noise ratio associated with quantification of cytosine modifications using fluorescence microscopy. Fluorescence microscopy is one of the most widely used optical methods for in situ visualization of biological molecules at the cellular and molecular levels. Compared with fluorescence microscopy, the dark-field HSI approach suffers minimally from errors associated with autofluorescence, photo-bleaching, and photo-toxicity [12].
Fig. 7.
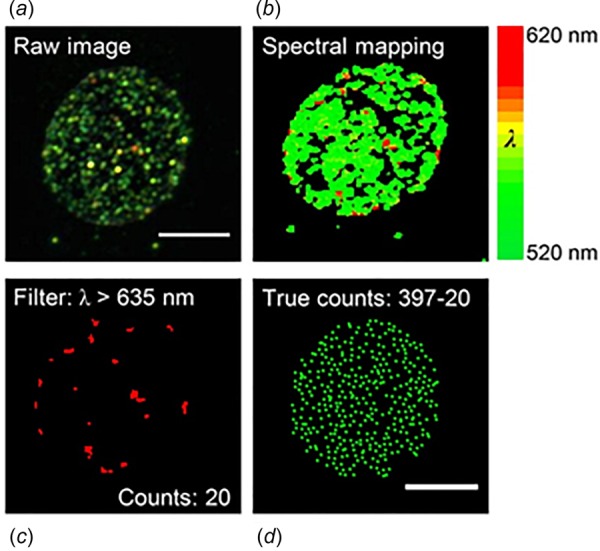
Hyperspectral dark-field imaging using plasmonic nanoprobes to quantify 5-carboxylcytosine (5caC) modification on DNA in single cells [12]. The study by Wang et al. [12] revealed the distribution of 5caC at different cell-cycle stages and demonstrated that 5caC is an inherited epigenetic marker. As stated by the authors, the hyperspectral dark-field imaging efficiently removes scattering noises from nonspecifically aggregated nanoprobes. The image shows the filter function applied to: (a) Raw image (b) converted to spectrally mapped images from 520–620 nm, (c) image of cell at a wavelength above 635 nm, and (d) number of gold nanoparticle (shown as green dots) inside the cell. The caption text refers to online color version of the figure.
Hyperspectral imaging has also been utilized to study the dynamics inside a single cell. Chaudhari and Pradeep [90] demonstrated the use of polarized HSI to track rotational dynamics of gold nanorods inside live HEK293 cells. This study [90] provided a method to assess and for improved understanding of the state of an anisotropic nanostructure in complex environments (see Fig. 8). These observations in three dimensions of intracellular rotational dynamics of gold nanorods represented a new landmark in single particle scattering spectroscopy [90]. Subsequently, Oh et al. [18] visualized and quantified the distribution of cellular iron using an intrinsic hyperspectral fluorescence signal to analyze the physiological role of iron in nigra and its relationship to the progression of Parkinson's disease (see Fig. 9). The availability of commercial software for analyzing hyperspectral images has significantly enhanced the ease and access of HSI systems and exponentially increased the number and variety of biological problems that can be addressed. For example, Verebes et al. [19] obtained unique spectral signatures of red blood cells (RBCs) while Mortimer et al. [91] examined the uptake of different metal-based nanoparticles/quantum dots at concentrations in the ciliated protozoan Tetrahymena thermophila.
Fig. 8.
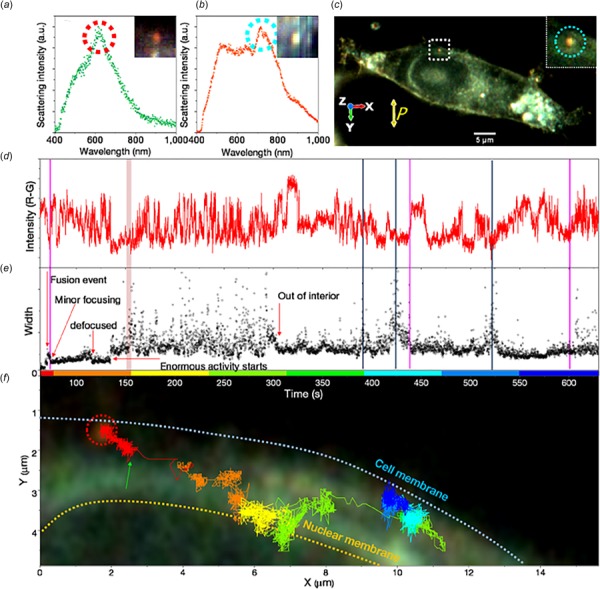
Study of 3D rotational dynamics of gold nanorods inside live HEK293 cells using CytoViva HSI system by Chaudhari and Pradeep [90]. (a) Scattering spectra of a single gold nanorod attached on the cell membrane. The inset shows the corresponding hyperspectral image. (b) Scattering spectra of the gold nanorod in (a) after being absorbed by the cell. The inset shows the corresponding hyperspectral image. (c) Actual image of cell being monitored to study rotational dynamics. The gold nanorod is marked with a square. Inset shows an enlarged view of the gold nanorod. Light scattered in the Z direction was collected through analyzer, whose orientation is shown by yellow double arrow. (d) Time variation of scattering intensity of the gold nanorod. Time scale corresponds to the axis of the graph shown below. Pink vertical bars show the region where microscope focus was adjusted on the particle after it went out of the focal plane. (e) Time variation of width of gold nanorod spot in two-dimensional Gaussian width of the gold nanorod. See Chaudhari and Pradeep [90] for further details. (f) Representation of gold nano particle path inside the HEK293 cell. Green arrow shows the time point from where temporal data of the GNR is shown. Color of the trace corresponds to the time scale of graphs (D, E). Please note that the background image is just to give a rough idea of the position of GNR inside the cell.
Fig. 9.
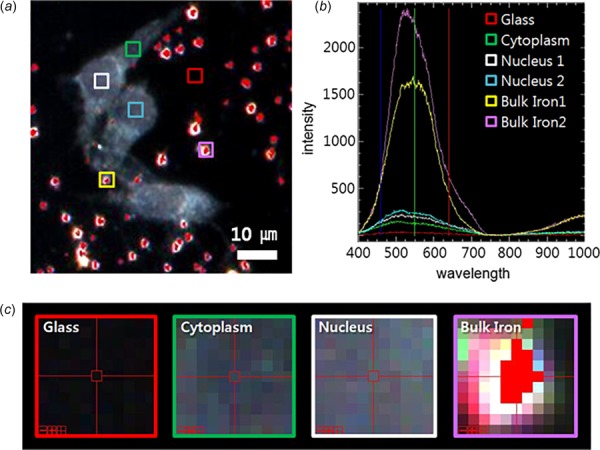
Hyperspectral fluorescence imaging of SHSY5Y cells containing iron from Oh et al. [18]. (a) Dark-field images of the SHSY5Ycells incubated with iron (specifically ferric ammonium nitrate) for 1 h. The areas mapped with HSI are marked by colored boxes. (b) Spectral profiles collected from each region shown in (a). Peaks are mainly observed between 450 to 650 nm. All bulk iron areas have a peak absorbance near 600 nm, whereas the peak signal in the cells is near 500 nm and the signal on the glass plate is almost zero. (c) Magnified or zoomed-in images (17×) of pixels containing HSI data from glass, cytoplasm, nucleus, and bulk iron.
In addition to the fast cellular dynamics study mentioned above, HSI was also utilized to investigate drug delivery over a longer time scale. Misra et al. [92] performed HSI imaging to quantify and detect sub 30 nm phospholipid stabilized nanoparticles without the use of a fluorophore. As shown in Fig. 10, the spatial and temporal resolution permitted by HSI allowed Misra et al. [92] to detect and quantify the delivery of drugs from these nanoparticle carriers inside a three-dimensional MCF-7 breast cancer cells (Fig. 10). Conti et al. [13] developed a protocol for imaging of healthy RBCs using a dark-field HSI technique and developed a specific spectral library to analyze the composition of RBCs (Fig. 11). As described by Conti et al. [13], the spectra correctly characterized the erythrocyte components such as the membrane and sub-membrane regions. Such precision in mapping cellular components is promising for the future use of HSI for the analysis of single molecules, small or large proteins, and the membrane phospholipid assembly [13]. HSI has also been reported for the identification of stem cell subpopulations [93], diabetic tissue diagnostics [94], and evaluating the condition of preimplantation embryos [95]. Briefly, Gosnell et al. [93] detected genetic mutations in cancer (or CD90 expression) using novel image processing techniques along with a multispectral wide-field fluorescence microscope while Khaodhiar et al. [94] demonstrated that HSI has the capability to identify microvascular abnormalities and oxygenation patterns in diabetic foot.
Fig. 10.
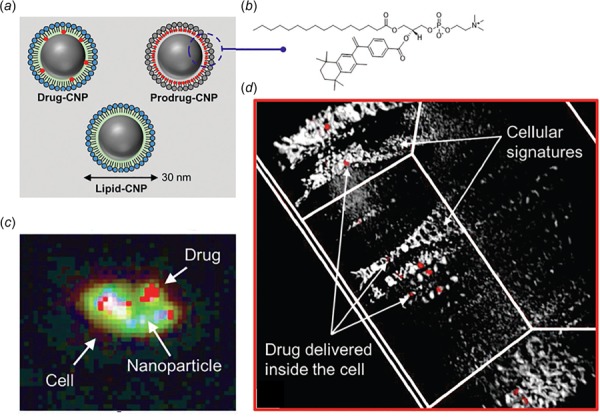
Application of HSI modality for mapping nanoparticle drug delivery from Misra et al. [92]. (a) Three different conditions of carbon nanoparticle (CNP) encapsulated with drugs: drug encapsulated CNP denoted as drug-CNP, doxorubicin encapsulated CNP denoted as prodrug-CNP in the figure and SN2-lipase labile bexarotene prodrug passivated CNP denoted as lipid-CNP in the figure. Lipid-CNP represents a control nanoparticle without inclusion of any drug. (b) Molecular representation of prodrug-CNP. (c) Mapped spectral image containing information about distinct materials exhibiting differently colored pixels for drug delivery in MCF-7 breast cancer cells. (d) 3D representation of HSI on MCF-7 cells treated with drug-CNP for 4 h at 37 °C, 99% humidity and 5% CO2 environment. Localization of drug-CNP (red, white arrow) in 3D intracellular space showing cellular building blocks as described by Misra et al. [92].
Fig. 11.
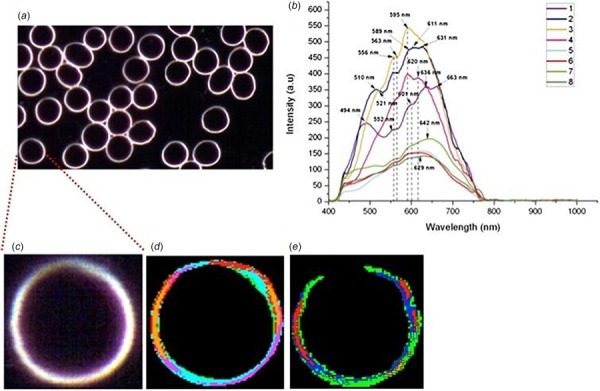
Label-free dark-field HSI of human RBCs from Conti et al. [13]: (a) Hyperspectral image of erythrocyte sample. (b) Spectral library composed of different endmembers with random color code. (c) Zoomed-in image of one erythrocyte. (d) Color mapping matching spectra of the spectral library. (e) Mapping five main components of RBCs namely phospholipid, cholesterol, hemoglobin, spectrin, and protoporphyrin. Briefly, 5 μl of whole blood was loaded in the center of glass slide and sandwiched with coverslip. After 120 min, to allow for image stability, the optical acquisition was started. Each image consisted of approximately 30 regularly shaped RBC as shown in (a) with no other cells. One RBC was chosen as shown in (c), (d), and (e) for further image analysis. For the RBCs, eight spectra (b) were individuated with optimal coverage of the optical image (d). Applying the SAM function, the spectral distribution of the 8 endmember spectra in the samples was then determined (data not shown) as described in Conti et al. [13]. This study demonstrated a fast, easy, and repeatable protocol to study large number of cells and to the possibility of mapping single molecules, proteins as well as structure of cell membranes with applications in personalized medicine and membrane-targeted therapies [13]. The caption text refers to online color version of the figure.
Authors of this paper are also currently employing cost-effective and noninvasive imaging technology to study the differentiation of human adult stem cells (ASCs) for regenerative medicinal purposes. We have previously shown that ASCs isolated from human adipose tissue can differentiate into osteoblasts, chondrocytes, and adipocytes [96,97]. Briefly, we are currently developing and refining a dark-field hyperspectral microscopy technique for noninvasive monitoring of ASCs undergoing adipogenesis (at days 3, 6 and 9 of the culture process) and osteogenesis (at days 7, 14 and 21 of the culture process). Our experimental setup consists of a hyperspectral microscope from CytoViva equipped with high intensity halogen light source and a patented nanoscale illumination condenser. The system provides hyperspectral imaging in the visible near-infrared range (400–1000 nm). Spectral data are collected using spectrograph at room temperature with the intensity count being adjusted to a value between 1000 and 10,000. Each pixel has a spatial area of 25 nm2 and is exposed for 0.25 s in order to capture the entire visible near-infrared spectrum. Light is projected at oblique angles using the patented condenser in order to obtain fine scattering from all the intercellular components with a resolution of ∼ 2 nm. As expected, our preliminary results suggest that compared to control (nondifferentiated) stem cells, a higher degree of cellular heterogeneity is observed within the differentiated cell populations. In particular, we observe the heterogeneous changes within the stem cell morphology due to oil wells (deposition of fatty acids) during adipogenic differentiation as well as the formation of calcium deposits within ASCs undergoing osteogenesis. Biochemical spectra exhibited from the walls of oil well and diffused deposition of calcium is observed to be very distinct from the spectrum exhibited by control stem cells.
Although the HSI systems described above have several advantages over traditional imaging methods, there are some disadvantages and restrictions that are intrinsic to the method. Some of them are:
-
(i)
substantial computing power is required to analyze and collate large amount of spatial and spectral data.
-
(ii)
constructing the reference spectral libraries can be time-consuming especially in the initial stages of data gathering and analysis. Additionally, it is not always trivial to create reference libraries for in vitro and in vivo scenarios. For example, since the scattering spectrum of the particle is modified due to changes in its microenvironment such as changes in acidity levels, dissolution characteristics, cluster formation, and protein binding, the reference spectral library generated under controlled reference conditions might not be pertinent or relevant to dynamically changing conditions within tissues and cells [47]. Additionally, the deconvolution and/or construction of characteristic spectra for complex systems will require the development of specific and unique control systems. This inability to construct specific and unique control systems will severely limit the generation and realization of standard, universally applicable reference libraries [13,98].
-
(iii)
HSI is slower than simple dark-field imaging. However, HSI is still less cumbersome and rapid in comparison to corresponding sample preparation time and analysis by standard imaging methods like electron microscopy. Finally, HSI does generate lower resolution images than scanning probe microscopy-based techniques (such as the AFM or electron-microscopy) and electron microscopy based techniques (such as TEM). AFM and TEM are capable of resolving individual atoms, whereas the resolution of HSI is typically limited to ∼200 nm; although HSI can theoretically detect 10 nm individual particles [4].
Future Perspectives
In spite of all the progress, practical implementation of a system to control the differentiation of stem cell and maintaining the purity of the isolated cells remains a challenge [99–101]. There is a need to develop multimodal imaging modalities, which can simultaneously provide functional, morphological, and biochemical information of cells, scaffolds as well as extracellular matrix components. Light microscopy and phase contrast microscopy have the advantage of monitoring cells over a large time scale; however, the methods are currently limited by the array of specific chemical information related to cell activity and metabolism they can provide. Hyperspectral microscopy-based imaging is shown to be capable of performing single-cell level analysis. Further, hyperspectral microscopy provides intrinsic imaging contrast due to variations in refractive index and cell thickness, which affects the absorption, reflection, and scattering of light from the cells being investigated. Efforts are being made to combine hyperspectral microscopy with other modalities like Fourier-transformed infrared and Raman spectroscopy to enhance the chemical specificity from the imaging data. Other areas of interest include enhancing the resolution and penetration depth of the hyperspectral microscopy to better understand spatial variations within heterogeneous tissues.
Acknowledgment
The content is solely the responsibility of the authors and does not necessarily represent the official views of the National Institutes of Health. M.R.G. thanks Louisiana State University start-up funds for partially supporting the research. We are also thankful to an anonymous reviewer for critically and carefully reading through the paper and suggesting substantial improvements.
Funding Data
National Institute Diabetes, Digestive and Kidney Diseases of the National Institutes of Health (Award No. R21 DK 91852).
Department of Mechanical Engineering at Louisiana State University.
The Louisiana Board of Regents through the Board of Regents Support Fund (Contract Nos. LEQSF(2017-20)-RD-A-04 and LEQSF(2017-18)-ENH- TR-08).
National Science Foundation (Award No. 1660233).
U.S. Department of Energy (DOE) Bioenergy Technologies Office (BETO) and Vehicles Technologies Office (VTO) under the DOE Co-Optimization of Fuels and Engines Initiative (Project No. DE-EE0007981).
Contributor Information
Nishir Mehta, Department of Mechanical Engineering, , Louisiana State University, , Baton Rouge, LA 70803.
Shahensha Shaik, Department of Mechanical Engineering, , Louisiana State University, , Baton Rouge, LA 70803.
Ram Devireddy, Department of Mechanical Engineering, , Louisiana State University, , Baton Rouge, LA 70803 , e-mail: devireddy@me.lsu.edu.
Manas Ranjan Gartia, Department of Mechanical Engineering, , Louisiana State University, , Baton Rouge, LA 70803.
References
- [1]. Stender, A. S. , Marchuk, K. , Liu, C. , Sander, S. , Meyer, M. W. , Smith, E. A. , Neupane, B. , Wang, G. , Li, J. , and Cheng, J. , 2013, “ Single Cell Optical Imaging and Spectroscopy,” Chem. Rev., 113(4), pp. 2469–2527. 10.1021/cr300336e [DOI] [PMC free article] [PubMed] [Google Scholar]
- [2]. Hickey, W. J. , Shetty, A. R. , Massey, R. J. , Toso, D. B. , and Austin, J. , 2017, “ Three‐Dimensional Bright‐Field Scanning Transmission Electron Microscopy Elucidate Novel Nanostructure in Microbial Biofilms,” J. Microsc., 265(1), pp. 3–10. 10.1111/jmi.12455 [DOI] [PubMed] [Google Scholar]
- [3]. Zheng, W. , Taylor, N. , Leiman, P. , and Egelman, E. , 2017, “ Cryo-EM of the Bacteriophage Tail Tube at Better Than 3.5 Å Resolution,” Biophys. J., 112(3), pp. 573a–574a. 10.1016/j.bpj.2016.11.3088 [DOI] [Google Scholar]
- [4]. Galler, K. , Bräutigam, K. , Große, C. , Popp, J. , and Neugebauer, U. , 2014, “ Making a Big Thing of a Small Cell–Recent Advances in Single Cell Analysis,” Analyst, 139(6), pp. 1237–1273. 10.1039/C3AN01939J [DOI] [PubMed] [Google Scholar]
- [5]. Seidman, D. , 2007, “ Three-Dimensional Atom-Probe Tomography: Advances and Applications,” Annu. Rev. Mater. Res., 37, pp. 127–158. 10.1146/annurev.matsci.37.052506.084200 [DOI] [Google Scholar]
- [6]. Kherlopian, A. , Song, T. , Duan, Q. , Neimark, M. , Po, M. , Gohagan, J. , and Laine, A. , 2008, “ A Review of Imaging Techniques for Systems Biology,” BMC Syst. Biol., 2(1), p. 74. 10.1186/1752-0509-2-74 [DOI] [PMC free article] [PubMed] [Google Scholar]
- [7]. Amemiya, S. , Bard, A. , Fan, F. , Mirkin, M. , and Unwin, P. , 2008, “ Scanning Electrochemical Microscopy,” Annu. Rev. Anal. Chem., 1, pp. 95–131. 10.1146/annurev.anchem.1.031207.112938 [DOI] [PubMed] [Google Scholar]
- [8]. Zhu, Y. , Zhang, J. , Li, A. , Zhang, Y. , and Fan, C. , 2017, “ Synchrotron-Based X-Ray Microscopy for Sub-100 nm Resolution Cell Imaging,” Curr. Opin. Chem. Biol., 39, pp. 11–16. 10.1016/j.cbpa.2017.04.016 [DOI] [PubMed] [Google Scholar]
- [9]. Downes, A. , Mouras, R. , Bagnaninchi, P. , and Elfick, A. , 2011, “ Raman Spectroscopy and CARS Microscopy of Stem Cells and Their Derivatives,” J. Raman Spectrosc., 42(10), pp. 1864–1870. 10.1002/jrs.2975 [DOI] [PMC free article] [PubMed] [Google Scholar]
- [10]. Gerber, H.-P. , Malik, A. K. , Solar, G. P. , Sherman, D. , Liang, X. H. , Meng, G. , Hong, K. , Marsters, J. C. , and Ferrara, N. , 2002, “ VEGF Regulates Haematopoietic Stem Cell Survival by an Internal Autocrine Loop Mechanism,” Nature, 417(6892), pp. 954–958. 10.1038/nature00821 [DOI] [PubMed] [Google Scholar]
- [11]. Schultz, R. A. , Nielsen, T. , Zavaleta, J. R. , Ruch, R. , Wyatt, R. , and Garner, H. R. , 2001, “ Hyperspectral Imaging: A Novel Approach for Microscopic Analysis,” Cytometry, 43(4), pp. 239–247. [DOI] [PubMed] [Google Scholar]
- [12]. Wang, X. , Cui, Y. , and Irudayaraj, J. , 2015, “ Single-Cell Quantification of Cytosine Modifications by Hyperspectral Dark-Field Imaging,” ACS Nano, 9(12), pp. 11924–11932. 10.1021/acsnano.5b04451 [DOI] [PMC free article] [PubMed] [Google Scholar]
- [13]. Conti, M. , Scanferlato, R. , Louka, M. , Sansone, A. , Marzetti, C. , and Ferreri, C. , 2016, “ Building Up Spectral Libraries for Mapping Erythrocytes by Hyperspectral Dark Field Microscopy,” Biomed. Spectrosc. Imaging, 5(2), pp. 175–184. 10.3233/BSI-160133 [DOI] [Google Scholar]
- [14]. More, S. S. , and Vince, R. , 2015, “ Hyperspectral Imaging Signatures Detect Amyloidopathy in Alzheimer's Mouse Retina Well Before Onset of Cognitive Decline,” ACS Chem. Neurosci., 6(2), pp. 306–315. 10.1021/cn500242z [DOI] [PubMed] [Google Scholar]
- [15]. Lu, G. , and Fei, B. , 2014, “ Medical Hyperspectral Imaging: A Review,” J. Biomed. Opt., 19(1), p. 010901. 10.1117/1.JBO.19.1.010901 [DOI] [PMC free article] [PubMed] [Google Scholar]
- [16]. Vo-Dinh, T. , 2004, “ A Hyperspectral Imaging System for In Vivo Optical Diagnostics,” IEEE Eng. Med. Biol. Mag., 23(5), pp. 40–49. 10.1109/MEMB.2004.1360407 [DOI] [PubMed] [Google Scholar]
- [17]. Li, Q. , He, X. , Wang, Y. , Liu, H. , Xu, D. , and Guo, F. , 2013, “ Review of Spectral Imaging Technology in Biomedical Engineering: Achievements and Challenges,” J. Biomed. Opt., 18(10), p. 100901. 10.1117/1.JBO.18.10.100901 [DOI] [PubMed] [Google Scholar]
- [18]. Oh, E. S. , Heo, C. , Kim, J. S. , Suh, M. , Lee, Y. H. , and Kim, J.-M. , 2013, “ Hyperspectral Fluorescence Imaging for Cellular Iron Mapping in the In Vitro Model of Parkinson's Disease,” J. Biomed. Opt., 19(5), p. 051207. 10.1117/1.JBO.19.5.051207 [DOI] [PubMed] [Google Scholar]
- [19]. Verebes, G. S. , Melchiorre, M. , Garcia‐Leis, A. , Ferreri, C. , Marzetti, C. , and Torreggiani, A. , 2013, “ Hyperspectral Enhanced Dark Field Microscopy for Imaging Blood Cells,” J. Biophotonics, 6(11–12), pp. 960–967. 10.1002/jbio.201300067 [DOI] [PubMed] [Google Scholar]
- [20]. Vermaas, W. F. , Timlin, J. A. , Jones, H. D. , Sinclair, M. B. , Nieman, L. T. , Hamad, S. W. , Melgaard, D. K. , and Haaland, D. M. , 2008, “ In Vivo Hyperspectral Confocal Fluorescence Imaging to Determine Pigment Localization and Distribution in Cyanobacterial Cells,” Proc. Natl. Acad. Sci., 105(10), pp. 4050–4055. 10.1073/pnas.0708090105 [DOI] [PMC free article] [PubMed] [Google Scholar]
- [21]. Boldrini, B. , Kessler, W. , Rebner, K. , and Kessler, R. W. , 2012, “ Hyperspectral Imaging: A Review of Best Practice, Performance and Pitfalls for In-Line and On-Line Applications,” J. Near Infrared Spectrosc., 20(5), pp. 483–508. 10.1255/jnirs.1003 [DOI] [Google Scholar]
- [22]. Schnarr, K. , Mooney, R. , Weng, Y. , Zhao, D. , Garcia, E. , Armstrong, B. , Annala, A. J. , Kim, S. U. , Aboody, K. S. , and Berlin, J. M. , 2013, “ Gold Nanoparticle‐Loaded Neural Stem Cells for Photothermal Ablation of Cancer,” Adv. Healthcare Mater., 2(7), pp. 976–982. 10.1002/adhm.201300003 [DOI] [PubMed] [Google Scholar]
- [23]. Gupta, N. , 2011, “ Development of Staring Hyperspectral Imagers,” IEEE Applied Imagery Pattern Recognition Workshop (AIPR), Washington, DC, Oct. 11–13, pp. 1–8. 10.1109/AIPR.2011.6176379 [DOI] [Google Scholar]
- [24]. Weitzel, L. , Krabbe, A. , Kroker, H. , Thatte, N. , Tacconi-Garman, L. , Cameron, M. , and Genzel, R. , 1996, “ 3D: The Next Generation Near-Infrared Imaging Spectrometer,” Astron. Astrophys. Suppl. Ser., 119(3), pp. 531–546. 10.1051/aas:1996266 [DOI] [Google Scholar]
- [25]. Owen, D. M. , Manning, H. B. , de Beule, P. , Talbot, C. , Requejo-Isidro, J. , Dunsby, C. , McGinty, J. , Benninger, R. K. , Elson, D. S. , and Munro, I. , 2007, “ Development of a Hyperspectral Fluorescence Lifetime Imaging Microscope and Its Application to Tissue Imaging,” Proc. SPIE, 6441, p. 64411K. 10.1117/12.700081 [DOI] [PubMed] [Google Scholar]
- [26]. Yudovsky, D. , Nouvong, A. , Schomacker, K. , and Pilon, L. , 2011, “ Assessing Diabetic Foot Ulcer Development Risk With Hyperspectral Tissue Oximetry,” J. Biomed. Opt., 16(2), p. 026009. 10.1117/1.3535592 [DOI] [PMC free article] [PubMed] [Google Scholar]
- [27]. Greenman, R. L. , Panasyuk, S. , Wang, X. , Lyons, T. E. , Dinh, T. , Longoria, L. , Giurini, J. M. , Freeman, J. , Khaodhiar, L. , and Veves, A. , 2005, “ Early Changes in the Skin Microcirculation and Muscle Metabolism of the Diabetic Foot,” Lancet, 366(9498), pp. 1711–1717. 10.1016/S0140-6736(05)67696-9 [DOI] [PubMed] [Google Scholar]
- [28]. Shah, S. , Bachrach, N. , Spear, S. , Letbetter, D. , Stone, R. , Dhir, R. , Prichard, J. , Brown, H. , and LaFramboise, W. , 2003, “ Cutaneous Wound Analysis Using Hyperspectral Imaging,” Biotechniques, 34(2), pp. 408–413.https://www.biotechniques.com/multimedia/archive/00010/03342pf01_10632a.pdf [DOI] [PubMed] [Google Scholar]
- [29]. Afromowitz, M. A. , Callis, J. B. , Heimbach, D. M. , DeSoto, L. A. , and Norton, M. K. , 1988, “ Multispectral Imaging of Burn Wounds: A New Clinical Instrument for Evaluating Burn Depth,” IEEE Trans. Biomed. Eng., 35(10), pp. 842–850. 10.1109/10.7291 [DOI] [PubMed] [Google Scholar]
- [30]. Renkoski, T. E. , Hatch, K. D. , and Utzinger, U. , 2012, “ Wide-Field Spectral Imaging of Human Ovary Autofluorescence and Oncologic Diagnosis Via Previously Collected Probe Data,” J. Biomed. Opt., 17(3), p. 036003. 10.1117/1.JBO.17.3.036003 [DOI] [PMC free article] [PubMed] [Google Scholar]
- [31]. Akbari, H. , Halig, L. V. , Schuster, D. M. , Osunkoya, A. , Master, V. , Nieh, P. T. , Chen, G. Z. , and Fei, B. , 2012, “ Hyperspectral Imaging and Quantitative Analysis for Prostate Cancer Detection,” J. Biomed. Opt., 17(7), p. 0760051. 10.1117/1.JBO.17.7.076005 [DOI] [PMC free article] [PubMed] [Google Scholar]
- [32]. Akbari, H. , Uto, K. , Kosugi, Y. , Kojima, K. , and Tanaka, N. , 2011, “ Cancer Detection Using Infrared Hyperspectral Imaging,” Cancer Sci., 102(4), pp. 852–857. 10.1111/j.1349-7006.2011.01849.x [DOI] [PMC free article] [PubMed] [Google Scholar]
- [33]. Panasyuk, S. V. , Yang, S. , Faller, D. V. , Ngo, D. , Lew, R. A. , Freeman, J. E. , and Rogers, A. E. , 2007, “ Medical Hyperspectral Imaging to Facilitate Residual Tumor Identification During Surgery,” Cancer Biol. Ther., 6(3), pp. 439–446. 10.4161/cbt.6.3.4018 [DOI] [PubMed] [Google Scholar]
- [34]. Kong, S. G. , Martin, M. , and Vo-Dinh, T. , 2006, “ Hyperspectral Fluorescence Imaging for Mouse Skin Tumor Detection,” Etri J., 28(6), pp. 770–776. 10.4218/etrij.06.0106.0061 [DOI] [Google Scholar]
- [35]. Benavides, J. M. , Chang, S. , Park, S. Y. , Richards-Kortum, R. , Mackinnon, N. , MacAulay, C. , Milbourne, A. , Malpica, A. , and Follen, M. , 2003, “ Multispectral Digital Colposcopy for In Vivo Detection of Cervical Cancer,” Opt. Express, 11(10), pp. 1223–1236. 10.1364/OE.11.001223 [DOI] [PubMed] [Google Scholar]
- [36]. Randeberg, L. L. , Baarstad, I. , Løke, T. , Kaspersen, P. , and Svaasand, L. O. , 2006, “ Hyperspectral Imaging of Bruised Skin,” Proc. SPIE, 6078, p. 607800. 10.1117/12.646557 [DOI] [Google Scholar]
- [37]. Randeberg, L. L. , and Hernandez-Palacios, J. , 2012, “ Hyperspectral Imaging of Bruises in the SWIR Spectral Region,” Proc. SPIE, 8207, p. 82070N. 10.1117/12.909137 [DOI] [Google Scholar]
- [38]. Dicker, D. T. , Lerner, J. , Van Belle, P. , Guerry, T. , DuPont, Herlyn, M. , Elder, D. E. , and El-Deiry, W. S. , 2006, “ Differentiation of Normal Skin and Melanoma Using High Resolution Hyperspectral Imaging,” Cancer Biol. Ther., 5(8), pp. 1033–1038. 10.4161/cbt.5.8.3261 [DOI] [PubMed] [Google Scholar]
- [39]. Li, Q. , Wang, Y. , Liu, H. , and Chen, Z. , 2012, “ Nerve Fibers Identification Based on Molecular Hyperspectral Imaging Technology,” IEEE International Conference on Computer Science and Automation Engineering (CSAE) Zhangjiajie, China, May 25–27, pp. 15–17. 10.1109/CSAE.2012.6272897 [DOI]
- [40]. Usenik, P. , Bürmen, M. , Fidler, A. , Pernuš, F. , and Likar, B. , 2012, “ Evaluation of Cross-Polarized Near Infrared Hyperspectral Imaging for Early Detection of Dental Caries,” Proc. SPIE, 8208, p. 82080G. 10.1117/12.908763 [DOI] [Google Scholar]
- [41]. Martin, R. , Thies, B. , and Gerstner, A. O. , 2012, “ Hyperspectral Hybrid Method Classification for Detecting Altered Mucosa of the Human Larynx,” Int. J. Health Geographics, 11(1), p. 21. 10.1186/1476-072X-11-21 [DOI] [PMC free article] [PubMed] [Google Scholar]
- [42]. Larsen, E. L. , Randeberg, L. L. , Olstad, E. , Haugen, O. A. , Aksnes, A. , and Svaasand, L. O. , 2011, “ Hyperspectral Imaging of Atherosclerotic Plaques In Vitro,” J. Biomed. Opt., 16(2), p. 026011. 10.1117/1.3540657 [DOI] [PubMed] [Google Scholar]
- [43]. Akbari, H. , Kosugi, Y. , Kojima, K. , and Tanaka, N. , 2010, “ Detection and Analysis of the Intestinal Ischemia Using Visible and Invisible Hyperspectral Imaging,” IEEE Trans. Biomed. Eng., 57(8), pp. 2011–2017. 10.1109/TBME.2010.2049110 [DOI] [PubMed] [Google Scholar]
- [44]. Johnson, W. R. , Wilson, D. W. , Fink, W. , Humayun, M. , and Bearman, G. , 2007, “ Snapshot Hyperspectral Imaging in Ophthalmology,” J. Biomed. Opt., 12(1), p. 014036. 10.1117/1.2434950 [DOI] [PubMed] [Google Scholar]
- [45]. Sorg, B. S. , Moeller, B. J. , Donovan, O. , Cao, Y. , and Dewhirst, M. W. , 2005, “ Hyperspectral Imaging of Hemoglobin Saturation in Tumor Microvasculature and Tumor Hypoxia Development,” J. Biomed. Opt., 10(4), p. 044004. 10.1117/1.2003369 [DOI] [PubMed] [Google Scholar]
- [46]. Ferris, D. G. , Lawhead, R. A. , Dickman, E. D. , Holtzapple, N. , Miller, J. A. , Grogan, S. , Bambot, S. , Agrawal, A. , and Faupel, M. L. , 2001, “ Multimodal Hyperspectral Imaging for the Noninvasive Diagnosis of Cervical Neoplasia,” J. Lower Genital Tract Dis., 5(2), pp. 65–72. 10.1046/j.1526-0976.2001.005002065.x [DOI] [PubMed] [Google Scholar]
- [47]. Roth, G. A. , Tahiliani, S. , Neu‐Baker, N. M. , and Brenner, S. A. , 2015, “ Hyperspectral Microscopy as an Analytical Tool for Nanomaterials,” Wiley Interdiscip. Rev.: Nanomed. Nanobiotechnol., 7(4), pp. 565–579. 10.1002/wnan.1330 [DOI] [PubMed] [Google Scholar]
- [48]. Seng, P. , Drancourt, M. , Gouriet, F. , La Scola, B. , Fournier, P.-E. , Rolain, J. M. , and Raoult, D. , 2009, “ Ongoing Revolution in Bacteriology: Routine Identification of Bacteria by Matrix-Assisted Laser Desorption Ionization Time-of-Flight Mass Spectrometry,” Clin. Infect. Dis., 49(4), pp. 543–551. 10.1086/600885 [DOI] [PubMed] [Google Scholar]
- [49]. Vater, J. , Kablitz, B. , Wilde, C. , Franke, P. , Mehta, N. , and Cameotra, S. S. , 2002, “ Matrix-Assisted Laser Desorption Ionization-Time of Flight Mass Spectrometry of Lipopeptide Biosurfactants in Whole Cells and Culture Filtrates of Bacillus Subtilis C-1 Isolated From Petroleum Sludge,” Appl. Environ. Microbiol., 68(12), pp. 6210–6219. 10.1128/AEM.68.12.6210-6219.2002 [DOI] [PMC free article] [PubMed] [Google Scholar]
- [50]. Welker, M. , and Moore, E. R. , 2011, “ Applications of Whole-Cell Matrix-Assisted Laser-Desorption/Ionization Time-of-Flight Mass Spectrometry in Systematic Microbiology,” Syst. Appl. Microbiol., 34(1), pp. 2–11. 10.1016/j.syapm.2010.11.013 [DOI] [PubMed] [Google Scholar]
- [51]. Murakoshi, M. , Iida, K. , Kumano, S. , and Wada, H. , 2009, “ Immune Atomic Force Microscopy of Prestin-Transfected CHO Cells Using Quantum Dots,” Pflügers Archiv—Eur. J. Physiol., 457(4), p. 885. 10.1007/s00424-008-0560-z [DOI] [PubMed] [Google Scholar]
- [52]. Gartia, M. R. , Hsiao, A. , Sivaguru, M. , Chen, Y. , and Liu, G. L. , “ Enhanced 3D Fluorescence Live Cell Imaging on Nanoplasmonic Substrate,” Nanotechnology, 22(36), p. 365203. 10.1088/0957-4484/22/36/365203 [DOI] [PubMed] [Google Scholar]
- [53]. Chen, J. , and Irudayaraj, J. , 2010, “ Fluorescence Lifetime Cross Correlation Spectroscopy Resolves EGFR and Antagonist Interaction in Live Cells,” Anal. Chem., 82(15), pp. 6415–6421. 10.1021/ac101236t [DOI] [PubMed] [Google Scholar]
- [54]. Schober, Y. , Guenther, S. , Spengler, B. , and Römpp, A. , 2012, “ Single Cell Matrix-Assisted Laser Desorption/Ionization Mass Spectrometry Imaging,” Anal. Chem., 84(15), pp. 6293–6297. 10.1021/ac301337h [DOI] [PubMed] [Google Scholar]
- [55]. Kim, A. , and Wilson, B. C. , 2010, “ Measurement of Ex Vivo and In Vivo Tissue Optical Properties: Methods and Theories,” Optical-Thermal Response of Laser-Irradiated Tissue, Springer, Dordrecht, The Netherlands, pp. 267–319. [Google Scholar]
- [56]. Sandell, J. L. , and Zhu, T. C. , 2011, “ A Review of In‐Vivo Optical Properties of Human Tissues and Its Impact on PDT,” J. Biophotonics, 4(11–12), pp. 773–787. 10.1002/jbio.201100062 [DOI] [PMC free article] [PubMed] [Google Scholar]
- [57]. Bashkatov, A. N. , Genina, E. A. , and Tuchin, V. V. , 2011, “ Optical Properties of Skin, Subcutaneous, and Muscle Tissues: A Review,” J. Innovative Opt. Health Sci., 4(1), pp. 9–38. 10.1142/S1793545811001319 [DOI] [Google Scholar]
- [58]. Jacques, S. L. , 2013, “ Optical Properties of Biological Tissues: A Review,” Phys. Med. Biol., 58(11), p. R37. 10.1088/0031-9155/58/11/R37 [DOI] [PubMed] [Google Scholar]
- [59]. Luu, Y. K. , Capilla, E. , Rosen, C. J. , Gilsanz, V. , Pessin, J. E. , Judex, S. , and Rubin, C. T. , 2009, “ Mechanical Stimulation of Mesenchymal Stem Cell Proliferation and Differentiation Promotes Osteogenesis While Preventing Dietary‐Induced Obesity,” J. Bone Miner. Res., 24(1), pp. 50–61. 10.1359/jbmr.080817 [DOI] [PMC free article] [PubMed] [Google Scholar]
- [60]. Palonpon, A. F. , Ando, J. , Yamakoshi, H. , Dodo, K. , Sodeoka, M. , Kawata, S. , and Fujita, K. , 2013, “ Raman and SERS Microscopy for Molecular Imaging of Live Cells,” Nat. Protoc., 8(4), pp. 677–692. 10.1038/nprot.2013.030 [DOI] [PubMed] [Google Scholar]
- [61]. Smus, J. P. , Moura, C. C. , McMorrow, E. , Tare, R. S. , Oreffo, R. O. , and Mahajan, S. , 2015, “ Tracking Adipogenic Differentiation of Skeletal Stem Cells by Label-Free Chemically Selective Imaging,” Chem. Sci., 6(12), pp. 7089–7096. 10.1039/C5SC02168E [DOI] [PMC free article] [PubMed] [Google Scholar]
- [62]. Peterson, S. M. , and Freeman, J. L. , 2009, “ RNA Isolation From Embryonic Zebrafish and cDNA Synthesis for Gene Expression Analysis,” J. Visualized Exp., 30, p. 1470.https://www.ncbi.nlm.nih.gov/pmc/articles/PMC3152201/ [DOI] [PMC free article] [PubMed] [Google Scholar]
- [63]. Iandolino, A. , Goes da Silva, F. , Lim, H. , Choi, H. , Williams, L. , and Cook, D. , 2004, “ High-Quality RNA, cDNA, and Derived Est Libraries From Grapevine (Vitis Vinifera L.),” Plant Mol. Biol. Reporter, 22(3), pp. 269–278. 10.1007/BF02773137 [DOI] [Google Scholar]
- [64]. Haaland, D. M. , and Thomas, E. V. , 1988, “ Partial Least-Squares Methods for Spectral Analyses. 1. Relation to Other Quantitative Calibration Methods and the Extraction of Qualitative Information,” Anal. Chem., 60(11), pp. 1193–1202. 10.1021/ac00162a020 [DOI] [Google Scholar]
- [65]. Ruckebusch, C. , and Blanchet, L. , 2013, “ Multivariate Curve Resolution: A Review of Advanced and Tailored Applications and Challenges,” Anal. Chim. Acta, 765, pp. 28–36. 10.1016/j.aca.2012.12.028 [DOI] [PubMed] [Google Scholar]
- [66]. Wang, W. , Foley, K. , Shan, X. , Wang, S. , Eaton, S. , Nagaraj, V. J. , Wiktor, P. , Patel, U. , and Tao, N. , 2011, “ Single Cells and Intracellular Processes Studied by a Plasmonic-Based Electrochemical Impedance Microscopy,” Nat. Chem., 3(3), pp. 249–255. 10.1038/nchem.961 [DOI] [PMC free article] [PubMed] [Google Scholar]
- [67]. Wood, R. W. , 1902, “ On a Remarkable Case of Uneven Distribution of Light in a Diffraction Grating Spectrum,” Proc. Phys. Soc. London, 18(1), p. 269. 10.1088/1478-7814/18/1/325 [DOI] [Google Scholar]
- [68]. Otto, A. , 1968, “ Excitation of Nonradiative Surface Plasma Waves in Silver by the Method of Frustrated Total Reflection,” Z. Phys., 216(4), pp. 398–410. 10.1007/BF01391532 [DOI] [Google Scholar]
- [69]. Kretschmann, E. , and Raether, H. , 1968, “ Notizen: Radiative Decay of Non Radiative Surface Plasmons Excited by Light,” Z. Naturforsch. A, 23(12), pp. 2135–2136. 10.1515/zna-1968-1247 [DOI] [Google Scholar]
- [70]. Chu, X. , and Chu, S.-I. , 2001, “ Time-Dependent Density-Functional Theory for Molecular Processes in Strong Fields: Study of Multiphoton Processes and Dynamical Response of Individual Valence Electrons of N 2 in Intense Laser Fields,” Phys. Rev. A, 64(6), p. 063404. 10.1103/PhysRevA.64.063404 [DOI] [Google Scholar]
- [71]. Wang, W. , Wang, S. , Liu, Q. , Wu, J. , and Tao, N. , 2012, “ Mapping Single-Cell–Substrate Interactions by Surface Plasmon Resonance Microscopy,” Langmuir, 28(37), pp. 13373–13379. 10.1021/la301712h [DOI] [PMC free article] [PubMed] [Google Scholar]
- [72]. Berguiga, L. , Streppa, L. , Boyer-Provera, E. , Martinez-Torres, C. , Schaeffer, L. , Elezgaray, J. , Arneodo, A. , and Argoul, F. , 2016, “ Time-Lapse Scanning Surface Plasmon Microscopy of Living Adherent Cells With a Radially Polarized Beam,” Appl. Opt., 55(6), pp. 1216–1227. 10.1364/AO.55.001216 [DOI] [PubMed] [Google Scholar]
- [73]. Homola, J. , 2008, “ Surface Plasmon Resonance Sensors for Detection of Chemical and Biological Species,” Chem. Rev., 108(2), pp. 462–493. 10.1021/cr068107d [DOI] [PubMed] [Google Scholar]
- [74]. Chattopadhyay, P. K. , Gierahn, T. M. , Roederer, M. , and Love, J. C. , 2014, “ Single-Cell Technologies for Monitoring Immune Systems,” Nat. Immunol., 15(2), pp. 128–135. 10.1038/ni.2796 [DOI] [PMC free article] [PubMed] [Google Scholar]
- [75]. Laplatine, L. , Leroy, L. , Calemczuk, R. , Baganizi, D. , Marche, P. N. , Roupioz, Y. , and Livache, T. , 2014, “ Spatial Resolution in Prism-Based Surface Plasmon Resonance Microscopy,” Opt. Express, 22(19), pp. 22771–22785. 10.1364/OE.22.022771 [DOI] [PubMed] [Google Scholar]
- [76]. Siddiqi, A. M. , Li, H. , Faruque, F. , Williams, W. , Lai, K. , Hughson, M. , Bigler, S. , Beach, J. , and Johnson, W. , 2008, “ Use of Hyperspectral Imaging to Distinguish Normal, Precancerous, and Cancerous Cells,” Cancer Cytopathol., 114(1), pp. 13–21. 10.1002/cncr.23286 [DOI] [PubMed] [Google Scholar]
- [77]. Aaron, J. , Travis, K. , Harrison, N. , and Sokolov, K. , 2009, “ Dynamic Imaging of Molecular Assemblies in Live Cells Based on Nanoparticle Plasmon Resonance Coupling,” Nano Lett., 9(10), pp. 3612–3618. 10.1021/nl9018275 [DOI] [PMC free article] [PubMed] [Google Scholar]
- [78]. Weinkauf, H. , and Brehm‐Stecher, B. F. , 2009, “ Enhanced Dark Field Microscopy for Rapid Artifact‐Free Detection of Nanoparticle Binding to Candida Albicans Cells and Hyphae,” Biotechnol. J., 4(6), pp. 871–879. 10.1002/biot.200800358 [DOI] [PubMed] [Google Scholar]
- [79]. Patskovsky, S. , Bergeron, E. , Rioux, D. , and Meunier, M. , 2015, “ Wide‐Field Hyperspectral 3D Imaging of Functionalized Gold Nanoparticles Targeting Cancer Cells by Reflected Light Microscopy,” J. Biophotonics, 8(5), pp. 401–407. 10.1002/jbio.201400025 [DOI] [PubMed] [Google Scholar]
- [80]. Ma, L. L. , Feldman, M. D. , Tam, J. M. , Paranjape, A. S. , Cheruku, K. K. , Larson, T. A. , Tam, J. O. , Ingram, D. R. , Paramita, V. , and Villard, J. W. , 2009, “ Small Multifunctional Nanoclusters (Nanoroses) for Targeted Cellular Imaging and Therapy,” ACS Nano, 3(9), pp. 2686–2696. 10.1021/nn900440e [DOI] [PMC free article] [PubMed] [Google Scholar]
- [81]. Goh, D. , Gong, T. , Dinish, U. , Maiti, K. K. , Fu, C. Y. , Yong, K.-T. , and Olivo, M. , 2012, “ Pluronic Triblock Copolymer Encapsulated Gold Nanorods as Biocompatible Localized Plasmon Resonance-Enhanced Scattering Probes for Dark-Field Imaging of Cancer Cells,” Plasmonics, 7(4), pp. 595–601. 10.1007/s11468-012-9347-3 [DOI] [Google Scholar]
- [82]. Gong, T. , Olivo, M. , Dinish, U. , Goh, D. , Kong, K. V. , and Yong, K.-T. , 2013, “ Engineering Bioconjugated Gold Nanospheres and Gold Nanorods as Label-Free Plasmon Scattering Probes for Ultrasensitive Multiplex Dark-Field Imaging of Cancer Cells,” J. Biomed. Nanotechnol., 9(6), pp. 985–991. 10.1166/jbn.2013.1603 [DOI] [PubMed] [Google Scholar]
- [83]. Mahlein, A.-K. , Steiner, U. , Hillnhütter, C. , Dehne, H.-W. , and Oerke, E.-C. , 2012, “ Hyperspectral Imaging for Small-Scale Analysis of Symptoms Caused by Different Sugar Beet Diseases,” Plant Methods, 8(1), p. 3. 10.1186/1746-4811-8-3 [DOI] [PMC free article] [PubMed] [Google Scholar]
- [84]. Sotiriou, G. A. , Starsich, F. , Dasargyri, A. , Wurnig, M. C. , Krumeich, F. , Boss, A. , Leroux, J. C. , and Pratsinis, S. E. , 2014, “ Photothermal Killing of Cancer Cells by the Controlled Plasmonic Coupling of Silica‐Coated Au/Fe2O3 Nanoaggregates,” Adv. Funct. Mater., 24(19), pp. 2818–2827. 10.1002/adfm.201303416 [DOI] [Google Scholar]
- [85]. Mortimer, M. , Gogos, A. , Bartolomé, N. , Kahru, A. , Bucheli, T. D. , and Slaveykova, V. I. , 2014, “ Potential of Hyperspectral Imaging Microscopy for Semi-Quantitative Analysis of Nanoparticle Uptake by Protozoa,” Environ. Sci. Technol., 48(15), pp. 8760–8767. 10.1021/es500898j [DOI] [PubMed] [Google Scholar]
- [86]. Vetten, M. A. , Tlotleng, N. , Rascher, D. T. , Skepu, A. , Keter, F. K. , Boodhia, K. , Koekemoer, L.-A. , Andraos, C. , Tshikhudo, R. , and Gulumian, M. , 2013, “ Label-Free In Vitro Toxicity and Uptake Assessment of Citrate Stabilised Gold Nanoparticles in Three Cell Lines,” Part. Fibre Toxicol., 10(1), p. 50. 10.1186/1743-8977-10-50 [DOI] [PMC free article] [PubMed] [Google Scholar]
- [87]. Lee, J. Y. , Clarke, M. L. , Tokumasu, F. , Lesoine, J. F. , Allen, D. W. , Chang, R. , Litorja, M. , and Hwang, J. , 2012, “ Absorption-Based Hyperspectral Imaging and Analysis of Single Erythrocytes,” IEEE J. Select. Top. Quantum Electron., 18(3), pp. 1130–1139. 10.1109/JSTQE.2011.2164239 [DOI] [Google Scholar]
- [88]. More, S. S. , Beach, J. M. , and Vince, R. , 2016, “ Early Detection of Amyloidopathy in Alzheimer's Mice by Hyperspectral Endoscopy,” Invest. Ophthalmol. Visual Sci., 57(7), pp. 3231–3238. 10.1167/iovs.15-17406 [DOI] [PubMed] [Google Scholar]
- [89]. Fu, D. , Yang, W. , and Xie, X. S. , 2017, “ Label-Free Imaging of Neurotransmitter Acetylcholine at Neuromuscular Junctions With Stimulated Raman Scattering,” J. Am. Chem. Soc., 139(2), pp. 583–586. 10.1021/jacs.6b10727 [DOI] [PubMed] [Google Scholar]
- [90]. Chaudhari, K. , and Pradeep, T. , 2014, “ Spatiotemporal Mapping of Three Dimensional Rotational Dynamics of Single Ultrasmall Gold Nanorods,” Sci. Rep., 4, p. 5948. 10.1038/srep05948 [DOI] [PMC free article] [PubMed] [Google Scholar]
- [91]. Mortimer, M. , Kahru, A. , and Slaveykova, V. I. , 2014, “ Uptake, Localization and Clearance of Quantum Dots in Ciliated Protozoa Tetrahymena Thermophila,” Environ. Pollut., 190, pp. 58–64. 10.1016/j.envpol.2014.03.021 [DOI] [PubMed] [Google Scholar]
- [92]. Misra, S. K. , Ostadhossein, F. , Daza, E. , Johnson, E. V. , and Pan, D. , 2016, “ Hyperspectral Imaging Offers Visual and Quantitative Evidence of Drug Release From Zwitterionic‐Phospholipid‐Nanocarbon When Concurrently Tracked in 3D Intracellular Space,” Adv. Funct. Mater., 26(44), pp. 8031–8041. 10.1002/adfm.201602966 [DOI] [Google Scholar]
- [93]. Gosnell, M. E. , Anwer, A. G. , Mahbub, S. B. , Perinchery, S. M. , Inglis, D. W. , Adhikary, P. P. , Jazayeri, J. A. , Cahill, M. A. , Saad, S. , and Pollock, C. A. , 2016, “ Quantitative Non-Invasive Cell Characterisation and Discrimination Based on Multispectral Autofluorescence Features,” Sci. Reports, 6, p. 23453. 10.1038/srep23453 [DOI] [PMC free article] [PubMed] [Google Scholar]
- [94]. Khaodhiar, L. , Dinh, T. , Schomacker, K. T. , Panasyuk, S. V. , Freeman, J. E. , Lew, R. , Vo, T. , Panasyuk, A. A. , Lima, C. , Giurini, J. M. , Lyons, T. E. , and Veves, A. , 2007, “ The Use of Medical Hyperspectral Technology to Evaluate Microcirculatory Changes in Diabetic Foot Ulcers and to Predict Clinical Outcomes,” Diabetes Care, 30(4), pp. 903–910.https://www.ncbi.nlm.nih.gov/pubmed/17303790 [DOI] [PubMed] [Google Scholar]
- [95]. Liu, L. , and Ngadi, M. O. , 2013, “ Detecting Fertility and Early Embryo Development of Chicken Eggs Using Near-Infrared Hyperspectral Imaging,” Food Bioprocess Technol., 6(9), pp. 2503–2513. 10.1007/s11947-012-0933-3 [DOI] [Google Scholar]
- [96]. Thirumala, S. , Gimble, J. M. , and Devireddy, R. V. , 2010, “ Cryopreservation of Stromal Vascular Fraction of Adipose Tissue in a Serum‐Free Freezing Medium,” J. Tissue Eng. Regener. Med., 4(3), pp. 224–232. 10.1002/term.232 [DOI] [PMC free article] [PubMed] [Google Scholar]
- [97]. Shaik, S. , Hayes, D. , Gimble, J. , and Devireddy, R. , 2017, “ Inducing Heat Shock Proteins Enhances the Stemness of Frozen-Thawed Adipose Tissue Derived Stem Cells,” Stem Cells Dev., 26(8), pp. 608–616. 10.1089/scd.2016.0289 [DOI] [PMC free article] [PubMed] [Google Scholar]
- [98]. Manolakis, D. , and Shaw, G. , 2002, “ Detection Algorithms for Hyperspectral Imaging Applications,” IEEE Signal Process. Mag., 19(1), pp. 29–43. 10.1109/79.974724 [DOI] [Google Scholar]
- [99]. Segers, V. F. , and Lee, R. T. , 2008, “ Stem-Cell Therapy for Cardiac Disease,” Nature, 451(7181), pp. 937–942. 10.1038/nature06800 [DOI] [PubMed] [Google Scholar]
- [100]. Langer, R. , 2007, “ Editorial: Tissue Engineering: Perspectives, Challenges, and Future Directions,” Tissue Eng., 13(1), pp. 1–2. 10.1089/ten.2006.0219 [DOI] [PubMed] [Google Scholar]
- [101]. Downes, A. , Mouras, R. , and Elfick, A. , 2010, “ Optical Spectroscopy for Noninvasive Monitoring of Stem Cell Differentiation,” BioMed Res. Int., 2010, p. 101864. 10.1155/2010/101864 [DOI] [PMC free article] [PubMed] [Google Scholar]