Abstract
Elastin is a peculiar elastomer in that it requires water to maintain resilience, and its mechanical properties are closely associated with the immediate aqueous environment. The bulk, extra- and intrafibrillar water plays important roles in both elastic and viscoelastic properties of elastin. In this study, a two-stage liquid–vapor method was developed to investigate the effects of water loss on the mechanical properties of porcine aortic elastin. The tissue samples started in a phosphate-buffered saline (PBS) solution at their fully hydrated condition, with a gravimetric water content of 370±36%. The hydration level was reduced by enclosing the tissue in dialysis tubing and submerging it in polyethylene glycol (PEG) solution at concentrations of 10%, 20%, 30%, and 45% w/v, which reduced the water content of the samples to 258±34%, 224±20%, 109±9%, and 58±3%, respectively. The samples were then transferred to a humidity chamber to maintain the hydration level while the samples underwent equi-biaxial tensile and stress relaxation tests. The concentration of 10% PEG treatment induced insignificant changes in tissue dimensions and stiffness, indicating that the removal of bulk water has less effect on elastin. Significant increases in tangent modulus were observed after 20% and 30% PEG treatment due to the decreased presence of extrafibrillar water. Elastin treated with 45% PEG shows a very rigid behavior as most of the extrafibrillar water is eliminated. These results suggest that extrafibrillar water is crucial for elastin to maintain its elastic behavior. It was also observed that the anisotropy of elastin tends to decrease with water loss. An increase in stress relaxation was observed for elastin treated with 30% PEG, indicating a more viscous behavior of elastin when the amount of extrafibrillar water is significantly reduced. Results from this study shed light on the close association between the bulk, extra- and intrafibrillar water pools and the mechanics of elastin.
Keywords: elastin, water loss, humidity chamber, bulk water, extrafibrillar water, intrafibrillar water
Introduction
Elastin is essential to provide elasticity to organs and tissues such as lung and arterial wall. Under physiological conditions, elastin is a peculiar elastomer in that it requires water to maintain resilience. In hydrated elastin, three types of water have been classified using nuclear magnetic resonance [1]. The intrafibrillar water, which interacts with elastin molecules directly [1], has been reported to have the effect of plasticizing elastin molecules and its content is about 60% expressed with gravimetric water content [2]. The water between and around elastin fibers is the extrafibrillar water [1–3]. The so-called hydration water is composed of both intra and extrafibrillar water [4]. It was reported that porcine aortic elastin contains approximately 250–300% hydration water [2]. The third type of water is the bulk water, referred to as the free interstitial water [2]. These three water pools are suggested to play important roles in both elastic and viscoelastic properties of elastin [2,5,6].
Hydrated elastin is elastic whereas water loss can result in brittle and rigid elastin [7–10]. Aging and diseases are often accompanied by water loss in soft biological tissue [11,12]. The binding of elastin to lipids, such as cholesterol esters, occurs in atherosclerosis and impedes the interactions between water molecules and elastin [11]. The stiffening of arterial wall with aging and diabetes is believed to be partially accounted for by water loss in elastin [4,13]. Both experimental and simulation results have shown the contribution of hydration water to the elastic behavior of elastin [4,13]. Removal of about 10% hydration water results in an increase in the stiffness of elastin [4]. Viscoelastic behavior of arterial elastin will compromise the effectiveness of energy storage and release of the cardiovascular system during a cardiac cycle [14]. Water-filled pores in elastic fibers are accessible to solutes, and changes in solution viscosity may affect the redistribution rate of intrafibrillar water that was suggested to be responsible for elastin viscoelasticity [5,10]. The fatigue life of elastin is shortened with water loss, which is associated with the fragmentation of elastin in poststenotic dilatation [15,16].
In most previous studies on the mechanical behavior of elastin, the method of mechanical testing was to submerge the tissue in a water bath to maintain a completely hydrated state [17–21]. In order to study the hydration-dependent tissue mechanics, liquid phase method (LPM) and vapor phase method (VPM) were generally used [2,22–24]. LPM is based on the concept of osmotic pressure causing water flow across a semipermeable barrier which is placed between the tissue and a higher solute concentration solution until the equilibrium of osmotic pressure is reached [2,25]. It quickly brings the tissue to the desired water content without causing degradation. However, LPM presents challenges for mechanical testing when an external load needs to be applied to the tissue sample. The other approach to control the hydration, VPM, is based on controlling the humidity of the air surrounding the sample to regulate the water content without physical contact [2,25]. VPM has the advantage of having the tissue samples freely accessible but it requires longer duration for hydration equilibrium, which exposes biological tissues to the risk of degradation. A liquid–vapor method, the combination of LPM and VPM, was developed to adjust tissue water content and maintain the hydration level during mechanical testing [25], and was successfully used to characterize the effects of water loss on the viscoelastic behaviors of bovine aortic tissue [26]. In the present study, a liquid–vapor method was developed to examine the effects of water loss on the biaxial mechanical behaviors of elastin. Porcine aortic elastin samples enclosed in dialysis tubing were immersed in 10%, 20%, 30%, and 45% w/v polyethylene glycol (PEG) solution to reach different hydration levels. Biaxial tensile and stress relaxation testing was then conducted while elastin was kept in a humidity chamber to maintain the hydration level during mechanical testing.
Materials and Methods
Sample Preparation.
Fresh porcine thoracic aortas (12–24 months of age; 160–200 lbs in weight) were harvested from a local abattoir and cleaned of both adherent tissue and fat. Square samples of about 20 × 20 mm were cut from the midpoint of the thoracic aorta to limit the changes in mechanical properties with longitudinal position [20]. Cyanogen bromide (CNBr) treatment was used to obtain purified elastin with the removal of cells, collagen, and other extracellular matrix (ECM) components [20,27]. Briefly, aortic samples were treated with 50 mg/ml CNBr (Acros Organics) in 70% formic acid (Acros Organics) solution for 19 h at room temperature with gentle stirring. They were then gently stirred for 1 h at 60 °C and followed by 5 min of boiling to inactivate CNBr. Elastin samples were kept in 1× phosphate-buffered saline (PBS) solution before further hydration level modulation and mechanical testing.
Hydration Level Modulation.
To adjust and maintain tissue hydration during testing, a sequential two-stage approach of the LPM and VPM, liquid–vapor method, was designed to take advantage of the shorter equilibrium time with LPM and the ability to maintain the desired hydration during mechanical testing with VPM [25]. Briefly, as the first stage, elastin samples were enclosed in dialysis tubing with molecular weight cutoff of 12 kD and submerged in 20 kD PEG solution at concentrations of 10%, 20%, 30%, and 45% w/v. The difference in concentration across the semipermeable barrier of the dialysis tubing causes water to leave the samples until equilibrium is reached (Fig. 1). The concentration of PEG solution determines the amount of water loss and therefore the PEG concentration can be varied to reach desired hydration levels. Generally higher solute concentration leads to higher osmotic pressure that results in lower sample water content. In the current study, the elastin samples were kept in the solution for at least 3 h to reach equilibrium.
Fig. 1.
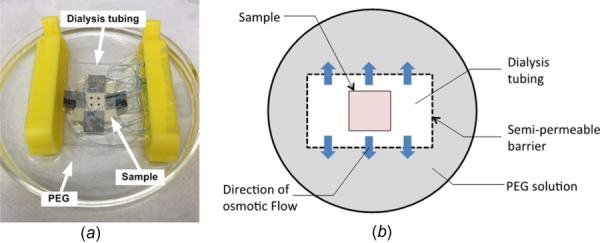
(a) Picture of an elastin sample enclosed in dialysis tubing and submerged in PEG solution. Sandpaper tabs were glued at the sides of sample with sutures looping around for mechanical testing. Four carbon dot markers were placed at the center of sample, and the position of the markers was traced by a camera during mechanical testing. (b) Schematic diagram of an elastin sample enclosed in dialysis tubing. An osmotic pressure between the inside and outside of the dialysis tubing causes water to leave the tissue.
At the second stage, the VPM was used to maintain the desired hydration level of the samples without obstructing mechanical and optical experiments. To do so, the PEG-treated samples were transferred to a humidity-controlled chamber compatible with the current biaxial tensile tester (Fig. 2). An appropriate chamber humidity was chosen for each PEG concentration so that water evaporated from the tissues at the same rate at which it condensed and then the samples could maintain the hydration levels achieved in LPM. The humidity in the chamber is represented by relative humidity (RH%), which is the ratio of the partial pressure of the water vapor in the air to the partial pressure of saturated water vapor at the given temperature. An iterative process was used to determine the relationship between the relative humidity and PEG concentration (PEG%) in VPM [25]. The iteration was carried out in the following manner. An LPM-treated tissue sample was weighed and transferred to the humidity chamber with a certain humidity level. After 30 min, the tissue was weighed again to quantify the change in tissue mass. The relative humidity in the chamber was adjusted according to the mass change and the iterative process continued until the change was less than 10%. The current designed humidity chamber could achieve a humidity range of about 11–95 RH% with the temperature varying from about 23 to 32 °C. During mechanical testing, the temperature varied within the range of 25–27 °C.
Fig. 2.
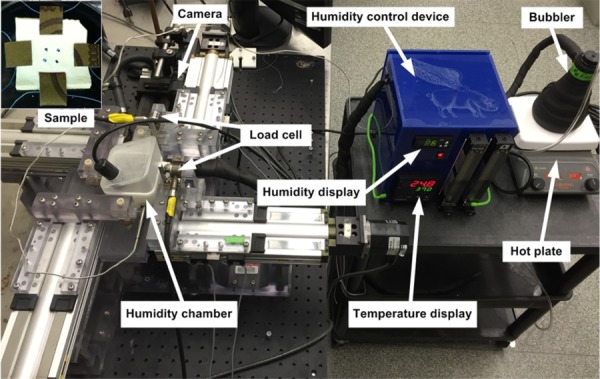
A custom-built VPM hydration chamber integrated with a biaxial tensile testing device. The tissue remains in the humidity chamber during mechanical testing.
To quantify the tissue water content, the sample was weighed using a balance before and after PEG treatment (LPM stage) as well as after mechanical testing and being moved out of the humidity chamber (VPM stage). The tissue was dried at room temperature for 3 days before the dry mass was measured. To validate that the time for drying is sufficient, the mass of the tissue was measured after being left to dry for 3, 4, and 5 days. The almost steady mass verifies that 3 days is long enough to dry the tissue. The hydration of the tissue was expressed with gravimetric water content, WC%. This is defined as the ratio of the mass of the water in the sample to the mass of the completely dried sample
| (1) |
where mw is the mass of the water in the hydrated sample, and md and mh are the completely dried mass and hydrated mass of the sample, respectively. Before and after PEG treatment, the side lengths and thickness of each sample were also measured using a digital caliper to characterize the effects of hydration levels on tissue dimensions.
Mechanical Testing.
Biaxial tensile tests were performed on elastin before and after PEG treatment. A total of ten samples were tested at four PEG concentrations (n = 5 for 10%, 20%, 30%, and 45%, and n = 4 for 45%). Three samples were treated sequentially with 10%, 20%, 30%, and 45% PEG and tested repeatedly after each treatment. Six samples were treated with only one PEG concentration, 10%, 20%, or 30% (two at each PEG concentration), and one sample was treated only with 45% PEG. As control experiments, samples were tested while submerged in 1 × PBS, which corresponds to the fully hydrated condition. Then samples enclosed in dialysis tubing were immersed in PEG solutions for 3 h to reach equilibrium in the LPM stage (Fig. 1). Afterwards, the treated samples were transferred to the humidity chamber designed to be compatible with our biaxial tensile testing device (Fig. 2). At the VPM step, the mechanical testing was performed while the humidity in the humidity chamber was adjusted to maintain the hydration level of the tissue. Sandpaper tabs were glued to the edges of the tissue samples with sutures looping through the sandpaper fold. The sutures were connected to the linear positioners of the biaxial tensile tester controlled by a custom LabVIEW program (National Instruments, Austin, TX). The load applied to the samples was measured and recorded through load cells in both the longitudinal and circumferential tissue directions. For each test, a small preload of 5±0.05 N/m was applied to flatten the tissue. Each sample was preconditioned for eight cycles with 10 s of half cycle time of equi-biaxial tension of 40 N/m. After preconditioning, eight cycles of equi-biaxial tension ranging from 80 to 110 N/m were applied to achieve repeatable loading and unloading responses. In this study, the tension range was chosen to achieve a stress level of ∼100 kPa that has close physiological relevance [28,29]. Four carbon dot markers forming an approximately 5 mm × 5 mm square were placed at the center of the samples, and a CCD camera was used to track the displacement of markers for the determination of the stretch in both directions [30]. The load and stretch data used for analysis were collected from the eighth cycle, when the load-stretch curves were stable. Tangent modulus was obtained by differentiating the stress-stretch curves and was used to quantify changes in the elastic behavior of elastin before and after PEG dialysis tubing treatment. Normalized tangent modulus was calculated by dividing the tangent modulus of treated elastin to the corresponding control value.
Biaxial stress relaxation tests were performed on elastin before and after 20% and 30% PEG treatment (n = 3). After biaxial tensile preconditioning, another equi-biaxial tension of eight cycles with 10 s of half cycle time was applied. Immediately after the last cycle, the sample was quickly loaded to the target tension with a rise time of 2 s and held at the constant stretch for 900 s. Five cycles of stress relaxation were performed to achieve repeatable stress relaxation behavior [21]. Tension ranging from 80 to 110 N/m was applied in stress relaxation tests to reach similar maximum Cauchy stress for all samples and to eliminate the effect of initial stress levels [21]. Cauchy stress was calculated based on plane stress and incompressibility assumptions and by using the tissue dimensions measured before tensile testing [30].
Statistical Analysis.
The averaged results are expressed in the form of mean±standard error of the mean. One-way analysis of variance followed by Dunnett's post hoc comparisons was performed as statistical analysis by jmp pro (version 10.0.2, SAS Institute Inc., Cary, NC). Differences are considered to be significant when p < 0.05.
Results
The relationships between PEG concentration and water content, relative humidity, and solute concentration are shown in Fig. 3. Figure 3(a) shows that higher PEG concentration leads to lower water content at the LPM stage, and the relationship between PEG (PEG%) concentration and water content (WC%) can be described by a sigmoid function in Eq. (2). At the VPM stage, Fig. 3(b) provides the relationship between the relative humidity (RH%) in the humidity chamber and the concentration of PEG (PEG%) solution required, and such relationship is described by Eq. (3). The averaged results were used to obtain the above relationships (n = 10 for 0% PEG as control; n = 5 for 10%, 20%, and 30% PEG; and n = 4 for 45% PEG)
| (2) |
| (3) |
Fig. 3.
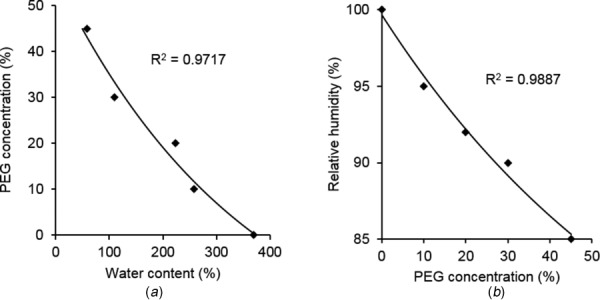
Average experimental results with fitting curves of (a) PEG concentration versus water content and (b) relative humidity versus PEG concentration. The R2 values represent correlation coefficients between the measurements and fitted results (n = 10 for control; n = 5 for 10%, 20%, and 30% PEG; and n = 4 for 45% PEG).
To verify the effectiveness of the liquid–vapor method, the water content of elastin before and after PEG treatment, and after VPM is presented in Fig. 4. Water content decreases in elastin treated with PEG solution, and the changes are significant with the 30% and 45% PEG solution. The average water contents of 370±36%, 258±34%, 224±20%, 109±9%, and 58±3% correspond to the control, and PEG concentrations of 10%, 20%, 30%, and 45%, respectively. Keeping the samples in VPM humidity chamber during mechanical testing does not induce significant changes in water content. This validates that the humidity chamber functions properly and the hydration level of elastin is maintained during mechanical testing.
Fig. 4.
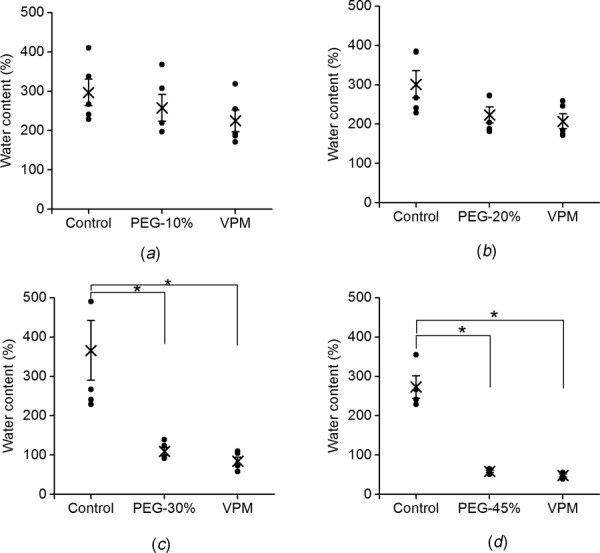
Water contents of samples at control and after LPM and VPM stages. The LPM samples were treated with (a) 10%, (b) 20%, (c) 30% (n = 5), and (d) 45% (n = 4) PEG solution (*p < 0.05).
Water loss leads to gradually decreased side length and thickness, as shown in Fig. 5. The normalized dimension changes were obtained by dividing the dimensions of PEG-treated elastin by dimensions before treatment. There is a significant decrease of tissue dimensions associated with the 30% and 45% PEG treatment, except for the circumferential side length. It also appears that the thickness is more sensitive to water loss and decreases to almost half of the original value.
Fig. 5.
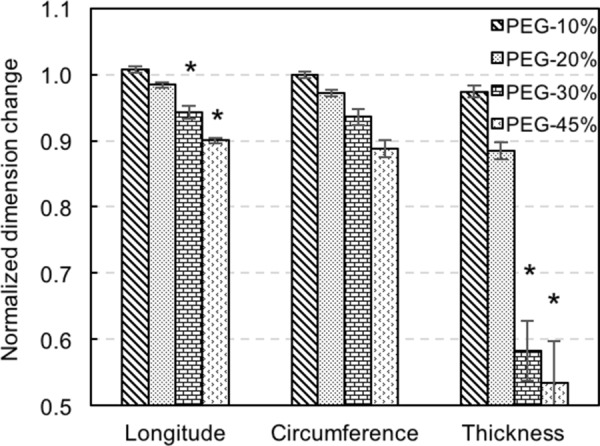
Normalized dimension changes of PEG-treated elastin (n = 5 for 10%, 20%, and 30% PEG; n = 4 for 45% PEG). The dimensions of PEG-treated elastin were normalized to the values of the corresponding control group (*p < 0.05).
Figure 6 shows swelling ratio, defined as the ratio of the volume of tissue after water loss to the sample's volume when fully hydrated, at various water contents. The treatment of 10% PEG results in a minor decrease of swelling ratio to 0.98±0.01. The results then show a linear decrease in swelling ratio to 0.43±0.05 with 45% PEG treatment. There is a significant decrease in both the water content and swelling ratio for elastin exposed to 30% and 45% PEG solution, and in swelling ratio for elastin exposed to 20% PEG solution (p < 0.05).
Fig. 6.
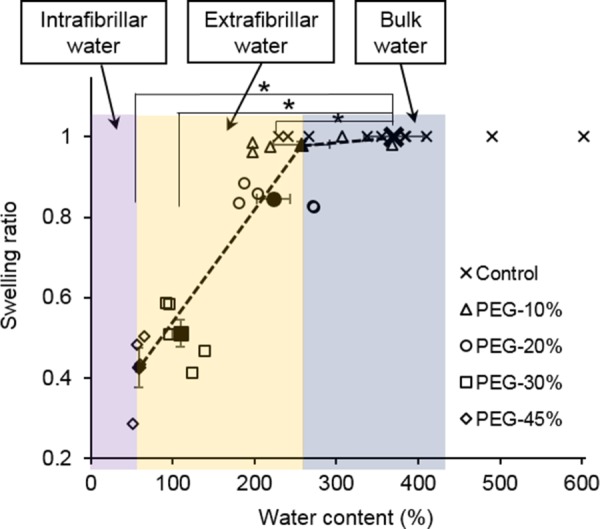
Swelling ratio versus water content of control (n = 10) and PEG-treated elastin (n = 5 for 10%, 20%, and 30% PEG; n = 4 for 45% PEG). Closed symbols represent average value (*p < 0.05).
The averaged Cauchy stress versus stretch curves in both the longitudinal and circumferential directions are shown in Fig. 7. For consistency, a maximum stress of 80 kPa was chosen when comparing the results from both control and treated elastin. Generally, the elastin stiffens in both directions with loss of water, and the stiffening is more obvious with 30% and 45% PEG treatment while the latter one induces very stiff behavior. Normalized tangent modulus was obtained to better compare the changes in the elastic behavior of elastin with different water contents (Fig. 8). The tangent modulus of 10% PEG-treated elastin remains similar to the control elastin in both the longitudinal and circumferential directions (p = 0.2819 and p = 0.3403, respectively), but 20% and 30% PEG treatment resulted in a significant increase in modulus in both directions, except the tangent modulus of 20% PEG-treated elastin in the circumferential direction (p = 0.1483). The tangent modulus of 45% PEG-treated elastin is not shown in Fig. 7 since it tends to be infinity due to the extremely stiff behavior.
Fig. 7.
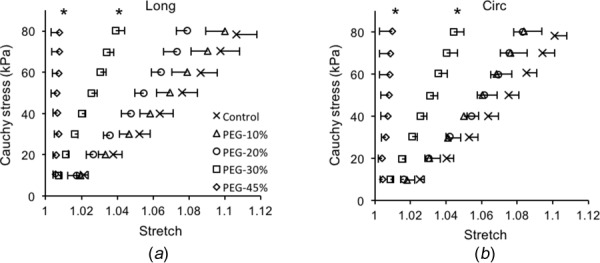
Average Cauchy stress versus stretch curves in the (a) longitudinal and (b) circumferential directions of control (n = 10) and PEG-treated elastin (n = 5 for 10%, 20%, and 30% PEG; n = 4 for 45% PEG). One-sided error bars of a standard error of the mean are shown in both directions (*p < 0.05).
Fig. 8.
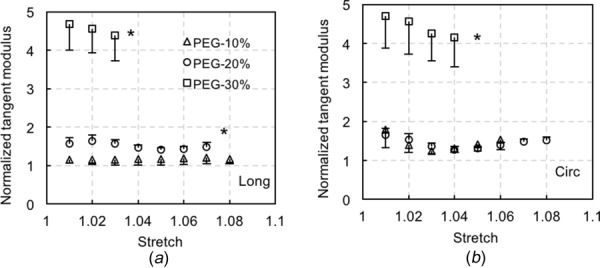
Normalized tangent modulus in the (a) longitudinal (long), and (b) circumferential (cir) directions of PEG-treated elastin (n = 5 for 10%, 20%, and 30% PEG; n = 4 for 45% PEG). The tangent modulus of dehydrated elastin was normalized to its corresponding control value when the sample is fully hydrated (*p < 0.05).
The change in anisotropic behavior is observed from Cauchy stress versus stretch curves. The degree of anisotropy is quantified by the ratio of the longitudinal to circumferential stretch at similar stress of 79.95±0.25 kPa (Fig. 9). The anisotropic behavior of elastin is not affected with 10% PEG. However, a decrease in the ratio was observed for elastin treated with 20%, 30%, and 45% PEG. The 45% PEG treatment induces almost isotropic behavior for most of the samples.
Fig. 9.
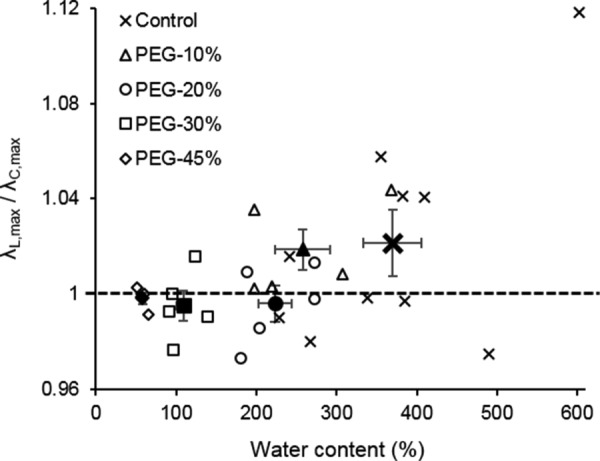
Ratio of the longitudinal to circumferential stretch versus water content of control (n = 10) and PEG-treated elastin (n = 5 for 10%, 20%, and 30% PEG; n = 4 for 45% PEG). All stretch values are paired with Cauchy stress of 79.95±0.25 kPa. Closed symbols represent the average data.
The representative normalized stress relaxation curves are shown in Fig. 10. For this sample, the water contents of 241%, 188%, and 95% correspond to the control, 20%, and 30% PEG treatments, respectively. All stress relaxation tests were performed at the initial stresses of 94.22±3.22 kPa to minimize the effect of initial stress levels on the rate of stress relaxation [21]. There is no obvious change in stress relaxation until the water content decreases to 95% induced by 30% PEG treatment. This phenomenon is consistent in all the samples (n = 3). The amount of the stress relaxation was quantified by dividing the total stress drop, i.e., the difference between the initial stress and the stress at the end of the relaxation period, by the initial stress. The amount of stress relaxation for the control and 20% PEG-treated tissue is 0.0843±0.0037 and 0.0808±0.0035 (p = 0.5189), respectively, whereas the amount of stress relaxation increases significantly to 0.1509±0.0051 (p < 0.5) for elastin treated with 30% PEG.
Fig. 10.
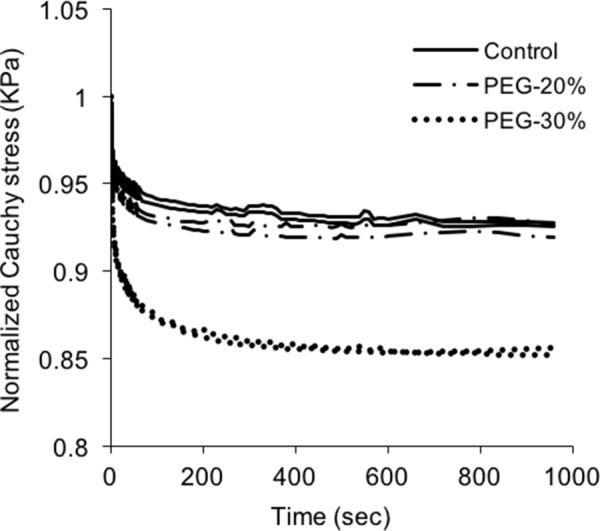
Representative stress relaxation curves of elastin before and after PEG treatment. Water contents are 241%, 188%, 95% for control, and after 20% and 30% PEG treatment, respectively.
Discussion
Mechanical behaviors of biological materials are closely associated with the hydration level of the tissues [31–33]. Elastin is one of the major ECM constituents that provides elasticity to the aortic wall. Water acts as a plasticizer and plays an important role in maintaining its elasticity [2,4]. Results from the present study provide new understandings on the role of bulk, extra- and intrafibrillar water in contributing to the elastic and viscoelastic behavior of elastin with a custom designed hydration chamber that allows mechanical characterization with controlled hydration modulation.
Liquid phase method with 10% PEG solution results in 258±34% water and no obvious change in tissue dimensions (Figs. 4 and 5). Lillie et al. [2] suggested that porcine aortic elastin contains approximately 250–300% intrafibrillar plus extrafibrillar water content, and removing the bulk water does not result in changes in tissue dimensions. This indicates that LPM with 10% PEG solution removes the bulk water in elastin. LPM with 45% PEG results in 58±3% water content in the tissue. According to Lillie et al. [2], the intrafibrillar water content is about 60%. This suggests that most of the extrafibrillar water has been extracted out with 45% PEG, and the intrafibrillar water is the only water pool left in the tissue. Considering the water contents of elastin and the corresponding change in the dimensions, our results suggest that the dimensions of purified elastin are mainly affected when the extrafibrillar water is removed (Fig. 5), which is true for elastin with approximately 224%, 109%, and 58% water content when 20%, 30%, and 45% PEG was used in LPM, respectively. It appears that the thickness decreases more than the side lengths with water loss. It is likely that purified elastin is more easily packed in the radial direction when tissue water content decreases due to the removal of cells, collagen, proteoglycan, etc., from the concentric lamellar units.
The elastic behavior of elastin is closely associated with the plasticizing effect of water [7–10]. In the current study, stiffening was observed with loss of water (Fig. 7). The insignificant change in tangent modulus of elastin with 10% PEG suggests that the bulk water plays a less important role in contributing to elastin's elasticity. The tissue treated with PEG solution of higher concentrations gradually stiffens in both the circumferential and longitudinal directions with the removal of the extrafibrillar water. Debelle and Alix [6] suggested that the bulk solvent water plays a key role in maintaining the elasticity of elastin. They suggested that the existence of hydrogen bonds between bulk solvent water and hydration water molecules, referred to as extra- and intrafibrillar water molecules, motivates a higher chain mobility. It is worth noting, however, that their definition of the bulk solvent water includes both the bulk (or free) and part of the extrafibrillar water defined in some previous studies [2,34,35] as well as the current study. The hydration water they mentioned includes some extrafibrillar and all intrafibrillar water, and the latter one is tightly bound to the polypeptide chains. In this case, their conclusion can still be applied to explain our observations as the hydrogen bonds between extra- and intrafibrillar water loosen the hydrogen bonds between intrafibrillar water and elastin molecules, so that the tissue with more extrafibrillar water has a more elastic behavior. Another possible mechanism of the plasticizing effect of water at nanometric scale is attributed to the replacement of protein/protein hydrogen bonds by protein/water hydrogen bonds that increase the chain mobility [36].
Aortic elastin has been reported to be anisotropic [20,27,37,38]. Our study shows that the anisotropy decreases with the loss of water (Fig. 8). Fiber orientation is widely considered to be the structural origin of the tissue anisotropy [39,40]. There may exist realignment of elastic fibers, as the elastic lamellae layers are more packed in the radial direction due to water removal. As suggested by our earlier study using a computational model, decrease in spacing induced by water loss will likely lead to an increase in the density of elastic fibers and potential fiber realignment [27]. While some microscopic studies are required to fully understand the structural changes with water loss, the much denser fiber network structure will likely result in a stiffer mechanical behavior (Figs. 7 and 8), and fiber realignment will likely be related to the more isotropic behavior (Fig. 9).
An increase in stress relaxation was observed in the 30% PEG-treated elastin with 95% water content (Fig. 10), which indicates that the viscoelastic property of elastin is also associated with the hydration level. However, elastin treated with 20% PEG showed no obvious difference in stress relaxation compared with fully hydrated condition. It is possible that the loose hydrogen bonding between intrafibrillar water and elastin molecules is affected when the amount of extrafibrillar water is significantly reduced. In fact, a study by Perry et al. [41] showed that the nuclear magnetic resonance spectra of elastin remain nearly unchanged when nearly two-thirds of its water is removed. Comparing to the water content at fully hydrated condition, 30% PEG treatment reduces the water content from 370±36% to 109±9%, i.e., by about two-thirds. This may have an effect on the rate of intrafibrillar water redistribution, which was suggested to be closely related to the rate of stress relaxation [5,10]. A previous study showed a drastic decrease of glass transition temperature associated with higher hydration levels, indicating the close connection of viscoelastic property of elastin to the water content [36]. Shahmirzadi et al. [26] reported lower water content leads to less stress relaxation for bovine aorta; however, the presence of cells and other ECM constituents would greatly complicate the stress relaxation mechanism. Overall, our results further suggest that among the three water pools in elastin, the intrafibrillar water plays a crucial role in its viscoelastic property, while the amount of extrafibrillar water is also related to the viscoelastic property through its hydrogen bonding with the intrafibrillar water.
Limitations
The PEG-treated tissue was transferred from dialysis tubing to humidity chamber for mechanical testing. During this transferring process, the tissue was exposed to ambient air briefly and this may lead to a change in the water content. Also, weight and dimension measurements may induce changes in the water content of the tissue. There were three samples being treated sequentially at all PEG concentrations. It is unlikely that the mechanical testing in this study caused damage to the tissue. The stress levels achieved in this study (∼100 kPa) are within physiological stress range and are much smaller than the ultimate strength. Lillie and Gosline [17] reported that the lowest average failure stress from uniaxial tensile test is 1.38 MPa for purified porcine thoracic aortic elastin. However, these measurements are at the tissue level, and stresses experienced at the fiber level are not known. After each PEG treatment, the sample's size was remeasured, and the reference configuration for calculating stress and stretch was updated. The incompressibility assumption was used in calculations of Cauchy stresses when the sample was subjected to planar biaxial loading. While the incompressibility assumption has been widely used for fully hydrated soft biological tissues, there is no evidence to suggest whether this assumption can be applied to partially hydrated tissue or not.
Conclusions
A two-stage liquid–vapor method was developed to study the effect of water loss on the mechanical properties of elastin. Our study shows that the mechanical behaviors of elastin are closely associated with hydration condition. As the hydration level decreases, the bulk water is removed first without affecting the dimensions and mechanical properties of elastin significantly. Afterwards, the removal of the extrafibrillar water is accompanied by the shrinkage and stiffening of the tissue. The more obvious decrease in thickness than side lengths suggests that water loss leads to a much denser structure in the radial direction, but induce relatively less effect on in-plane lamellar structure. A more isotropic behavior after partial water removal is possibly correlated with elastic fiber realignment. Removal of the extrafibrillar water also results in an increase of stress relaxation. Future studies are needed to understand the role of extra- and intrafibrillar water in the viscoelastic behavior of elastin. Results from this study shed light on the roles of different water pools in contributing to the mechanical properties of elastin. However, vascular remodeling involves many complex effects and future studies are needed to understand the relevance of the findings from this study to vascular mechanics.
Contributor Information
Yunjie Wang, Department of Mechanical Engineering, , Boston University, , 110 Cummington Mall, , Boston, MA 02215.
Jacob Hahn, Department of Mechanical Engineering, , Boston University, , 110 Cummington Mall, , Boston, MA 02215.
Yanhang Zhang, Department of Mechanical Engineering, , Boston University, , 110 Cummington Mall, , Boston, MA 02215;; Department of Biomedical Engineering, , Boston University, , Boston, MA 02215 , e-mail: yanhang@bu.edu
Funding Data
Division of Civil, Mechanical, and Manufacturing Innovation (Grant No. CMMI 1463390).
National Heart, Lung, and Blood Institute (Grant No. HL098028).
References
- [1]. Ellis, G. E. , and Packer, K. J. , 1976, “ Nuclear Spin-Relaxation Studies of Hydrated Elastin,” Biopolymers, 15(5), pp. 813–832. 10.1002/bip.1976.360150502 [DOI] [PubMed] [Google Scholar]
- [2]. Lillie, M. A. , Chalmers, G. W. , and Gosline, J. M. , 1996, “ Elastin Dehydration Through the Liquid and the Vapor Phase: A Comparison of Osmotic Stress Models,” Biopolymers, 39(5), pp. 627–639. [DOI] [PubMed] [Google Scholar]
- [3]. Wasano, K. , and Yamamoto, T. , 1983, “ Tridimensional Architecture of Elastic Tissue in the Rat Aorta and Femoral Artery—A Scanning Electron Microscope Study,” J. Electron Microsc., 32(1), pp. 33–44. 10.1093/oxfordjournals.jmicro.a050393 [DOI] [PubMed] [Google Scholar]
- [4]. Gosline, J. M. , and French, C. J. , 1979, “ Dynamic Mechanical Properties of Elastin,” Biopolymers, 18(8), pp. 2091–2103. 10.1002/bip.1979.360180818 [DOI] [PubMed] [Google Scholar]
- [5]. Weinberg, P. D. , Winlove, C. P. , and Parker, K. H. , 1995, “ The Distribution of Water in Arterial Elastin: Effects of Mechanical Stress, Osmotic Pressure, and Temperature,” Biopolymers, 35(2), pp. 161–169. 10.1002/bip.360350204 [DOI] [PubMed] [Google Scholar]
- [6]. Debelle, L. , and Alix, A. J. , 1999, “ The Structures of Elastins and Their Function,” Biochimie, 81(10), pp. 981–994. 10.1016/S0300-9084(99)00221-7 [DOI] [PubMed] [Google Scholar]
- [7]. Gosline, J. M. , 1978, “ Hydrophobic Interaction and a Model for the Elasticity of Elastin,” Biopolymers, 17(3), pp. 677–695. 10.1002/bip.1978.360170311 [DOI] [PubMed] [Google Scholar]
- [8]. Gosline, J. M. , 1978, “ The Temperature-Dependent Swelling of Elastin,” Biopolymers, 17(3), pp. 697–707. 10.1002/bip.1978.360170312 [DOI] [PubMed] [Google Scholar]
- [9]. Andrady, A. L. , and Mark, J. E. , 1980, “ Thermoelasticity of Swollen Elastin Networks at Constant Composition,” Biopolymers, 19(4), pp. 849–855. 10.1002/bip.1980.360190410 [DOI] [Google Scholar]
- [10]. Winlove, C. P. , and Parker, K. H. , 1990, “ Influence of Solvent Composition on the Mechanical Properties of Arterial Elastin,” Biopolymers, 29(4–5), pp. 729–735. 10.1002/bip.360290407 [DOI] [PubMed] [Google Scholar]
- [11]. Lillie, M. A. , and Gosline, J. M. , 1990, “ The Effects of Hydration on the Dynamic Mechanical Properties of Elastin,” Biopolymers, 29(8–9), pp. 1147–1160. 10.1002/bip.360290805 [DOI] [PubMed] [Google Scholar]
- [12]. Rasouli, M. , Kiasari, A. M. , and Arab, S. , 2008, “ Indicators of Dehydration and Haemoconcentration are Associated With the Prevalence and Severity of Coronary Artery Disease,” Clin. Exp. Pharmacol. Physiol., 35(8), pp. 889–894. 10.1111/j.1440-1681.2008.04932.x [DOI] [PubMed] [Google Scholar]
- [13]. Li, B. , Alonso, D. O. , Bennion, B. J. , and Daggett, V. , 2001, “ Hydrophobic Hydration is an Important Source of Elasticity in Elastin-Based Biopolymers,” J. Am. Chem. Soc., 123(48), pp. 11991–11998. 10.1021/ja010363e [DOI] [PubMed] [Google Scholar]
- [14]. Urry, D. W. , and Parker, T. M. , 2002, “ Mechanics of Elastin: Molecular Mechanism of Biological Elasticity and Its Relationship to Contraction,” J. Muscle Res. Cell Motil., 23(5–6), pp. 543–59. 10.1023/A:1023422925910 [DOI] [PubMed] [Google Scholar]
- [15]. Rodbard, S. , Ikeda, K. , and Montes, M. , 1967, “ An Analysis of Mechanisms of Poststenotic Dilatation,” Angiology, 18(6), pp. 349–369. 10.1177/000331976701800601 [DOI] [PubMed] [Google Scholar]
- [16]. Trillo, A. , and Haust, M. D. , 1975, “ Arterial Elastic Tissue and Collagen in Experimental Poststenotic Rilatation in Dogs,” Exp. Mol. Pathol., 23(3), pp. 473–490. 10.1016/0014-4800(75)90038-6 [DOI] [PubMed] [Google Scholar]
- [17]. Lillie, M. A. , and Gosline, J. M. , 2002, “ The Viscoelastic Basis for the Tensile Strength of Elastin,” Int. J. Biol. Macromol., 30(2), pp. 119–127. 10.1016/S0141-8130(02)00008-9 [DOI] [PubMed] [Google Scholar]
- [18]. Lillie, M. A. , and Gosline, J. M. , 2007, “ Mechanical Properties of Elastin Along the Thoracic Aorta in the Pig,” J. Biomech., 40(10), pp. 2214–2221. 10.1016/j.jbiomech.2006.10.025 [DOI] [PubMed] [Google Scholar]
- [19]. Gundiah, N. , Ratcliffe, M. B. , and Pruitt, L. A. , 2007, “ Determination of Strain Energy Function for Arterial Elastin: Experiments Using Histology and Mechanical Tests,” J. Biomech., 40(3), pp. 586–594. 10.1016/j.jbiomech.2006.02.004 [DOI] [PubMed] [Google Scholar]
- [20]. Zou, Y. , and Zhang, Y. , 2009, “ An Experimental and Theoretical Study on the Anisotropy of Elastin Network,” Ann. Biomed. Eng., 37(8), pp. 1572–1583. 10.1007/s10439-009-9724-z [DOI] [PubMed] [Google Scholar]
- [21]. Zou, Y. , and Zhang, Y. , 2011, “ The Orthotropic Viscoelastic Behavior of Aortic Elastin,” Biomech. Model. Mechanobiol., 10(5), pp. 613–625. 10.1007/s10237-010-0260-4 [DOI] [PubMed] [Google Scholar]
- [22]. Basser, P. J. , Schneiderman, R. , Bank, R. A. , Wachtel, E. , and Maroudas, A. , 1998, “ Mechanical Properties of the Collagen Network in Human Articular Cartilage as Measured by Osmotic Stress Technique,” Arch. Biochem. Biophys., 351(2), pp. 207–219. 10.1006/abbi.1997.0507 [DOI] [PubMed] [Google Scholar]
- [23]. MacDougall, A. J. , Rigby, N. M. , Ryden, P. , Tibbits, C. W. , and Ring, S. G. , 2001, “ Swelling Behavior of the Tomato Cell Wall Network,” Biomacromolecules, 2(2), pp. 450–455. 10.1021/bm005632s [DOI] [PubMed] [Google Scholar]
- [24]. Zsivanovits, G. , MacDougall, A. J. , Smith, A. C. , and Ring, S. G. , 2004, “ Material Properties of Concentrated Pectin Networks,” Carbohydr. Res., 339(7), pp. 1317–1322. 10.1016/j.carres.2004.02.027 [DOI] [PubMed] [Google Scholar]
- [25]. Shahmirzadi, D. , and Hsieh, A. H. , 2010, “ An Efficient Technique for Adjusting and Maintaining Specific Hydration Levels in Soft Biological Tissues In Vitro,” Med. Eng. Phys., 32(7), pp. 795–801. 10.1016/j.medengphy.2010.04.021 [DOI] [PubMed] [Google Scholar]
- [26]. Shahmirzadi, D. , Bruck, H. A. , and Hsieh, A. H. , 2013, “ Measurement of Mechanical Properties of Soft Tissues In Vivo Under Controlled Tissue Hydration,” Exp. Mech., 53(3), pp. 405–414. 10.1007/s11340-012-9644-y [DOI] [Google Scholar]
- [27]. Wang, Y. , Zeinali-Davarani, S. , Davis, E. C. , and Zhang, Y. , 2015, “ Effect of Glucose on the Biomechanical Function of Arterial Elastin,” J. Mech. Behav. Biomed. Mater., 49, pp. 244–254. 10.1016/j.jmbbm.2015.04.025 [DOI] [PMC free article] [PubMed] [Google Scholar]
- [28]. Stergiopulos, N. , Vulliemoz, S. , Rachev, A. , Meister, J. J. , and Greenwald, S. E. , 2001, “ Assessing the Homogeneity of the Elastic Properties and Composition of the Pig Aortic Media,” J. Vasc. Res., 38(3), pp. 237–246. 10.1159/000051052 [DOI] [PubMed] [Google Scholar]
- [29]. Guo, X. , and Kassab, G. S. , 2004, “ Distribution of Stress and Strain Along the Porcine Aorta and Coronary Arterial Tree,” Am. J. Physiol. Heart Circ. Physiol., 286(6), pp. H2361–H2368. 10.1152/ajpheart.01079.2003 [DOI] [PubMed] [Google Scholar]
- [30]. Chow, M.-J. , Mondonedo, J. R. , Johnson, V. M. , and Zhang, Y. , 2013, “ Progressive Structural and Biomechanical Changes in Elastin Degraded Aorta,” Biomech. Model. Mechanobiol., 12(2), pp. 361–372. 10.1007/s10237-012-0404-9 [DOI] [PMC free article] [PubMed] [Google Scholar]
- [31]. Talman, E. A. , and Boughner, D. R. , 2001, “ Effect of Altered Hydration on the Internal Shear Properties of Porcine Aortic Valve Cusps,” Ann. Thorac. Surg., 71(5), pp. 3–6.https://doi.org/10.1016/S0003-4975(01)02546-2 [DOI] [PubMed] [Google Scholar]
- [32]. Taylor, A. M. , Bonser, R. H. C. , and Farrent, J. W. , 2004, “ The Influence of Hydration on the Tensile and Compressive Properties of Avian Keratinous Tissues,” J. Mater. Sci., 39(3), pp. 939–942. 10.1023/B:JMSC.0000012925.92504.08 [DOI] [Google Scholar]
- [33]. Gainaru, C. , Fillmer, A. , and Böhmer, R. , 2009, “ Dielectric Response of Deeply Supercooled Hydration Water in the Connective Tissue Proteins Collagen and Elastin,” J. Phys. Chem. B, 113(38), pp. 12628–12631. 10.1021/jp9065899 [DOI] [PubMed] [Google Scholar]
- [34]. Boutis, G. , Renner, C. , and Isahkarov, T. , 2007, “ High Resolution q‐Space Imaging Studies of Water in Elastin,” Biopolymers, 87(5–6), pp. 352–359. 10.1002/bip.20838 [DOI] [PubMed] [Google Scholar]
- [35]. Silverstein, M. C. , Bilici, K. , Morgan, S. W. , Wang, Y. , Zhang, Y. , and Boutis, G. S. , 2015, “ 13C, 2H NMR Studies of Structural and Dynamical Modifications of Glucose-Exposed Porcine Aortic Elastin,” Biophys. J., 108(7), pp. 1758–1772. 10.1016/j.bpj.2015.02.005 [DOI] [PMC free article] [PubMed] [Google Scholar]
- [36]. Samouillan, V. , André, C. , Dandurand, J. , and Lacabanne, C. , 2004, “ Effect of Water on the Molecular Mobility of Elastin,” Biomacromolecules, 5(3), pp. 958–964. 10.1021/bm034436t [DOI] [PubMed] [Google Scholar]
- [37]. Rezakhaniha, R. , and Stergiopulos, N. , 2008, “ A Structural Model of the Venous Wall Considering Elastin Anisotropy,” ASME J. Biomech. Eng., 130(3), p. 031017. 10.1115/1.2907749 [DOI] [PubMed] [Google Scholar]
- [38]. Agrawal, V. , Kollimada, S. A. , Byju, A. G. , and Gundiah, N. , 2013, “ Regional Variations in the Nonlinearity and Anisotropy of Bovine Aortic Elastin,” Biomech. Model. Mechanobiol., 12(6), pp. 1181–1194. 10.1007/s10237-013-0474-3 [DOI] [PubMed] [Google Scholar]
- [39]. Holzapfel, G. A. , and Weizsäcker, H. W. , 1998, “ Biomechanical Behavior of the Arterial Wall and Its Numerical Characterization,” Comput. Biol. Med., 28(4), pp. 377–392. 10.1016/S0010-4825(98)00022-5 [DOI] [PubMed] [Google Scholar]
- [40]. Holzapfel, G. A. , Gasser, T. C. , and Ogden, R. W. , 2000, “ A New Constitutive Framework for Arterial Wall Mechanics and a Comparative Study of Material Models,” J. Elasticity, 61(1–3), pp. 1–48. 10.1023/A:1010835316564 [DOI] [Google Scholar]
- [41]. Perry, A. , Stypa, M. P. , Tenn, B. K. , and Kumashiro, K. K. , 2002, “ Solid-State 13C NMR Reveals Effects of Temperature and Hydration on Elastin,” Biophys. J., 82(2), pp. 1086–1095. 10.1016/S0006-3495(02)75468-4 [DOI] [PMC free article] [PubMed] [Google Scholar]


