Abstract
Connective tissue mechanics is highly nonlinear, exhibits a strong Poisson's effect, and is associated with significant collagen fiber re-arrangement. Although the general features of the stress–strain behavior have been discussed extensively, the Poisson's effect received less attention. In general, the relationship between the microscopic fiber network mechanics and the macroscopic experimental observations remains poorly defined. The objective of the present work is to provide additional insight into this relationship. To this end, results from models of random collagen networks are compared with experimental data on reconstructed collagen gels, mouse skin dermis, and the human amnion. Attention is devoted to the mechanism leading to the large Poisson's effect observed in experiments. The results indicate that the incremental Poisson's contraction is directly related to preferential collagen orientation. The experimentally observed downturn of the incremental Poisson's ratio at larger strains is associated with the confining effect of fibers transverse to the loading direction and contributing little to load bearing. The rate of collagen orientation increases at small strains, reaches a maximum, and decreases at larger strains. The peak in this curve is associated with the transition of the network deformation from bending dominated, at small strains, to axially dominated, at larger strains. The effect of fiber tortuosity on network mechanics is also discussed, and a comparison of biaxial and uniaxial loading responses is performed.
Keywords: collagen network, microscale modeling, fibrous tissue mechanics
1. Introduction
Connective tissue generally contains a random three-dimensional or quasi-two-dimensional (2D) collagen network. The cruciate ligament contains 78% collagen by dry weight, the meniscus contains 90%, skin 65%, and tendon 78% [1]. Elastin is an important component in some tissue, such as the aorta (45% by dry weight, compared with 25% collagen) [1]. The mechanical behavior of these tissues is controlled to a large extent by the mechanics of the collagen network, while the transport of water between the tissue and the surrounding medium also plays a role.
Collagen organization in tissue is complex. Collagen fibrils of submicron diameter organize in fibers, which may organize further in fascicles, as is the case in tendon. The nature and strength of interfibrillar connectors are poorly understood at this time. Fibrils separate from a bundle to join another bundle, and this provides some degree of connectivity between bundles. Collagen fibrils can be also connected by proteoglycans. It is not clear to what extent bundles of fibrils re-organize during network deformation.
Generally, fibril orientation is neither uniform nor entirely random over the volume of a tissue. Tendon has a preferentially aligned collagen structure [2–5] with some level of crimp being present in the unloaded state. Cartilage has a complex structure with collagen oriented parallel to the surface in the superficial regions, having random orientation in the central part of the tissue and being oriented perpendicular to the interface with the bone in the deeper layer [6,7]. Ligaments may have complex collagen structures; the facet capsule ligament of the spine exhibits a patchwork of preferentially oriented subdomains [8]. In membranes, collagen organization is quasi-two-dimensional and some degree of preferential orientation in the plane of the membrane is expected [9–13], although the quantitative experimental evaluation of the difference between the in-plane and out-of-plane fibril orientation in the undeformed state is difficult.
Modeling the mechanical behavior of soft tissue has been centered on the development of constitutive equations that take into account essential components of the physics, such as the exchange of water with the environment (biphasic model) and deformation-induced fiber orientation, but generally disregard the details of the microstructure [14]. A mean-field class of models assumes that fibers move independently and follow the macroscopic applied deformation [15–21]. The affine deformation assumption allows evaluating the strain energy function from which the multiaxial mechanical behavior can be inferred. This procedure may take into account any fiber orientation distribution in the undeformed state and predicts fiber re-orientation driven by the macroscopic imposed kinematics. The essential advantage of this method is that it leads to closed-form solutions, which are easy to implement in continuum formulations.
The affine assumption is adequate when the network is embedded in a solid matrix or at large fiber densities. Many works discussed the affine assumption in both the physics [22–27] and biomechanics literature [28–31], and concluded that fiber networks of realistic density and fiber properties deform in a highly nonaffine way. Since no general theory exists that can predict the nonaffine deformation of a random structure of given global stochastic parameters, the structure–properties relations have to be established by large-scale numerical models of networks [32–34]. Such models represent a three-dimensional (3D) structure of fibers connected at cross-links. The fibers deform cooperatively and nonaffinely. The mechanical behavior of such models has been shown to share some characteristics with biological soft tissue. Their advantage stems from the fact that they represent the network microstructure. They can be used to investigate the structure–properties relationship and to identify mechanisms operating at scales not accessible to experiments, or provide information about quantities (e.g., energy storage and spatial distribution) that cannot be directly measured. The disadvantage is that their predictions are not reducible to simple analytic formulations and, in order to connect network models to the larger scales, computationally expensive multiscale formulations have to be used [35,36].
The goal of this paper is to compare the behavior of a specific type of network model with that of a series of soft tissues and reconstructed collagen gels, and to provide a mechanistic perspective on the origins of the large Poisson's effect and strong fiber orientation observed. The Poisson's effect is associated with fiber orientation in the stretch direction (under uniaxial tensile loading), which occurs due to the large free volume of the network. The incremental Poisson's ratio decreases at large strains due to the confining effect of fibers not engaged in carrying the axial load. We also analyze the effect of fiber tortuosity and show that although the stress–stretch curves for materials with various levels of tortuosity are very different, a unifying perspective can be found, which allows collapsing data from various such systems. A similar perspective is taken when comparing the behavior under uniaxial and biaxial tension. These results demonstrate that many of the features observed experimentally are reproduced by fiber network models. Therefore, such models can be used to advance the understanding of tissue mechanics and to assist the design of tissue scaffolds and tissue equivalents.
2. Models and Methods
2.1. Network Models.
In these models, fibers represent collagen fibrils and are connected in a 3D structure, which percolates the problem domain. Fibers may be randomly oriented in space or may have preferential orientation. They are connected at nodes, with the connectivity number, z, representing the number of fibers emerging from each cross-link, and are not allowed to bundle since adhesion or chemical interaction are not represented in the model. Generally, fibers have identical diameter and material properties, although composite networks made from fibers of different properties have been considered in the literature [37,38]. The essential network parameters are
-
(a)
The density, , which represents the total length of fiber per unit volume of network. For networks made from a single type of fiber, the density is related to the volume fraction occupied by fibers, , and to the mass density of the material, , as , where is the density of the fiber material and is the fiber cross section area.
-
(b)
The average connectivity, , and the density of cross-links, , which represents the number of cross-links per unit volume. and are related to as /2, where is the mean fiber length between two cross-links (mean segment length). Independent geometric evaluation of indicates an inverse relationship between and [39] in certain types of networks (e.g., Mikado and Voronoi networks).
-
(c)
Fiber properties, including the axial and bending fiber rigidities, and , where is Young's modulus of the fiber and I is the axial moment of inertia of the cross section. Fibers are considered of circular cross section. For networks made from a single type of fiber, it was shown that a single parameter that combines the two rigidities is essential: [22,23,26].
It is notable that the torsional rigidity of fibers is not an important parameter, which is a consequence of the fact that the deformation of random networks is dominated by the axial and bending modes, while fiber torsional strain energy is minimal.
A large number of configurations can be generated for any given set of the above parameters. This degeneracy originates from two sources: (i) the method used to generate the network defines the network “architecture” and different methods lead to structures of different type; (ii) many configurations can be generated for each architecture, i.e., using the same generation method. The second source of structural variability leads to a size effect well known in random composites, effect which can be mitigated by considering models large enough to average out the variability. In the context of random fiber networks, the size of the model that provides replica-independent material properties depends on the parameters listed above [40], but is finite. The more important issue of the effect of the network architecture on mechanical behavior has been discussed to some extent [41]. It is generally accepted at this time that networks with different architecture lead to similar mechanical behavior but given behavior can be reproduced with different architecture only upon an (often significant) adjustment of the key network parameters. Based on this observation and considering the previous models developed for collagen networks [42,43], we choose to work with Voronoi networks in this study.
The models are generated using an in-house developed Voronoi tessellation algorithm implemented in Matlab. A set of randomly distributed seed points are generated inside a cubic domain of size L and are used to generate a Voronoi tessellation. Fibers are defined along all edges of the resulting tessellation, which results in an interconnected fiber network. The connectivity number is z = 4. The model size, L, is taken large enough to eliminate size effects and minimize the variability from replica to replica. All reported results are averaged over three replicas of the system. The network density, , is adjusted by controlling the density of seeds used to generate the Voronoi tessellation of the domain.
Collagen organizes in fibrils of diameter in the range 100–500 nm [44,45]. The tropocollagen molecules are arranged largely parallel to the fibril axis and are staggered, with the stagger creating the characteristic D-banding repeat unit of gap–overlap regions with periodicity of 67 nm. Fibrils bundle to create fibers of diameter larger than 1 μm. The degree of bundling depends on tissue type, on pH, and the temperature at which the network is created (in reconstructed collagen gels) [46,47]. In biological structures, fibers have different degree of bundling and hence different effective diameter. In the present models, we consider fibers of same diameter, equal to 0.1 μm.
Two collagen concentrations are considered, c = 1 mg/ml and 4 mg/ml, in separate models. For the fiber diameter selected, these correspond to network volume fractions = 0.076% and 0.306%, and network density 0.097 and 0.39 , respectively. The resulting mean segment length is 3.3 and 1.5 for the two concentrations. These are in agreement with the values reported in Refs. [48–50] measured from scanning electron microscopy images of reconstructed collagen networks and values used in other models inspired from direct observations of the network [32,51]. Overall, the network parameters used here are also in agreement with those used in a two-dimensional discrete network model parametrized based on direct microscopic observations of the human amnion structure [52].
The models considered are athermal, i.e., thermal fluctuations do not influence fiber mechanics significantly. This is adequate for fibers of such large diameter and persistence length larger than 1 mm, as reported for fibrils [53,54]. Fibers are represented as beams of circular cross section with axial, bending, torsional, and shear stiffness (the Timoshenko model for beams) [55]. Accounting for the bending stiffness of the fibers is important both because collagen fibers have nonzero bending stiffness (directly measured in Ref. [56]) and because the network would be unstable in the initial configuration if fibers would carry only axial forces. The issue of network stability is often disregarded in microscale models of biological tissue. However, according to Maxwell's criterion [57], 3D structures of fibers with only axial stiffness are unstable if the average connectivity number of the network is smaller than 6. With between 3 and 4 (close to 4), as measured from collagen network images [48,50], and in our models, the structure is subisostatic and has zero stiffness in the unloaded state. The use of subisostatic structures as models for collagen networks is considered acceptable in some works because such structures develop finite stiffness when stretched beyond a critical strain [58,59]. This mimics the experimentally observed toe region of the stress–strain curves, but may lead to errors in kinematics when simulating the heel region. Such errors emerge from the fact that fibers in 3D networks with parameters in the range relevant for collagen deform mainly in the bending mode over the entire physiologically important strain range, as discussed in the literature [26,60].
In the undeformed configuration, fiber segments bounded by two cross-links are straight. The effect of fiber tortuosity is studied with separate models in which fibers are constructed as arcs of circle representing nonzero crimp in the initial configuration. The crimped models retain a nonvanishing (although small) stiffness in the initial configuration associated primarily with the fiber bending stiffness. This insures overall network stability. The tortuosity, τ, i.e., the ratio of the contour length to the end-to-end length of a segment, measured in various tissues and in reconstructed collagen gels varies from 1.1 to 1.4 [48,61,62]. We consider the tortuosity to be 1.15 and 1.3, in separate models. Crimp is introduced in all fibers of the model such that to insure that all fibers have the same tortuosity parameter.
Fiber properties are of central importance for model development. A review of collagen properties on the fibril, fiber, and fascicle level is provided in Ref. [62]. Stiffness generally decreases from GPa level on the molecular scale (estimated by atomistic simulations [63]), to hundreds of MPa for fibrils, and tens to hundreds of MPa for collagen fibers (somewhat overlapping with fibril range). Bending experiments performed with single fibrils indicate Young's modulus in the 100–360 MPa range [56]. Uniaxial stretching performed with micro-electromechanical systems devices led to modulus values 500–900 MPa [64] and 2 GPa [65]. In the present models, we consider , in agreement with Ref. [52].
Fibers are considered linear elastic. Keeping the constitutive behavior of fibers linear allows emphasizing the effect of geometric nonlinearity in the overall network behavior. As discussed below, the essential features observed in experiments can be reproduced with models in which fibers are linear elastic. Constitutive nonlinearity is expected to have a secondary effect on some aspects of the material response. While most single fibril test results indicate a nonlinear tensile behavior, at small strains, the response can be considered linear. For example, in Ref. [64], the stress–strain curve of a single fibril stiffens significantly for strains larger than 30%, but at strains below 10% it is linear. The response reported in Ref. [65] is also linear up to 4% strain (the upper limit of the reported range) except for a toe regime, which extends up to 1%. In these reports, the nonlinearity is of strain-stiffening type. Strain softening experimental stress–strain curves have also been reported [66,67].
Representative examples of the three main types of models considered in this study—models with randomly oriented fibers, with preferentially oriented fibers and with randomly oriented but tortuous fibers—are shown in Fig. 1. The models are discretized with finite elements, each fiber being represented with several Timoshenko beam elements. Uniaxial or biaxial loads are applied via displacement boundary conditions. The surfaces of the cubic models, which are not subjected to imposed displacements, are kept planar, but allowed to relax in the direction of their normal, under zero tractions. The solution is found using the general purpose finite element solver Abaqus, version 6.14.
Fig. 1.
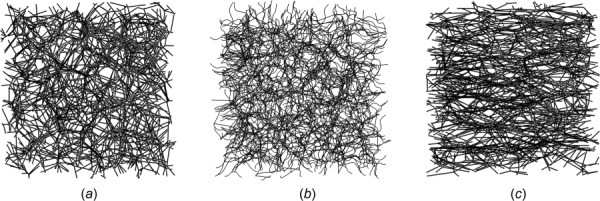
Realizations of models with (a) randomly oriented straight fibers, (b) randomly oriented tortuous fibers, and (c) preferentially oriented straight fibers
2.2. Definition of Parameters.
The stress and strain measures used in this work are the first Piola–Kirchhoff stress (or the nominal stress), S, and the deformation gradient tensor, F, which are work conjugates. The Cauchy stress, σ, can be obtained from S as , where is the Jacobian of the transformation. The Cauchy stress is the physically more representative quantity, but it is usually difficult to measure in experiments since the current cross-sectional area of a soft specimen is hard to be measured in situ. It should be noted that using the true stress–true strain measures are inadequate for network-based materials since the conversion from the nominal stress to the true stress requires the assumption of isochoric deformation, which does not apply to this class of materials.
The models are deformed via imposed displacements either uniaxially or biaxially. The uniaxial deformation is applied in the x1 direction. Fibers are randomly oriented in space and the structure is isotropic in the initial configuration, or is pre-oriented in the x1 direction, in separate models. The pre-oriented samples are transversely isotropic in the initial configuration, with x1 being the axis of transverse isotropy. All samples acquire transverse isotropy during uniaxial deformation. In the biaxial deformation case, loading is applied in the x1 − x2 plane and the model is free to contract in the x3 direction.
Fiber orientation is evaluated using the orientation tensor. Only the first component of the tensor is relevant here (Herman orientation factor) and hence we refer to the orientation index as a scalar parameter defined in 3D by
| (1) |
where θ is the angle made by the fiber end-to-end vector with the x1 axis (loading direction), and represents the ensemble average. In 2D, this quantity reads
| (2) |
Both parameters are 0 for randomly oriented fibers and reach a maximum value of 1 when the fibers are fully aligned with the x1 direction. Their minimum value is −0.5 in 3D and −1 in 2D, both corresponding to perfect alignment in the plane perpendicular to the x1 direction.
Samples are three-dimensional in all cases. The 2D quantity is useful here in order to make the connection with experimental observations. For thin samples, the orientation is usually measured relative to the loading direction in the plane of the membrane. Hence, even though the fibers re-arrange in 3D, only the deformation-induced orientation of the projection of the fiber in the x1 − x2 plane is measured. A similar situation is encountered when working with experimental orientation data for 3D samples. In this case, fibers orient in 3D, but the process is monitored in the 2D projection.
Consider a 3D sample loaded uniaxially in the x1 direction, for which the orientation is measured on one of the lateral surfaces (x1 − x2 or x1 − x3). The relation between the true 3D orientation and the measured orientation in the 2D projection for this axisymmetric deformation case is discussed in the Appendix. is different from , the difference being smaller than 20%.
The Poisson's effect is evaluated using the incremental Poisson's ratio given by
| (3) |
which can be interpreted as the incremental Poisson's ratio computed based on the logarithmic strains in the loading and transverse directions. Here, is the stretch ratio in the x1 direction and , for uniaxial loading. This measure becomes the usual Poisson's ratio at small strains when the logarithmic strain can be approximated with the small strain. However, it remains a conventional measure of the Poisson's effect at large strains.
It is interesting to note that if the lateral stretch, , is considered a function of the axial strain, , , Eq. (3) implies and, if can be considered a constant of over any small portion of the loading history, it implies .
2.3. Overview of the Experimental Data Sets Used.
Three data sets from the literature are used to compare with numerical data: results for reconstructed type I collagen gels from Ref. [68], data for the deformation of mouse skin from Ref. [11], and results from experiments performed with human amnion [9]. A brief account of the experimental conditions is presented here for completeness.
Reference [68] reports results from mechanical tests performed with reconstructed collagen gels at a concentration of 1.5 mg/ml. The gel solution was cast in dog-bone specimens of cross section dimensions 8 × 3 mm in the gauge region. The network has mean segment length and connectivity , as observed from SEM images. Hence, the cross-sectional dimensions are much larger than the characteristic length of the network. Samples were tested in uniaxial tension, and relaxation was performed at various levels of the applied load. Two values of the stress are reported corresponding to each relaxation stage: the peak stress and the stress at the end of the relaxation period (300 s), which is considered the equilibrium stress at the respective strain. Here, we use the equilibrium stress–stretch data. The Poisson's contraction was measured in both directions perpendicular to the loading axis, and it was concluded that the Poisson's effect is identical in the two directions. This indicates that the initial microstructure is isotropic and remains transversely isotropic relative to the loading direction throughout the test.
Reference [11] reports results from uniaxial tension tests performed with mouse skin. Samples were collected from the back of the animals, and the epidermis was separated from the dermis, which was further used in the experiments. Deformation was measured globally as well as locally (i.e., at the scale of ∼300 μm). The local evaluation was made based on the relative motion of hair follicles. The applied force is directly measured and the nominal stress computed as the force divided by the initial area of the cross section (approximately 8 × 1 mm2) is reported. Tests are performed with a low strain rate of . The Poisson's contraction is reported in the plane of the sample. Collagen orientation was measured using a multiphoton microscope with a spatial resolution of 0.5 μm. Image stacks with in-plane dimensions of 480 × 480 μm2 and depth of 50 μm were recorded. The orientation index reported is identical to of Eq. (2).
Tests on human amnion samples are reported in Ref. [9]. The fetal membrane is composed from the amnion and the chorion, with the two components being in contact with the amniotic fluid and the maternal tissue, respectively. The amnion, which is a collagen network of thickness 60–100 μm, is primarily responsible for the mechanical function. In these experiments, the amnion was separated from the chorion, sectioned, and tested in uniaxial tension. The deformation is characterized by the global (grip-to-grip) applied strain and the local strain, which was evaluated by tracking the relative motion of stained nuclei of cells that form the amniotic epithelium—a layer of cells anchored to the collagen network. The Poisson's contraction was measured both in the plane of the membrane and in the thickness direction. The collagen network has fibers of diameter approximately 50 nm, which may bundle into thicker fibers, and which are randomly oriented in the unloaded state. Strong alignment results upon loading. The degree of alignment is evaluated using multiphoton microscopy based on second harmonic generation. Special attention is paid in Ref. [9] to the selection of the reference state for the test, and the importance of this choice for data interpretation is discussed. Interestingly, the uniaxial stretch at which the load cell signal emerges from the noise is above 1.1 and substantial lateral contraction and collagen orientation are measured at this stage. The additional Poisson's contraction corresponding to larger loads is larger than that observed between the initial and reference states, but the collagen orientation increases weakly beyond the reference state. Due to this reason, we are not able to use the orientation data in Ref. [9] in the current analysis.
3. Results and Discussion
3.1. Uniaxial Tensile Behavior and the Effect of Fiber Tortuosity
3.1.1. Generic Network Behavior.
As broadly discussed in the literature, the stress–strain curve measured for various types of tissue has three regimes: a toe regime characterized by very small stress values, but in which fiber kinematics is observed [9], a heel regime described by an exponential functional form, and a linear regime at large stresses. Under normal physiological conditions, most tissue functions within the toe and heel regimes. Fiber network models generally reproduce this type of behavior. An example is given in Fig. 2(a), which shows the stress–strain curves for models with collagen concentration c = 1 mg/ml and 4 mg/ml. The three regimes that correspond to the toe, heel, and linear experimental regimes are indicated in the figure.
Fig. 2.
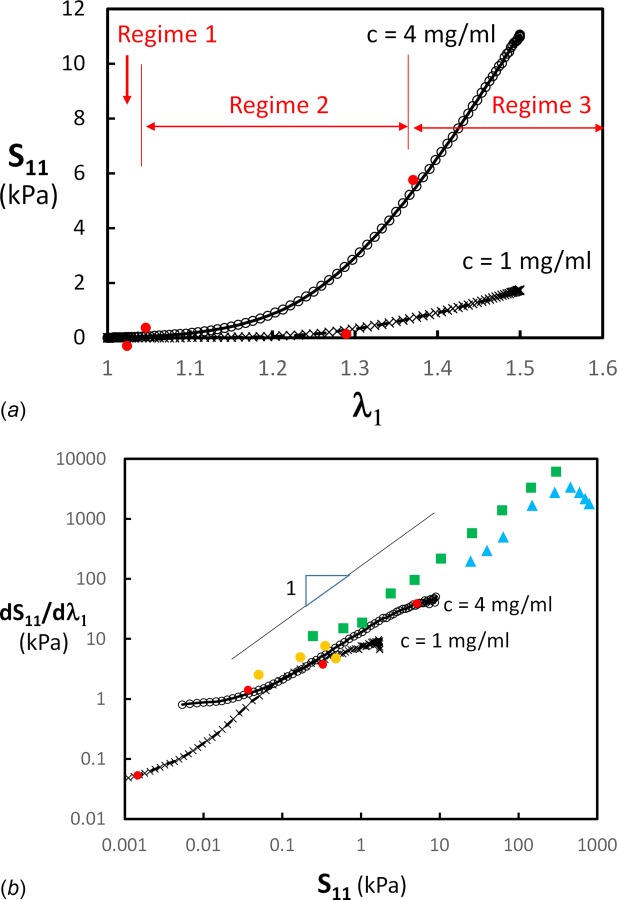
(a) Nominal stress–stretch curves for networks of density equivalent to collagen concentration of c = 1 mg/ml and c = 4 mg/ml. The three regimes discussed in text are indicated by vertical bars and red filled circles. (b) Data in (a) replotted as tangent stiffness versus stress. The red filled circles indicate the transition between the regimes indicated in (a). The figure includes experimental data for reconstructed collagen gels (orange circles) [68], human amnion (green squares) [9], and mouse skin dermis (blue triangles) [11].
Figure 2(b) shows the data in Fig. 2(a) replotted as tangent stiffness versus stress. The figure shows typical sigmoidal curves with the three regimes becoming obvious. The approximate transition between regimes 1 and 2 and between regimes 2 and 3 is marked by red symbols (corresponding to those defined in Fig. 2(a)). The network has a linear elastic behavior in regime 1, with the effective modulus, E0, being strain-independent. Stress values are very small and it can be thought that this regime is irrelevant for tissue mechanics. In models of purely axial elements in which the bending of fibers is ignored, the stiffness in regime 1 is zero since such models are not stable at small stretches. The most relevant part of the stress–stretch curve is regime 2 in which the tangent stiffness is proportional to the stress and therefore the stress–stretch relation is exponential. Regime 3, in which the curves bend back to the horizontal indicating that the stress–stretch curves become again linear, is reached at larger stress values. Failure may occur in biological networks before this transition. This would lead to an early reduction of the tangent modulus and the partial or complete elimination of regime 3, as observed in some experiments [48]. A similar behavior can be caused by the nonlinear deformation of fibrils [64–66] at large loads.
Figure 2(b) includes data from Refs. [9], [11], and [68]. Regime 1 is not visible in any of these data sets, probably due to truncation introduced in postprocessing or due to the limited resolution of the load cells. The tangent modulus is proportional to the stress in all data sets, which is characteristic for regime 2. Two of the data sets show a reduction of the stiffness at large stress values, likely due to the onset of damage [11].
It is generally indicated in the literature that the final linear regime is associated with the full orientation of the fibers in the loading direction. Both models and experiments in which collagen orientation is measured indicate that even at large strains, the fibers are not fully oriented. The transition from regime 2 to regime 3 is controlled by the formation of a subnetwork of strongly aligned fibers that carries most of the load, while the remaining fibers are less oriented [69]. The tangent modulus in regime 3 is controlled by the structure and density of this subnetwork.
A discussion is required at this point regarding the general statement that the stress–strain curve is exponential. This has to be made specific by indicating which stress and deformation measures are observed to be exponentially related. Figure 2(b) shows the first Piola–Kirchhoff stress, S, versus stretch, λ1. In the literature, the respective statement is made when using the pair Cauchy stress, T, and the small strain, ε, [60], and the second Piola–Kirchhoff stress, Π, and the Green strain, E. It is clear that not all these groups of stress and deformation measures can be simultaneously exponentially related. Assuming that in a uniaxial experiment it is observed that , then and , which implies that and . While for small strains, the relation between and cannot be approximated with an exponential.
Interestingly, these models are able to capture the strongly nonlinear behavior of tissue. However, the nonlinearity here is purely geometric as fibers have linear elastic constitutive behavior. Therefore, it is possible to infer that fiber convection in the direction of the principal load is responsible for the exponential material behavior of the heel regime (regime 2).
It is important to point to the fact that models of this type are not aimed at reproducing exactly the microstructure of the network. Real collagen networks are not necessarily of Voronoi type. Fibers in the model are all of identical diameter and mechanical properties, which is certainly not the case in tissue. However, these discrepancies may affect the prediction of the stress values, but not the trends and general behavior. This insensitivity of the global mechanical behavior to the network architecture [27,41], which is most likely due to the stochastic nature of these structures, is actually a major advantage of the type of models used here.
3.1.2. Effect of Fiber Tortuosity.
The effect of collagen tortuosity on the stress–strain curve has been discussed in the literature [2,62,70]. It is observed that increasing the contour length of the fiber at constant end-to-end distance increases the range of the toe regime. However, the stress–strain curves obtained from networks with different tortuosity cannot be overlapped by a simple translation along the strain (or stretch) axis. In Ref. [2], which reports experiments on rat tail collagen fascicles, it is shown that fiber tortuosity is eliminated by a global strain of 3%; this strain corresponds to the middle range of the exponential regime 2 in these experiments. In Refs. [71] and [72], it is reported that tortuosity is eliminated by 4% strain. Therefore, the elimination of tortuosity cannot be associated with the end of regime 1, rather fiber alignment and fiber straightening occur simultaneously.
Here, we perform simulations with two values of the tortuosity parameter, τ = 1.15 and 1.3, defined as the ratio of the contour length of the fiber to its end-to-end vector length. The resulting curves depend strongly on the value of τ, with the stress level decreasing markedly with increasing τ. However, these differences are eliminated when the data are represented as tangent stiffness versus stress (Fig. 3). In Fig. 3, the vertical axis is normalized by the network modulus corresponding to infinitesimal strains, E0; this leads to the overlap of the curves. The value of E0 depends on the magnitude of τ and on the fraction of the fibers in the network, which are not straight. The relation between E0 and these structural parameters is discussed in Ref. [73].
Fig. 3.
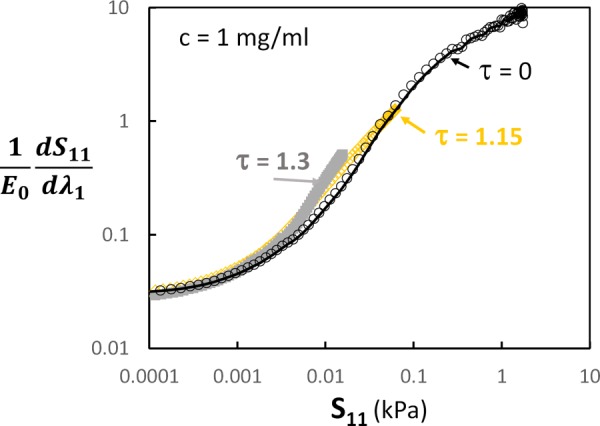
Tangent stiffness versus stress for models with tortuosity parameter τ = 0 (reproduced from Fig. 2(b)), τ = 1.15 and τ = 1.3. The vertical axis is normalized by the small strain modulus of regime 1, E0.
The data in Fig. 3 indicate that in the experimentally relevant regime 2
| (4) |
where is a function of the small strain network modulus , which in turn depends on the modulus of the fiber material, , and the structural parameters mentioned above.
3.2. Poisson's Effect and Collagen Orientation.
Further insight into the mechanisms leading to the behavior discussed in Sec. 3.1 can be obtained by analyzing the Poisson's effect and the associated orientation of the collagen during stretch. Tissue exhibits very large Poisson's ratios, with values much larger than 0.5, which corresponds to the incompressible continuum case and is the upper limit of the Poisson's ratio for 3D continua. Fiber networks are not continua and hence can exhibit a stronger Poisson's effect.
Figure 4 shows the variation of the incremental Poisson's ratio, , of Eq. (3) with the stretch ratio for network densities corresponding to c = 1 and 4 mg/ml. The transition between regimes 1 and 2 and between regimes 2 and 3 is indicated with red filled squares. The values of the incremental ratio are very large and increase fast during deformation. The initial values of , during regime 1, are below 0.5 and weakly dependent on . increases fast during regime 2 and reaches a plateau when the network enters regime 3. This indicates that the pronounced Poisson's effect is associated with fiber convection which, as discussed in Sec. 3.1, also leads to the exponential stress–stretch curve. The figure includes data from Refs. [9], [11], and [68], which exhibit a variation similar to that of the network models. The data sets from different experiments are shifted in the horizontal direction likely due to the different definition of the reference state. The rate of increase of the incremental Poisson's ratio with is identical in all data sets and all curves appear to reach a plateau at the largest values. The gradual increase at small seen in the simulation data corresponds to regime 1 and is not seen in the experimental data due to the truncation of the toe.
Fig. 4.
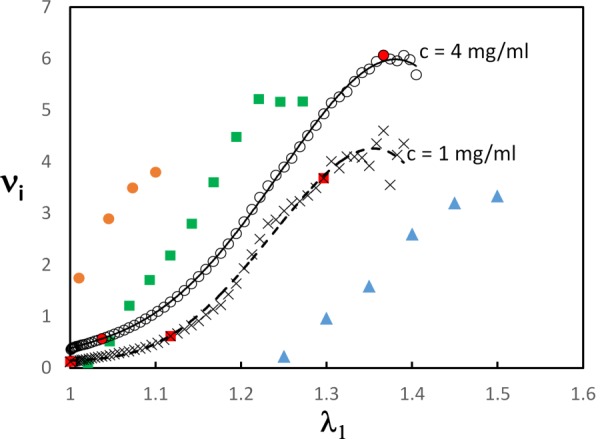
Variation of the incremental Poisson's ratio with the stretch ratio for models with c = 1 and 4 mg/ml. The red filled squares mark the transition between the regimes indicated in Fig. 2(a). The figure includes experimental data for reconstructed collagen gels (orange circles) [68], human amnion (green squares) [9], and mouse skin (blue triangles) [11].
The variation of the 3D orientation index P2 (Eq. (1)) during deformation is shown in Fig. 5. Network density has a weak effect on kinematics in this concentration range. P2 increases fast during regime 2 and the rate of preferential orientation decreases when regime 3 is reached. Experimental data (in-plane, ) from Ref. [11] are also shown.
Fig. 5.
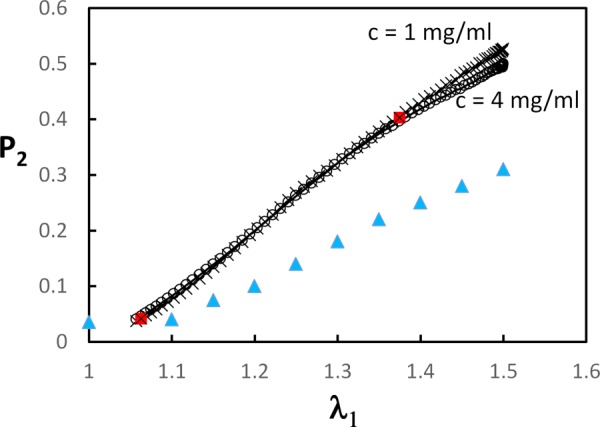
Variation of the 3D orientation index with the stretch ratio for networks with c = 1 and 4 mg/ml. The red filled squares indicate the transition between regimes indicated in Fig. 2(a). The figure includes the 2D orientation index for mouse skin (blue triangles) [11].
These results indicate that the large and strain-dependent Poisson's effect is associated with the strong fiber realignment during deformation. Figure 6 shows an almost linear relation between the incremental Poisson's ratio, , and P2 during regime 2. In regime 3, orientation continues to a smaller extent while levels off.
Fig. 6.
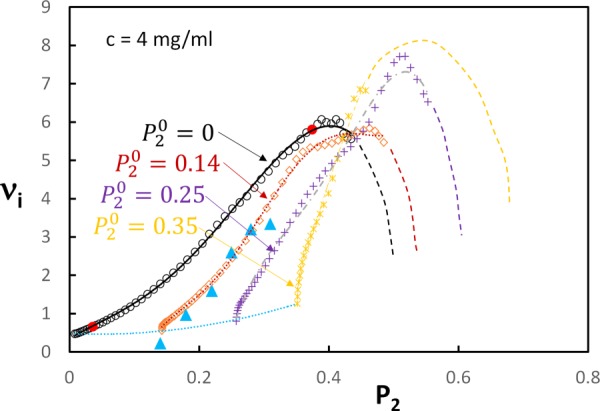
Relationship between the incremental Poisson's ratio and the orientation index for models with c = 4 mg/ml and various levels of pre-alignment in the initial, unloaded configuration (). The red dots on the curve indicate the bounds of regime 2. The dotted blue line shows the variation of the small strain Poisson's ratio with the degree of pre-alignment. The blue triangles represent the measured in-plane incremental Poisson's ratio for a pre-aligned sample of mouse skin [11]. The curves corresponding to the four values of are shown with both markers and lines to emphasize the trends.
In order to gain additional insight into the relationship, models with preferential fiber alignment in the initial, undeformed state are considered. Alignment is introduced during network generation, axisymmetrically with respect to and in the direction of the x1 axis. This mimics the orientation resulting from the uniaxial tensile test performed with initially unoriented networks. The initial orientation is characterized by an initial value. The models are then deformed uniaxially by stretching in the x1 direction. The difference between a preoriented sample with and a deformed sample of in the initial configuration and in the current configuration is that the preoriented sample has no internal stress.
Data from these simulations are shown in Fig. 6. The initial Poisson's ratio of oriented models increases with the degree of orientation, as shown by the dotted blue line. This effect is rather weak compared to the strong increase of during regime 2. It is observed that in preoriented samples, increases very fast without a significant variation of in the initial stages of deformation. Subsequently, all curves reach a maximum, followed by a decrease of . The decreasing trend is shown by dashed lines due to the large numerical noise in the respective regime. Experimental data from Ref. [11] included in Fig. 6 correspond to a sample with pre-aligned collagen. Good agreement with the numerical results is again observed.
The interpretation of this behavior is as follows: fiber convection in the stretch direction is opposed by the resistance of fibers oriented roughly perpendicular to the stretch direction and which need to deform significantly to allow continued convection. This resistance increases nonlinearly and eventually stops the alignment process, leading to a rapid decrease of . Structures randomly oriented in the initial configuration experience the effect of this lateral constraint at smaller values of the total , but at approximately the same value of , compared with the pre-aligned samples.
Although the decrease of with increasing is not observed in the three experimental datasets used, the plateau preceding this regime is manifest. It is likely that this is due to the onset of failure in the experimental samples (note that the plateau in the and curves is associated with regime 3). Fiber or cross-link failure leads to an increase of the sample volume at given stretch and an associated increase of its transverse dimensions, i.e., a reduction of . Since the discussion of failure is beyond the objective of the present discussion, we do not dwell further into this issue.
The correlation between the Poisson's effect and fiber alignment is supported by experimental data on cartilage. Collagen is oriented parallel to the surface in the outer layers of the tissue and is more randomly oriented in the midthickness region [6,74–76]. This causes a stronger Poisson's effect (3–4 times larger Poisson's ratio) in samples harvested from the surface layer and oriented parallel to the surface, compared to samples taken from the central layer of cartilage [77,78]. The stiffness in the toe region is also larger for surface samples compared to samples harvested from the midthickness range [77,79] and the stiffening rate is also larger for the preferentially aligned sample [79]; this is in agreement with model predictions.
The effect of fiber tortuosity on the relation is shown in Fig. 7. Data for samples with and 1.3 are shown together with the corresponding curve for = 0 from Fig. 6. Interestingly, although the stress–stretch curves for these systems are very different, the relation between the incremental Poisson's ratio and the orientation index is almost identical. This indicates that the mechanism controlling the Poisson's effect is linked to the convection of fibers and tortuosity influences both measures to similar extent.
Fig. 7.
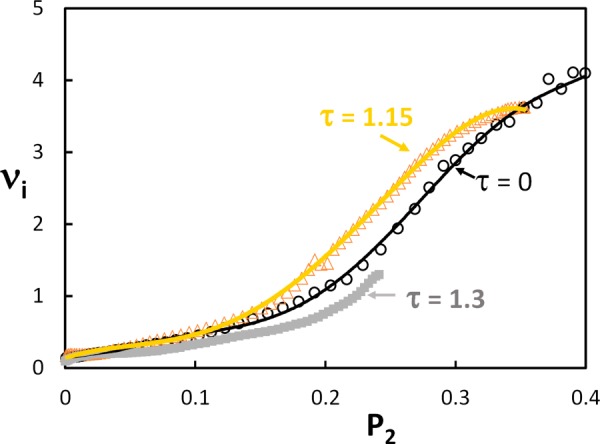
Relationship between the incremental Poisson's ratio and the orientation index for models with c = 1 mg/ml and various levels of tortuosity. The orientation index is evaluated based on the end-to-end vectors of the crimped fibers.
increases monotonically during stretching, but the rate at which it increases is not constant. increases at the beginning of the deformation, reaches a maximum, and then decreases. This trend is also visible in the experimental data included in Fig. 5 [11]. Figure 8 shows the variation of with for models of density c = 1 and 4 mg/ml. A broad peak is visible, centered on . Models offer the opportunity to relate this feature to the details of fiber deformation, providing deeper insight into the origins of this system-scale feature. The numerical data are post-processed to identify the dominant mode of strain energy storage. The deformation of these networks is strongly dominated by the bending mode at small strains. This is related to the network density and parameter lb, as discussed for example in Ref. [55]. As the deformation proceeds, the fraction of strain energy stored in the bending mode decreases and the energy stored in the axial mode increases. The contribution of the shear and torsional modes to the total strain energy is negligible. The axial mode becomes dominant beyond a stretch in the range to 1.3, which correlates with the stretch at which the peak of is observed.
Fig. 8.
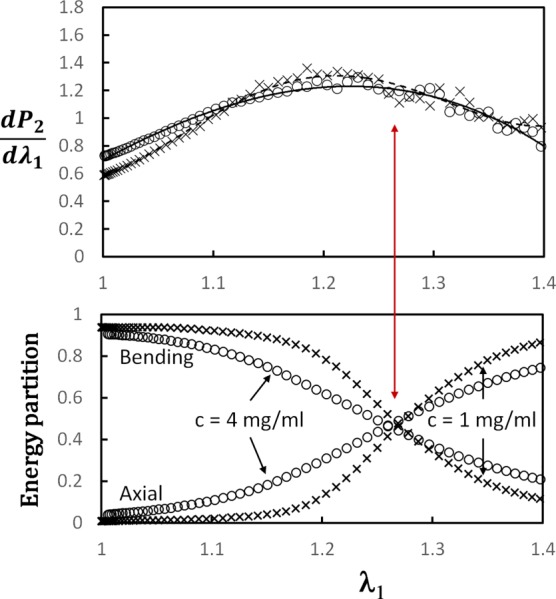
Variation of the incremental orientation index, , for models with collagen concentration c = 1 mg/ml (crosses) and c = 4 mg/ml (open circles), along with the energy partition for the same models and loading history. The energy stored in the bending and axial modes is shown. The contribution of the shear and torsional modes is smaller than 10% in all cases and is not shown. The transition from the bending-dominated state at small stretches to the axial dominance observed at large stretches (crossing of curves in the lower figure) corresponds to the peak in the incremental (shown by the red arrow).
Further support for this observation is provided by the pre-aligned models. The partition of the strain energy in these models is shown in Fig. 9 together with the variation of with the stretch . The pre-aligned networks are still bending dominated at small deformations, but switch to the axial mode at smaller stretch values. The peak of the curve shifts also, reinforcing the relationship shown in Fig. 8. This correlation indicates that fiber orientation toward the tensile loading direction slows down when the network becomes axially dominated. This happens roughly in the middle range of regime 2. Regime 3 is entered when no further alignment is possible due to the constraining effect of strongly bent fibers oriented roughly orthogonal to the loading direction (Fig. 6).
Fig. 9.
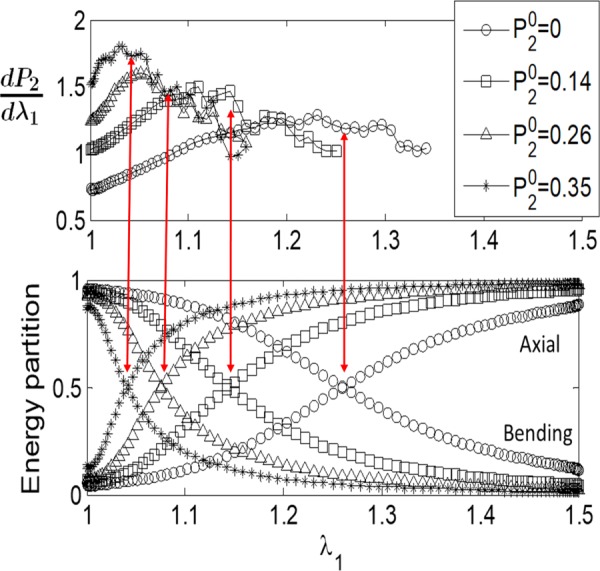
Variation of the incremental orientation index, , for models with collagen concentration c = 4 mg/ml and various levels of pre-alignment, along with the energy partition for the same models and loading history. Only the energy stored in thebending and axial modes is shown. The transitions from the bending-dominated state at small stretches to the axial dominance observed at large stretches (crossings in the lower figure) correspond to the peaks in the incremental , as indicated by the red arrows.
It is instructive to compare the evolution of fiber alignment during stretch with the prediction of the affine model. In the affine description, each fiber moves with the applied macro-deformation. Specifically, a fiber end-to-end vector in the undeformed configuration becomes in the deformed configuration, with being the deformation gradient tensor. For the uniaxial deformation considered here, is diagonal with diagonal entries , . Considering the initial distribution of fiber directions to be uniform, the value of can be computed in terms of . This affine prediction is shown in Fig. 10. The figure includes the variation of with for models with random initial orientation of fibers and c = 1 and 4 mg/ml, as well as experimental data from Ref. [11] for mouse dermis. It is seen that both models and experimental data exhibit stronger fiber orientation compared with the affine prediction at the beginning of the deformation ( close to 1), and much weaker alignment than the affine prediction at larger values.
Fig. 10.
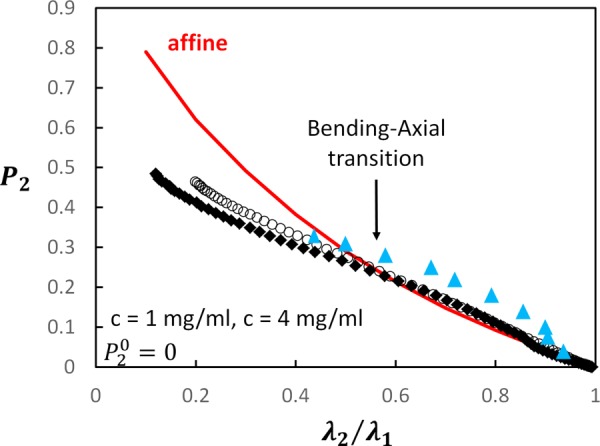
Comparison of the affine model prediction (continuous red line), calculated (c = 1 mg/ml (filled diamonds) and c = 4 mg/ml (open circles)), and experimental (blue triangles, [11]) variation of the orientation index with the ratio
Interestingly, the value of at which the model data cross the affine line corresponds to the peak of the in Fig. 9 and to the transition from bending to axial energy storage dominance (Figs. 8 and 9). This point is indicated in Fig. 10 by an arrow and is hence labeled “bending to axial transition.” The cross-over for the experimental data takes place at approximately the same value of .
The results in Fig. 10 also indicate that deformation is nonaffine. It is broadly acknowledged in the literature that networks of relatively small density and/or small lb deform nonaffinely even in the small strains range, while the level of nonaffinity decreases as the density and/or the bending stiffness of fibers (i.e., lb) increase [26,27]. This transition from nonaffine to affine at small strains is associated with a transition from bending to axial energy storage. The transition from bending to axial dominance discussed here is induced by the deformation (at given network parameters); however, the deformation remains nonaffine at all strain levels, in both bending and axial dominated regimes.
Support for the fact that deformation is nonaffine in biological collagen networks exists in the literature. It is reported [80] that the deformation of individual collagen fibrils is significantly smaller than that applied macroscopically, while Ref. [81] indicates that strain is heterogeneous at the scale of the fibrils.
3.3. Biaxial Tensile Behavior.
Since tissue is also loaded biaxially, it is of interest to compare the uniaxial and biaxial model behavior and to qualitatively compare with experimental data.
In biaxial loading, the same stretch, , is applied in the “in-plane” directions and the sample is free to contract in the third direction, x3. If the sample is transversely isotropic relative to the x3 direction, the resulting in-plane stresses, and , are equal, while . Fibers align in the x1 − x2 plane and hence the 2D orientation index evaluated for projections in planes x1 − x3 and x2 − x3 and relative to the respective stretch direction increases during deformation. evaluated in the x1 − x2 plane remains close to zero.
Figure 11(a) shows the stress–stretch curves for the system with c = 4 mg/ml, with random initial fiber orientations and subjected to uniaxial and biaxial loading. Stiffening is much more pronounced in biaxial loading. Also, the stretch at which the transition between regimes 1 and 2 is observed is smaller in biaxial loading. These results are in line with experimental observations. Chen et al. [82] report results for biaxial deformation of porcine pulmonary ligament, with various values of the in-plane stretch ratios. As the deformation becomes more biaxial (ratio of in-plane stretches increases toward 1), the stress–stretch curve becomes stiffer and the transition from the toe to heel regimes shifts to smaller stretch values.
Fig. 11.
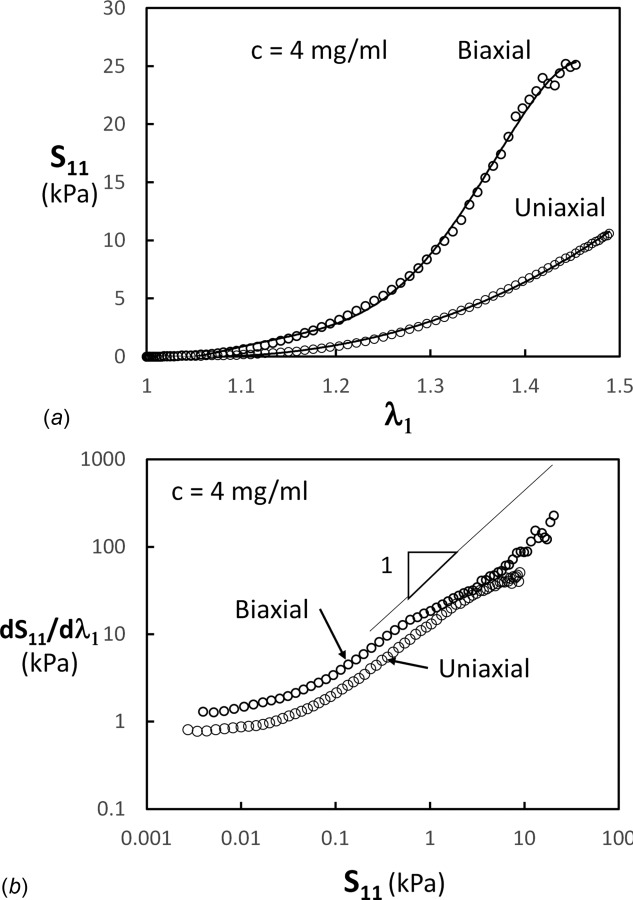
(a) Nominal stress–stretch curves for networks subjected to uniaxial (from Fig. 2(a)) and biaxial loading. (b) Data in (a) replotted as tangent stiffness versus stress.
Despite this strong effect, the corresponding tangent moduli versus stress curves are almost identical (Fig. 11(b)). The three regimes are well defined and occur in the same stress range. The slope of the curve in regime 2 is equal to 1, indicating an exponential dependence of the nominal stress on the stretch ratio.
The agreement seen in Fig. 11(b) is a consequence of the fact that mechanics is identical in the two tests, except for the fact that Poisson's contraction in the unloaded direction (x3) is more pronounced in the biaxial than in the uniaxial case. This is shown in Fig. 12 where the data in Fig. 11(a) are replotted as force per unit edge length of the sample (or Cauchy stress multiplied by the model thickness in the direction perpendicular to the plane in which the biaxial load is applied, ). The two curves collapse, which indicates that the difference between the stress–strain curves is indeed due to the Poisson's effect. This is also suggested by the experimental data presented in Ref. [83], where stress–strain curves for uniaxial and biaxial loading of human amnion are reported. In their case too, the curves representing the force per unit length of the loaded sample edge versus strain overlap, within the reported sample to sample variability.
Fig. 12.
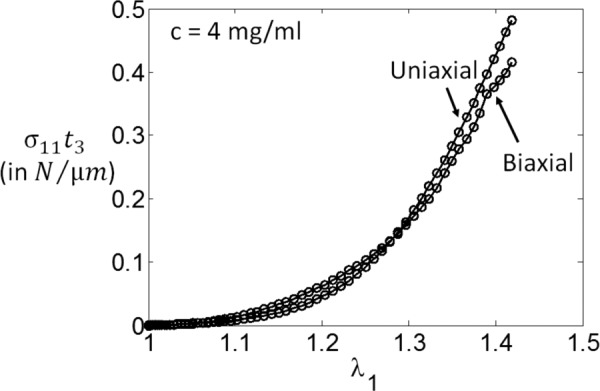
Data in Fig. 11(a) replotted as , where is the model thickness in the direction perpendicular to the plane of biaxial tension, x3. The collapse of the two curves indicates that the difference seen in Fig. 11(a) is due to the more pronounced Poisson's contraction in the x3 direction in the biaxial loading case.
In line with the shift of regime 2 to a smaller stretch range under biaxial loading, the peak of , with measured in the x1 − x3 plane, shifts to smaller stretch values, but remains in the middle range of regime 2. decreases fast beyond the peak and hence levels off at in-plane stretches as small as 1.2.
As seen, the Poisson's effect is more pronounced in the biaxial than in the uniaxial case. Here, we use the in-plane, , and out-of-plane, , stretches to compute the incremental Poisson's ratio. Contraction in the x3 direction takes place very fast with increasing in-plane stretch, but the relationship between and remains qualitatively identical to that of the uniaxial case (Fig. 13). decreases with increasing beyond the peak, but less abruptly than in the uniaxial case. This is due to the fact that in the biaxial case, this peak is not associated with the onset of regime 3, as happens under uniaxial deformation.
Fig. 13.
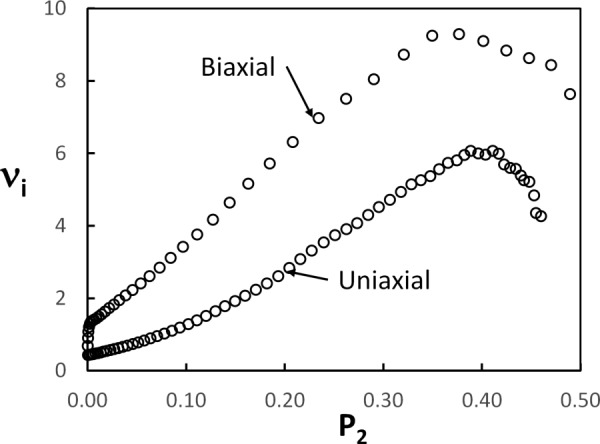
Relationship between the incremental Poisson's ratio and the orientation index for models with c = 4 mg/ml subjected to uniaxial (reproduced from Fig. 6) and biaxial loading. In the uniaxial case, is computed in 3D. In the biaxial case, both and are computed as averages over the x1 − x3 and x2 − x3 faces of the model. Biaxial stretch is applied in the x1 and x2 directions.
4. Conclusions
A discussion of the mechanical behavior of random networks with parameters in the range relevant for collagen networks of soft tissue is presented. The results are compared with three sets of experimental data from the literature and good agreement with model predictions is observed. The stress–strain curves exhibit the usual three regimes, with the exponential regime (regime 2) being the most relevant for tissue. The exponential stress–stretch dependence is associated with fiber convection and hence it is a purely geometric nonlinear effect. Strong fiber alignment in the tensile loading direction takes place in regime 2. This leads to a large increase of the incremental Poisson's ratio with stretch. Fiber alignment stops when the lateral constraint produced by fibers not collected into the axial load carrying subnetwork becomes sufficiently strong. This leads to leveling and further reduction of the incremental Poisson's ratio. In uniaxial loading, this stage correlates with the onset of regime 3. However, it occurs earlier under biaxial loading. As fibers become preferentially aligned in the stretch direction, a transition from the bending to the axial deformation mode of fibers is observed. This transition is associated with a reduction of the rate of collagen reorientation, which increases with stretch as long as the network deformation is bending dominated, and decreases when the deformation becomes axially dominated. Accounting for fiber tortuosity does not change any of these conclusions. The tangent stiffness-stress function and the relation between the incremental Poisson's ratio and the orientation index are independent of the magnitude of tortuosity.
Acknowledgment
We thank Professor E. Mazza from ETH Zurich and Professor J.M. Allain from Ecole Polytechnique, Palaiseau for providing access to the experimental data.
Appendix
In this appendix, we consider a tensile uniaxial deformation of an ensemble of fibers and evaluate the relationship between the true fiber orientation index and its two-dimensional equivalent , which would be measured by inspecting the lateral surface of the respective sample.
Consider that the fiber orientation is described by the probability distribution function
| (A1) |
where are the Euler angles, with measured from the loading direction (x1), σ is a parameter controlling the standard deviation of the distribution, and is the imaginary error function. Parameter σ decreases as the deformation proceeds and fibers become aligned in the loading direction. This distribution is defined over and and is normalized over this interval: . The distribution (A1) is approximately a Gaussian in the vicinity of but fulfills the required periodicity conditions at the boundaries of the domain of definition. is evaluated using Eq. (1), and with
| (A2) |
In experiments, one typically observes one of the lateral surfaces of the sample, say the x1 − x2 face, and evaluates the orientation in the x1 direction during deformation using Eq. (2) and , where is the angle between x1 and the projection of the fiber end-to-end vector in the x1 − x2 plane. This quantity is given by
| (A3) |
Figure 14 shows the variation of and function of σ, while the inset shows the error made by using in place of .
Fig. 14.
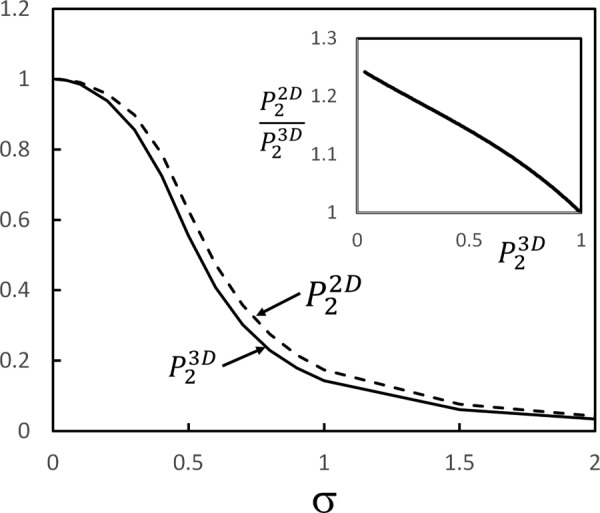
Dependence of the 2D and 3D measures of fiber orientation, and , on parameter σ representing the broadness of the distribution function of fiber orientation relative to the stretch direction. The inset shows the ratio function of , i.e., the error made by using the 2D version of the orientation index. It is assumed that deformation is uniaxial and no anisotropy develops in the plane perpendicular to the loading direction during deformation, i.e., the x1 − x2 and x1 − x3 planes are equivalent.
Contributor Information
R. C. Picu, Department of Mechanical, Aerospace , and Nuclear Engineering, , Rensselaer Polytechnic Institute, , Troy, NY 12180 , e-mail: picuc@rpi.edu.
S. Deogekar, Department of Mechanical, Aerospace and , Nuclear Engineering, , Rensselaer Polytechnic Institute, , Troy, NY 12180 , e-mail: deoges@rpi.edu
M. R. Islam, Department of Mechanical, Aerospace and , Nuclear Engineering, , Rensselaer Polytechnic Institute, , Troy, NY 12180 , e-mail: islamm3@rpi.edu
Funding Data
National Institute of Health (NIH) (Grant Nos. RO1-EB005813 and U01-EB016638).
National Science Foundation (NSF) (Grant No. CMMI-1634328).
References
- [1]. Hulmes, D. , 2008, Collagen Diversity, Synthesis and Assembly, Springer, Boston, MA, pp. 15–47. [Google Scholar]
- [2]. Hansen, K. A. , Weiss, J. A. , and Barton, J. K. , 2002, “ Recruitment of Tendon Crimp With Applied Tensile Strain,” ASME J. Biomech. Eng., 124(1), pp. 72–77. 10.1115/1.1427698 [DOI] [PubMed] [Google Scholar]
- [3]. Thorpe, C. T. , Klemt, C. , Riley, G. P. , Birch, H. L. , Clegg, P. D. , and Screen, H. R. , 2013, “ Helical Sub-Structures in Energy-Storing Tendons Provide a Possible Mechanism for Efficient Energy Storage and Return,” Acta Biomater., 9(8), pp. 7948–7956. 10.1016/j.actbio.2013.05.004 [DOI] [PubMed] [Google Scholar]
- [4]. Szczesny, S. E. , Peloquin, J. M. , Cortes, D. H. , Kadlowec, J. A. , Soslowsky, L. J. , and Elliott, D. M. , 2012, “ Biaxial Tensile Testing and Constitutive Modeling of Human Supraspinatus Tendon,” ASME J. Biomech. Eng., 134(2), p. 021004. 10.1115/1.4005852 [DOI] [PMC free article] [PubMed] [Google Scholar]
- [5]. Gusachenko, I. , Tran, V. , Houssen, Y. G. , Allain, J.-M. , and Schanne-Klein, M.-C. , 2012, “ Polarization-Resolved Second-Harmonic Generation in Tendon upon Mechanical Stretching,” Biophys. J., 102(9), pp. 2220–2229. 10.1016/j.bpj.2012.03.068 [DOI] [PMC free article] [PubMed] [Google Scholar]
- [6]. Mansfield, J. C. , Winlove, C. P. , Moger, J. , and Matcher, S. J. , 2008, “ Collagen Fiber Arrangement in Normal and Diseased Cartilage Studied by Polarization Sensitive Nonlinear Microscopy,” J. Biomed. Opt., 13(4), p. 044020. 10.1117/1.2950318 [DOI] [PubMed] [Google Scholar]
- [7]. Meng, Q. , An, S. , Damion, R. A. , Jin, Z. , Wilcox, R. , Fisher, J. , and Jones, A. , 2017, “ The Effect of Collagen Fibril Orientation on the Biphasic Mechanics of Articular Cartilage,” J. Mech. Behav. Biomed. Mater., 65, pp. 439–453. 10.1016/j.jmbbm.2016.09.001 [DOI] [PubMed] [Google Scholar]
- [8]. Zhang, S. , Bassett, D. S. , and Winkelstein, B. A. , 2016, “ Stretch-Induced Network Reconfiguration of Collagen Fibres in the Human Facet Capsular Ligament,” J. R. Soc. Interface, 13(114), p. 20150883. 10.1098/rsif.2015.0883 [DOI] [PMC free article] [PubMed] [Google Scholar]
- [9]. Mauri, A. , Ehret, A. E. , Perrini, M. , Maake, C. , Ochsenbein-Kölble, N. , Ehrbar, M. , Oyen, M. L. , and Mazza, E. , 2015, “ Deformation Mechanisms of Human Amnion: Quantitative Studies Based on Second Harmonic Generation Microscopy,” J. Biomech., 48(9), pp. 1606–1613. 10.1016/j.jbiomech.2015.01.045 [DOI] [PubMed] [Google Scholar]
- [10]. Perrini, M. , Mauri, A. , Ehret, A. E. , Ochsenbein-Kölble, N. , Zimmermann, R. , Ehrbar, M. , and Mazza, E. , 2015, “ Mechanical and Microstructural Investigation of the Cyclic Behavior of Human Amnion,” ASME J. Biomech. Eng., 137(6), p. 061010. 10.1115/1.4030054 [DOI] [PubMed] [Google Scholar]
- [11]. Bancelin, S. , Lynch, B. , Bonod-Bidaud, C. , Ducourthial, G. , Psilodimitrakopoulos, S. , Dokládal, P. , Allain, J.-M. , Schanne-Klein, M.-C. , and Ruggiero, F. , 2015, “ Ex Vivo Multiscale Quantitation of Skin Biomechanics in Wild-Type and Genetically-Modified Mice Using Multiphoton Microscopy,” Sci. Rep., 5, p. 17635. 10.1038/srep17635 [DOI] [PMC free article] [PubMed] [Google Scholar]
- [12]. Jayyosi, C. , Affagard, J.-S. , Ducourthial, G. , Bonod-Bidaud, C. , Lynch, B. , Bancelin, S. , Ruggiero, F. , Schanne-Klein, M.-C. , Allain, J.-M. , and Bruyère-Garnier, K. , 2017, “ Affine Kinematics in Planar Fibrous Connective Tissues: An Experimental Investigation,” Biomech. Model. Mechanobiol., 16(4), pp. 1459–1473. 10.1007/s10237-017-0899-1 [DOI] [PubMed] [Google Scholar]
- [13]. Lynch, B. , Bancelin, S. , Bonod-Bidaud, C. , Gueusquin, J.-B. , Ruggiero, F. , Schanne-Klein, M.-C. , and Allain, J.-M. , 2017, “ A Novel Microstructural Interpretation for the Biomechanics of Mouse Skin Derived From Multiscale Characterization,” Acta Biomater., 50, pp. 302–311. 10.1016/j.actbio.2016.12.051 [DOI] [PubMed] [Google Scholar]
- [14]. Holzapfel, G. A. , and Ogden, R. W. , 2009, Biomechanical Modelling at the Molecular, Cellular and Tissue Levels, Springer Science & Business Media, Vienna, Austria. [Google Scholar]
- [15]. Ault, H. , and Hoffman, A. , 1992, “ A Composite Micromechanical Model for Connective Tissues—Part I: Theory,” ASME J. Biomech. Eng, 114(1), pp. 137–141. 10.1115/1.2895437 [DOI] [PubMed] [Google Scholar]
- [16]. Cortes, D. H. , and Elliott, D. M. , 2012, “ Extra-Fibrillar Matrix Mechanics of Annulus Fibrosus in Tension and Compression,” Biomech. Model. Mechanobiol., 11(6), pp. 781–790. 10.1007/s10237-011-0351-x [DOI] [PMC free article] [PubMed] [Google Scholar]
- [17]. Guerin, H. L. , and Elliott, D. M. , 2007, “ Quantifying the Contributions of Structure to Annulus Fibrosus Mechanical Function Using a Nonlinear, Anisotropic, Hyperelastic Model,” J. Orthopaedic Res., 25(4), pp. 508–516. 10.1002/jor.20324 [DOI] [PubMed] [Google Scholar]
- [18]. Holzapfel, G. A. , Gasser, T. C. , and Ogden, R. W. , 2000, “ A New Constitutive Framework for Arterial Wall Mechanics and a Comparative Study of Material Models,” J. Elast. Phys. Sci. Solids, 61(1–3), pp. 1–48. 10.1023/A:1010835316564 [DOI] [Google Scholar]
- [19]. Lanir, Y. , 1979, “ A Structural Theory for the Homogeneous Biaxial Stress-Strain Relationships in Flat Collagenous Tissues,” J. Biomech., 12(6), pp. 423–436. 10.1016/0021-9290(79)90027-7 [DOI] [PubMed] [Google Scholar]
- [20]. Martufi, G. , and Gasser, T. C. , 2011, “ A Constitutive Model for Vascular Tissue That Integrates Fibril, Fiber and Continuum Levels With Application to the Isotropic and Passive Properties of the Infrarenal Aorta,” J. Biomech., 44(14), pp. 2544–2550. 10.1016/j.jbiomech.2011.07.015 [DOI] [PubMed] [Google Scholar]
- [21]. Raghupathy, R. , and Barocas, V. H. , 2009, “ A Closed-Form Structural Model of Planar Fibrous Tissue Mechanics,” J. Biomech., 42(10), pp. 1424–1428. 10.1016/j.jbiomech.2009.04.005 [DOI] [PMC free article] [PubMed] [Google Scholar]
- [22]. Head, D. A. , Levine, A. J. , and MacKintosh, F. , 2003, “ Deformation of Cross-Linked Semiflexible Polymer Networks,” Phys. Rev. Lett., 91(10), p. 108102. 10.1103/PhysRevLett.91.108102 [DOI] [PubMed] [Google Scholar]
- [23]. Wilhelm, J. , and Frey, E. , 2003, “ Elasticity of Stiff Polymer Networks,” Phys. Rev. Lett., 91(10), p. 108103. 10.1103/PhysRevLett.91.108103 [DOI] [PubMed] [Google Scholar]
- [24]. DiDonna, B. , and Lubensky, T. , 2005, “ Nonaffine Correlations in Random Elastic Media,” Phys. Rev. E, 72(6), p. 066619. 10.1103/PhysRevE.72.066619 [DOI] [PubMed] [Google Scholar]
- [25]. Hatami-Marbini, H. , and Picu, R. , 2008, “ Scaling of Nonaffine Deformation in Random Semiflexible Fiber Networks,” Phys. Rev. E, 77(6), p. 062103. 10.1103/PhysRevE.77.062103 [DOI] [PubMed] [Google Scholar]
- [26]. Picu, R. , 2011, “ Mechanics of Random Fiber Networks—A Review,” Soft Matter, 7(15), pp. 6768–6785. 10.1039/c1sm05022b [DOI] [Google Scholar]
- [27]. Broedersz, C. P. , and MacKintosh, F. C. , 2014, “ Modeling Semiflexible Polymer Networks,” Rev. Mod. Phys., 86(3), p. 995. 10.1103/RevModPhys.86.995 [DOI] [Google Scholar]
- [28]. Billiar, K. , and Sacks, M. , 1997, “ A Method to Quantify the Fiber Kinematics of Planar Tissues Under Biaxial Stretch,” J. Biomech., 30(7), pp. 753–756. 10.1016/S0021-9290(97)00019-5 [DOI] [PubMed] [Google Scholar]
- [29]. Gilbert, T. W. , Sacks, M. S. , Grashow, J. S. , Woo, S. L.-Y. , Badylak, S. F. , and Chancellor, M. B. , 2006, “ Fiber Kinematics of Small Intestinal Submucosa Under Biaxial and Uniaxial Stretch,” ASME J. Biomech. Eng., 128(6), pp. 890–898. 10.1115/1.2354200 [DOI] [PubMed] [Google Scholar]
- [30]. Guerin, H. A. L. , and Elliott, D. M. , 2006, “ Degeneration Affects the Fiber Reorientation of Human Annulus Fibrosus Under Tensile Load,” J. Biomech., 39(8), pp. 1410–1418. 10.1016/j.jbiomech.2005.04.007 [DOI] [PubMed] [Google Scholar]
- [31]. Lake, S. P. , Cortes, D. H. , Kadlowec, J. A. , Soslowsky, L. J. , and Elliott, D. M. , 2012, “ Evaluation of Affine Fiber Kinematics in Human Supraspinatus Tendon Using Quantitative Projection Plot Analysis,” Biomech. Model. Mechanobiol., 11(1–2), pp. 197–205. 10.1007/s10237-011-0303-5 [DOI] [PMC free article] [PubMed] [Google Scholar]
- [32]. Sander, E. A. , Stylianopoulos, T. , Tranquillo, R. T. , and Barocas, V. H. , 2009, “ Image-Based Multiscale Modeling Predicts Tissue-Level and Network-Level Fiber Reorganization in Stretched Cell-Compacted Collagen Gels,” Proc. Natl. Acad. Sci., 106(42), pp. 17675–17680. 10.1073/pnas.0903716106 [DOI] [PMC free article] [PubMed] [Google Scholar]
- [33]. Storm, C. , Pastore, J. J. , MacKintosh, F. C. , Lubensky, T. C. , and Janmey, P. A. , 2004, “Nonlinear Elasticity in Biological Gels,” preprint arXiv: cond-mat/0406016.https://arxiv.org/ftp/cond-mat/papers/0406/0406016.pdf [DOI] [PubMed]
- [34]. Stylianopoulos, T. , and Barocas, V. H. , 2007, “ Multiscale, Structure-Based Modeling for the Elastic Mechanical Behavior of Arterial Walls,” ASME J. Biomech. Eng., 129(4), pp. 611–618. 10.1115/1.2746387 [DOI] [PubMed] [Google Scholar]
- [35]. Zhang, L. , Lake, S. P. , Lai, V. K. , Picu, C. R. , Barocas, V. H. , and Shephard, M. S. , 2012, “ A Coupled Fiber-Matrix Model Demonstrates Highly Inhomogeneous Microstructural Interactions in Soft Tissues Under Tensile Load,” ASME J. Biomech. Eng., 135(1), p. 011008. 10.1115/1.4023136 [DOI] [PMC free article] [PubMed] [Google Scholar]
- [36]. Zhang, L. , Lake, S. , Barocas, V. , Shephard, M. , and Picu, R. , 2013, “ Cross-Linked Fiber Network Embedded in an Elastic Matrix,” Soft Matter, 9(28), pp. 6398–6405. 10.1039/c3sm50838b [DOI] [PMC free article] [PubMed] [Google Scholar]
- [37]. Ban, E. , Barocas, V. H. , Shephard, M. S. , and Picu, R. C. , 2016, “ Softening in Random Networks of Non-Identical Beams,” J. Mech. Phys. Solids, 87, pp. 38–50. 10.1016/j.jmps.2015.11.001 [DOI] [PMC free article] [PubMed] [Google Scholar]
- [38]. Borodulina, S. , Motamedian, H. R. , and Kulachenko, A. , 2016, “ Effect of Fiber and Bond Strength Variations on the Tensile Stiffness and Strength of Fiber Networks,” Int. J. Solids Struct., epub. 10.1016/j.ijsolstr.2016.12.013 [DOI] [Google Scholar]
- [39]. Kallmes, O. , and Corte, H. , 1960, “ The Structure of Paper—I: The Statistical Geometry of an Ideal Two Dimensional Fiber Network,” Tappi J., 43(9), pp. 737–752. [Google Scholar]
- [40]. Shahsavari, A. , and Picu, R. , 2013, “ Size Effect on Mechanical Behavior of Random Fiber Networks,” Int. J. Solids Struct., 50(20), pp. 3332–3338. 10.1016/j.ijsolstr.2013.06.004 [DOI] [Google Scholar]
- [41]. Heussinger, C. , and Frey, E. , 2007, “ Role of Architecture in the Elastic Response of Semiflexible Polymer and Fiber Networks,” Phys. Rev. E, 75(1), p. 011917. 10.1103/PhysRevE.75.011917 [DOI] [PubMed] [Google Scholar]
- [42]. Lake, S. P. , Hadi, M. F. , Lai, V. K. , and Barocas, V. H. , 2012, “ Mechanics of a Fiber Network Within a Non-Fibrillar Matrix: Model and Comparison With Collagen-Agarose Co-Gels,” Ann. Biomed. Eng., 40(10), pp. 2111–2121. 10.1007/s10439-012-0584-6 [DOI] [PMC free article] [PubMed] [Google Scholar]
- [43]. Nachtrab, S. , Kapfer, S. C. , Arns, C. H. , Madadi, M. , Mecke, K. , Schröder, and Turk, G. E. , 2011, “ Morphology and Linear‐Elastic Moduli of Random Network Solids,” Adv. Mater., 23(22–23), pp. 2633–2637. 10.1002/adma.201004094 [DOI] [PubMed] [Google Scholar]
- [44]. Pritchard, R. H. , Huang, Y. Y. S. , and Terentjev, E. M. , 2014, “ Mechanics of Biological Networks: From the Cell Cytoskeleton to Connective Tissue,” Soft Matter, 10(12), pp. 1864–1884. 10.1039/c3sm52769g [DOI] [PubMed] [Google Scholar]
- [45]. Provenzano, P. P. , and Vanderby, R. , 2006, “ Collagen Fibril Morphology and Organization: Implications for Force Transmission in Ligament and Tendon,” Matrix Biol., 25(2), pp. 71–84. 10.1016/j.matbio.2005.09.005 [DOI] [PubMed] [Google Scholar]
- [46]. Motte, S. , and Kaufman, L. J. , 2013, “ Strain Stiffening in Collagen—I: Networks,” Biopolymers, 99(1), pp. 35–46. 10.1002/bip.22133 [DOI] [PubMed] [Google Scholar]
- [47]. Yang, Y-L. , Leone, L. M. , and Kaufman, L. J. , 2009, “ Elastic Moduli of Collagen Gels Can Be Predicted From Two-Dimensional Confocal Microscopy,” Biophys. J., 97(7), pp. 2051–2060. 10.1016/j.bpj.2009.07.035 [DOI] [PMC free article] [PubMed] [Google Scholar]
- [48]. Lai, V. K. , Frey, C. R. , Kerandi, A. M. , Lake, S. P. , Tranquillo, R. T. , and Barocas, V. H. , 2012, “ Microstructural and Mechanical Differences Between Digested Collagen–Fibrin Co-Gels and Pure Collagen and Fibrin Gels,” Acta Biomater., 8(11), pp. 4031–4042. 10.1016/j.actbio.2012.07.010 [DOI] [PMC free article] [PubMed] [Google Scholar]
- [49]. Lindström, S. B. , Vader, D. A. , Kulachenko, A. , and Weitz, D. A. , 2010, “ Biopolymer Network Geometries: Characterization, Regeneration, and Elastic Properties,” Phys. Rev. E, 82(5), p. 051905. 10.1103/PhysRevE.82.051905 [DOI] [PubMed] [Google Scholar]
- [50]. Lindström, S. B. , Kulachenko, A. , Jawerth, L. M. , and Vader, D. A. , 2013, “ Finite-Strain, Finite-Size Mechanics of Rigidly Cross-Linked Biopolymer Networks,” Soft Matter, 9(30), pp. 7302–7313. 10.1039/c3sm50451d [DOI] [Google Scholar]
- [51]. D'Amore, A. , Stella, J. A. , Wagner, W. R. , and Sacks, M. S. , 2010, “ Characterization of the Complete Fiber Network Topology of Planar Fibrous Tissues and Scaffolds,” Biomaterials, 31(20), pp. 5345–5354. 10.1016/j.biomaterials.2010.03.052 [DOI] [PMC free article] [PubMed] [Google Scholar]
- [52]. Koh, C. , and Oyen, M. , 2012, “ Branching Toughens Fibrous Networks,” J. Mech. Behav. Biomed. Mater., 12, pp. 74–82. 10.1016/j.jmbbm.2012.03.011 [DOI] [PubMed] [Google Scholar]
- [53]. Yang, L. , van der Werf, K. O. , Fitié, C. F. , Bennink, M. L. , Dijkstra, P. J. , and Feijen, J. , 2008, “ Mechanical Properties of Native and Cross-Linked Type I Collagen Fibrils,” Biophys. J., 94(6), pp. 2204–2211. 10.1529/biophysj.107.111013 [DOI] [PMC free article] [PubMed] [Google Scholar]
- [54]. Arevalo, R. C. , Urbach, J. S. , and Blair, D. L. , 2010, “ Size-Dependent Rheology of Type-I Collagen Networks,” Biophys. J., 99(8), pp. L65–L67. 10.1016/j.bpj.2010.08.008 [DOI] [PMC free article] [PubMed] [Google Scholar]
- [55]. Shahsavari, A. , and Picu, R. , 2012, “ Model Selection for Athermal Cross-Linked Fiber Networks,” Phys. Rev. E, 86(1), p. 011923. 10.1103/PhysRevE.86.011923 [DOI] [PubMed] [Google Scholar]
- [56]. Dutov, P. , Antipova, O. , Varma, S. , Orgel, J. P. , and Schieber, J. D. , 2016, “ Measurement of Elastic Modulus of Collagen Type I Single Fiber,” PloS One, 11(1), p. e0145711. 10.1371/journal.pone.0145711 [DOI] [PMC free article] [PubMed] [Google Scholar]
- [57]. Stauffer, D. , and Aharony, A. , 1994, Introduction to Percolation Theory, CRC Press, Boca Raton, FL. [Google Scholar]
- [58]. Sharma, A. , Licup, A. , Rens, R. , Vahabi, M. , Jansen, K. , Koenderink, G. , and MacKintosh, F. , 2016, “ Strain-Driven Criticality Underlies Nonlinear Mechanics of Fibrous Networks,” Phys. Rev. E, 94(4), p. 042407. 10.1103/PhysRevE.94.042407 [DOI] [PubMed] [Google Scholar]
- [59]. Wyart, M. , Liang, H. , Kabla, A. , and Mahadevan, L. , 2008, “ Elasticity of Floppy and Stiff Random Networks,” Phys. Rev. Lett., 101(21), p. 215501. 10.1103/PhysRevLett.101.215501 [DOI] [PubMed] [Google Scholar]
- [60]. Licup, A. J. , Münster, S. , Sharma, A. , Sheinman, M. , Jawerth, L. M. , Fabry, B. , Weitz, D. A. , and MacKintosh, F. C. , 2015, “ Stress Controls the Mechanics of Collagen Networks,” Proc. Natl. Acad. Sci., 112(31), pp. 9573–9578. 10.1073/pnas.1504258112 [DOI] [PMC free article] [PubMed] [Google Scholar]
- [61]. Rezakhaniha, R. , Agianniotis, A. , Schrauwen, J. T. , Griffa, A. , Sage, D. , Bouten, C. V. , van de Vosse, F. , Unser, M. , and Stergiopulos, N. , 2012, “ Experimental Investigation of Collagen Waviness and Orientation in the Arterial Adventitia Using Confocal Laser Scanning Microscopy,” Biomech. Model. Mechanobiol., 11(3), pp. 461–473. 10.1007/s10237-011-0325-z [DOI] [PubMed] [Google Scholar]
- [62]. Sherman, V. R. , Yang, W. , and Meyers, M. A. , 2015, “ The Materials Science of Collagen,” J. Mech. Behav. Biomed. Mater., 52, pp. 22–50. 10.1016/j.jmbbm.2015.05.023 [DOI] [PubMed] [Google Scholar]
- [63]. Depalle, B. , Qin, Z. , Shefelbine, S. J. , and Buehler, M. J. , 2015, “ Influence of Cross-Link Structure, Density and Mechanical Properties in the Mesoscale Deformation Mechanisms of Collagen Fibrils,” J. Mech. Behav. Biomed. Mater., 52, pp. 1–13. 10.1016/j.jmbbm.2014.07.008 [DOI] [PMC free article] [PubMed] [Google Scholar]
- [64]. Eppell, S. , Smith, B. , Kahn, H. , and Ballarini, R. , 2006, “ Nano Measurements With Micro-Devices: Mechanical Properties of Hydrated Collagen Fibrils,” J. R. Soc. Interface, 3(6), pp. 117–121. 10.1098/rsif.2005.0100 [DOI] [PMC free article] [PubMed] [Google Scholar]
- [65]. Svensson, R. B. , Hassenkam, T. , Hansen, P. , and Magnusson, S. P. , 2010, “ Viscoelastic Behavior of Discrete Human Collagen Fibrils,” J. Mech. Behav. Biomed. Mater., 3(1), pp. 112–115. 10.1016/j.jmbbm.2009.01.005 [DOI] [PubMed] [Google Scholar]
- [66]. Miyazaki, H. , and Hayashi, K. , 1999, “ Tensile Tests of Collagen Fibers Obtained From the Rabbit Patellar Tendon,” Biomed. Microdev., 2(2), pp. 151–157. 10.1023/A:1009953805658 [DOI] [Google Scholar]
- [67]. Gentleman, E. , Lay, A. N. , Dickerson, D. A. , Nauman, E. A. , Livesay, G. A. , and Dee, K. C. , 2003, “ Mechanical Characterization of Collagen Fibers and Scaffolds for Tissue Engineering,” Biomaterials, 24(21), pp. 3805–3813. 10.1016/S0142-9612(03)00206-0 [DOI] [PubMed] [Google Scholar]
- [68]. Lake, S. P. , and Barocas, V. H. , 2011, “ Mechanical and Structural Contribution of Non-Fibrillar Matrix in Uniaxial Tension: A Collagen-Agarose Co-Gel Model,” Ann. Biomed. Eng., 39(7), pp. 1891–1903. 10.1007/s10439-011-0298-1 [DOI] [PMC free article] [PubMed] [Google Scholar]
- [69]. Žagar, G. , Onck, P. R. , and van der Giessen, E. , 2015, “ Two Fundamental Mechanisms Govern the Stiffening of Cross-Linked Networks,” Biophys. J., 108(6), pp. 1470–1479. 10.1016/j.bpj.2015.02.015 [DOI] [PMC free article] [PubMed] [Google Scholar]
- [70]. Reese, S. P. , Maas, S. A. , and Weiss, J. A. , 2010, “ Micromechanical Models of Helical Superstructures in Ligament and Tendon Fibers Predict Large Poisson's Ratios,” J. Biomech., 43(7), pp. 1394–1400. 10.1016/j.jbiomech.2010.01.004 [DOI] [PMC free article] [PubMed] [Google Scholar]
- [71]. Rigby, B. J. , Hirai, N. , Spikes, J. D. , and Eyring, H. , 1959, “ The Mechanical Properties of Rat Tail Tendon,” J. General Physiol., 43(2), pp. 265–283. 10.1085/jgp.43.2.265 [DOI] [PMC free article] [PubMed] [Google Scholar]
- [72]. Diamant, J. , Keller, A. , Baer, E. , Litt, M. , and Arridge, R. , 1972, “ Collagen; Ultrastructure and Its Relation to Mechanical Properties as a Function of Ageing,” Proc. R. Soc. London B: Biol. Sci., 180(1060), pp. 293–315. 10.1098/rspb.1972.0019 [DOI] [PubMed] [Google Scholar]
- [73]. Ban, E. , Barocas, V. H. , Shephard, M. S. , and Picu, C. R. , 2016, “ Effect of Fiber Crimp on the Elasticity of Random Fiber Networks With and Without Embedding Matrices,” ASME J. Appl. Mech., 83(4), p. 041008. 10.1115/1.4032465 [DOI] [PMC free article] [PubMed] [Google Scholar]
- [74]. Clark, J. M. , 1991, “ Variation of Collagen Fiber Alignment in a Joint Surface: A Scanning Electron Microscope Study of the Tibial plateau in Dog, Rabbit, and Man,” J. Orthop. Res., 9(2), pp. 246–257. 10.1002/jor.1100090213 [DOI] [PubMed] [Google Scholar]
- [75]. Kääb, M. , Ap Gwynn, I. , and Nötzli, H. , 1998, “ Collagen Fibre Arrangement in the Tibial Plateau Articular Cartilage of Man and Other Mammalian Species,” J. Anat., 193(1), pp. 23–34. 10.1017/S0021878298003744 [DOI] [PMC free article] [PubMed] [Google Scholar]
- [76]. Wu, J. P. , Kirk, T. B. , and Zheng, M. H. , 2008, “ Study of the Collagen Structure in the Superficial Zone and Physiological State of Articular Cartilage Using a 3D Confocal Imaging Technique,” J. Orthop. Surg. Res., 3(1), p. 29. 10.1186/1749-799X-3-29 [DOI] [PMC free article] [PubMed] [Google Scholar]
- [77]. Elliott, D. M. , Narmoneva, D. A. , and Setton, L. A. , 2002, “ Direct Measurement of the Poisson's Ratio of Human Patella Cartilage in Tension,” ASME. J. Biomech. Eng., 124(2), pp. 223–228. 10.1115/1.1449905 [DOI] [PubMed] [Google Scholar]
- [78]. Chang, D. , Lottman, L. , Chen, A. , Schinagl, R. , Albrecht, D. , Pedowitz, R. , Brossman, J. , Frank, L. , and Sah, R. , 1999, “ The Depth-Dependent, Multi-Axial Properties of Aged Human Patellar Cartilage in Tension,” Trans. Annu. Meet. Orthop. Res. Soc., 24, p. 644.https://www.ors.org/Transactions/45/0644.PDF [Google Scholar]
- [79]. Huang, C.-Y. , Stankiewicz, A. , Ateshian, G. A. , and Mow, V. C. , 2005, “ Anisotropy, Inhomogeneity, and Tension–Compression Nonlinearity of Human Glenohumeral Cartilage in Finite Deformation,” J. Biomech., 38(4), pp. 799–809. 10.1016/j.jbiomech.2004.05.006 [DOI] [PMC free article] [PubMed] [Google Scholar]
- [80]. Puxkandl, R. , Zizak, I. , Paris, O. , Keckes, J. , Tesch, W. , Bernstorff, S. , Purslow, P. , and Fratzl, P. , 2002, “ Viscoelastic Properties of Collagen: Synchrotron Radiation Investigations and Structural Model,” Philos. Trans. R. Soc. London B, 357(1418), pp. 191–197. 10.1098/rstb.2001.1033 [DOI] [PMC free article] [PubMed] [Google Scholar]
- [81]. Kukreti, U. , and Belkoff, S. M. , 2000, “ Collagen Fibril D-Period May Change as a Function of Strain and Location in Ligament,” J. Biomech., 33(12), pp. 1569–1574. 10.1016/S0021-9290(00)00150-0 [DOI] [PubMed] [Google Scholar]
- [82]. Chen, H. , Zhao, X. , Berwick, Z. C. , Krieger, J. F. , Chambers, S. , and Kassab, G. S. , 2016, “ Microstructure and Mechanical Property of Glutaraldehyde-Treated Porcine Pulmonary Ligament,” ASME J. Biomech. Eng., 138(6), p. 061003. 10.1115/1.4033300 [DOI] [PMC free article] [PubMed] [Google Scholar]
- [83]. Mauri, A. , Perrini, M. , Ehret, A. E. , De Focatiis, D. S. , and Mazza, E. , 2015, “ Time-Dependent Mechanical Behavior of Human Amnion: Macroscopic and Microscopic Characterization,” Acta Biomater., 11, pp. 314–323. 10.1016/j.actbio.2014.09.012 [DOI] [PubMed] [Google Scholar]


