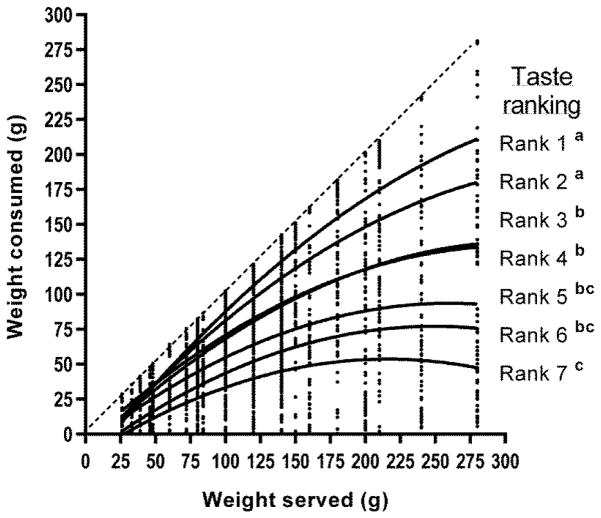
Figure 2.
Mean intake curves for the seven foods in the meal according to their taste ranking by the 88 women who completed this assessment. The curve for Rank 1 shows the mean portion size response for the food ranked as best-tasting; the highest-ranked food was different for different subjects. Subject rankings of food taste significantly influenced the trajectory of intake, according to a random coefficients analysis (P<0.0001). Foods ranked higher in taste showed a greater effect of portion size on intake. Taste rankings with different superscripts had significantly different linear coefficients for the intake curve. The scatterplots show individual food intakes and the dotted line represents consumption of the entire amount of food served (line of equality).

