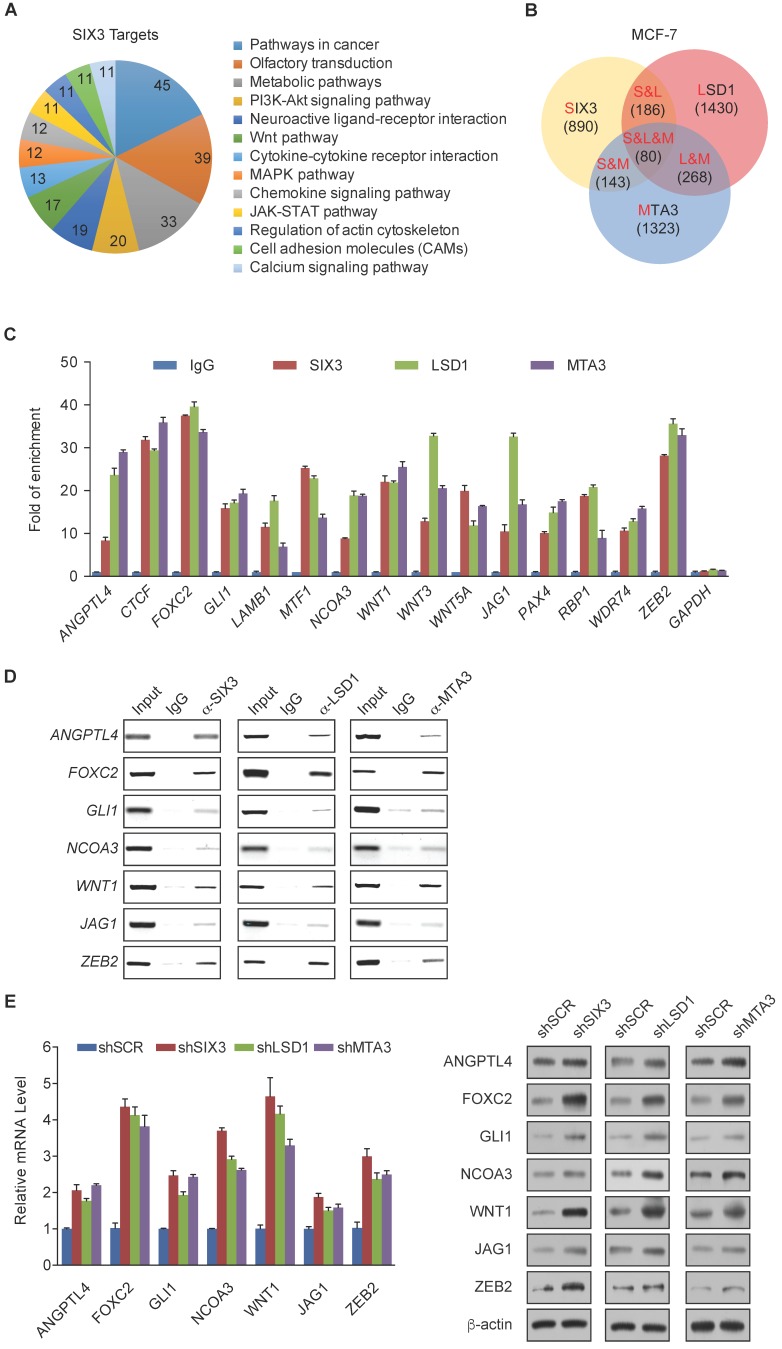
Figure 3.
Genome-Wide Transcription Target Analysis of the SIX3/LSD1/NuRD(MTA3) Complex (A) Clustering of the 890 overlapping target genes of SIX3 into functional groups. (B) Venn diagram of overlapping promoters bound by SIX3, LSD1, and MTA3 in MCF-7 cells. The numbers represent the number of promoters that were targeted by the indicated proteins. The detailed results of the ChIP-on-chip experiments are summarized in Supplementary Table S2. (C) Verification of the ChIP-on-chip results via qChIP analysis of the indicated genes in MCF-7 cells. Results are represented as fold change over control with GAPDH as a negative control. Error bars represent mean ± SD for three independent experiments. (D) Verification of the ChIP-on-chip results by conventional DNA electrophoresis. IgG served as a negative control. (E) MCF-7 cells were treated with specific lentivirally expressed shRNAs, and the levels of mRNA (upper panel) and protein (lower panel) of ANGPTL4, FOXC2, GLI1, NCOA3, WNT1, JAG1, and ZEB2 were measured. The mRNA levels were normalized to those of GADPH (upper panel), and β-actin served as a loading control for the western blot (lower panel). Error bars represent mean ± SD of three independent experiments.

