

Abstract
Objective
To assess whether high levels of cerebrospinal fluid neurogranin are found in atypical as well as typical Alzheimer's disease.
Methods
Immunoassays were used to measure cerebrospinal fluid neurogranin in 114 participants including healthy controls (n = 27), biomarker‐proven amnestic Alzheimer's disease (n = 68), and the atypical visual variant of Alzheimer's (n = 19) according to international criteria. CSF total‐tau, Aβ42, and neurofilament light concentrations were investigated using commercially available assays. All affected individuals had T1‐weighted volumetric MR images available for analysis of whole and regional brain volumes. Associations between neurogranin, brain volumes, total‐tau, Aβ42, and neurofilament light were assessed.
Results
Median cerebrospinal fluid neurogranin concentrations were higher in typical and atypical Alzheimer's compared to controls (P < 0.001 and P = 0.005). Both neurogranin and total‐tau concentrations, but not neurofilament light and Aβ42, were higher in typical Alzheimer's compared to atypical patients (P = 0.004 and P = 0.03). There were significant differences in the left hippocampus and right and left superior parietal lobules in atypical patients, which were larger (P = 0.03) and smaller (P = 0.001 and P < 0.001), respectively, compared to typical patients. We found no evidence of associations between neurogranin and brain volumes but a strong association with total‐tau (P < 0.001) and a weaker association with neurofilament light (P = 0.005).
Interpretation
These results show significant differences in neurogranin and total‐tau between typical and atypical patients, which may relate to factors other than disease topography. The differential relationships between neurogranin, total‐tau and neurofilament light in the Alzheimer's variants, provide evidence for mechanistically distinct and coupled markers of neurodegeneration.
Introduction
Synapses are the fundamental units that mediate neuronal communication. Their plasticity underlies learning and memory, through mechanisms including long‐term potentiation (LTP) and depression (LTD). There is substantial evidence that synapse loss is an early event in Alzheimer's disease (AD), preceding neuronal cell death and cognitive decline and is found throughout the neuropil without any clear relation to amyloid plaques.1, 2, 3 Biomarkers of synapse dysfunction or loss could potentially be useful in identifying Alzheimer's disease patients in the predementia stage as well providing information about disease pathophysiology that could have utility in clinical drug trials. Neurogranin (Ng) has recently emerged as a potential synaptic biomarker. It is a postsynaptic protein that is mainly expressed in the cortex and hippocampus, where it is concentrated in dendritic spines, and has a major role in regulating LTP and learning. Cerebrospinal (CSF) Ng is elevated in patients fulfilling clinical criteria for AD compared to mild cognitive impairment (MCI) patients as well as controls, a finding that has been replicated using different assays and across clinical sites.4, 5, 6, 7 Importantly, it has not yet been determined if it is also elevated in atypical forms of AD.
In contrast with many other CSF biomarkers, Ng elevation appears to be specific for AD and is not significantly raised in a number of other non‐AD dementias and parkinsonian conditions.8, 9 Given that synaptic dysfunction and neurodegeneration are common to a number of neurodegeneration diseases, the reason for this specificity is unclear. It might relate to the anatomical focus of the disease, noting that Ng is highly expressed in the amygdala, hippocampi and cortical regions,10, 11 areas typically and prominently involved in AD, although there is also prominent hippocampal involvement in some forms of frontotemporal dementia (FTD).12 An alternative explanation is that it is specific to the pathological process that underpins AD. For example there is evidence that selective impairment of the translocation of Ng mRNA from the cell body to the dendrites, which is seen in AD, is not found in neurons from FTD patients.13
One way of exploring these possibilities in vivo is by exploiting the phenotypic variation that is seen in AD. While most patients present with amnestic symptoms, others can present with nonamnestic phenotype,14 including posterior cortical atrophy (PCA), sometimes referred to as the visual variant of AD, where focus of neurodegeneration is, at least initially, restricted to the parietal/occipital lobes with relative sparing of hippocampal and temporal lobe volumes. In this study, we hypothesized that patients with PCA due to AD would have lower concentrations of Ng than patients with typical AD, and that this would relate to the degree of medial temporal lobe involvement.
Materials and Methods
We studied 114 participants seen at clinics at the National Hospital for Neurology and Neurosurgery, all of whom had a clinical assessment and CSF examination. In addition the AD patients had magnetic resonance imaging (MRI) brain scanning available for analysis. The study was approved by the local ethics committee and all participant gave written consent.
Study participants
Participants included 68 patients with amnestic AD according to International Working Group 2 (IWG‐2) criteria14 with an AD‐indicative CSF AD biomarker profile (T‐tau/Aβ42 >0.52)15; 19 patients with PCA, also with a CSF T‐tau/Aβ42 >0.52, according to Tang‐Wai criteria and fulfilling the latest international criteria for diagnosis of “PCA‐AD”16, 17; and 27 controls who were spouses or friends of patients with no history or symptoms of neurodegenerative disease at the time of lumbar puncture (LP). These healthy individuals underwent a thorough neurological examination, as well as a standardized neuropsychological assessment using the Mattis Dementia Rating Scale.18, 19 To ensure a “pure” group of healthy controls, we excluded those who had either Aβ42 <550 pg/mL or a T‐tau/Aβ42 >0.52 or both.15
Disease duration was recorded as the time in months from reported symptom onset to LP. Patients underwent Mini Mental State Examination (MMSE) for grading of global cognitive ability20 as well as examinations of CSF biomarker profiles. MMSE data were not available for 11 subjects.
CSF analysis
A standardized protocol for the collection and storage of CSF was followed.21 Briefly, CSF was collected in sterile polypropylene tubes, centrifuged at 4000 rpm for 10 min at +40°C. The supernatant was divided into 0.5 mL aliquots that were stored at −80°C.
CSF total tau (T‐tau) and Amyloid β 1–42 (Aβ42) concentrations were measured using INNOTEST enzyme‐linked immunosorbent assays (ELISAs) (Fujirebio Europe N.V., Gent, Belgium). CSF neurofilament light (NFL) concentration was measured using the NF‐Light kit (UmanDiagnostics, Umeå, Sweden). All analyses were performed by board‐certified laboratory technicians blinded to clinical information.
CSF Ng concentration was measured using one immunoassay with two different detection methods, to incorporate samples previously analysed and increase the sample size:
(1) Enzyme‐linked immunosorbent assay (ELISA). 71 CSF samples from amnestic AD (n = 49), PCA (n = 14) and control participants (n = 8), were measured using an ELISA assay for Ng; (2) MSD platform. 43 samples were run on an MSD platform (Meso Scale Discovery, Rockville, MD, USA), including amnestic AD (n = 19), PCA (n = 5) and controls (n = 19), to measure CSF Ng, as previously described.9
The monoclonal antibody Ng7, which recognizes the C‐terminus of Ng (epitope Ng52–65) and has been found to be optimal for ELISA, was used as a capturing antibody.4 Ng7 was coated on 96‐well microtiter plates at a final concentration of 1.0 μg/mL (100 μL/well) in carbonate buffer (50 mmol/L NaHCO3). For MSD Ng7 was coated on 96‐well microtiter plates in a final concentration of 2.0 μg/mL, 40 μL/well in PBS. Both assays were incubated overnight, ELISA‐plate at +4°C and MSD in room temperature.
After incubation the plates were washed four times with PBS containing 0.05% Tween (PBS‐Tween): for ELISA‐plates using a washing machine (Tecan hydrospeed) for MSD washed by hand Blocking was performed using a 1% BSA, PBS and 0.05% tween solution for ELISA‐plates and for MSD‐plates using MSD blocker A‐solution (1.25 g) MQ H2O 20 mL and PBS (1.25×). A secondary polyclonal antibody (Upstate) diluted 1:10,000 for ELISA‐plates in 1% BSA, PBS and 0.05% tween, for MSD diluted 1:20,000 in 0.1% BSA‐PBS‐tween, and samples, calibrators, blanks and controls were added to the plate in equal amount, (50 μL of each solution/well). The plates were incubated for 1 h at room temperature, 700 rpm, and thereafter over night at +4°C (ELISA‐plates) or in room temperature (MSD‐plates).
The next day, for ELISA, an anti‐rabbit (from donkey) conjugated to horse‐radish peroxidase (HRP) (Sigma) secondary antibody was added (diluted 1:20,000 in 1% BSA, PBS and 0.05% tween) and incubated in the plate for 5 h at room temperature. For MSD assay a goat anti‐rabbit sulfotag (0.5 μg/mL) was added and incubated for 2 h in room temperature.
The ELISA reading was performed using Tetramethyl benzidine (TMB) substrate (TMB peroxidase EIA substrate kit). TMB was added and incubated in the plate for 30 min at room temperature and protected from light. The color reaction was stopped by adding 2 mol/L sulfuric acid. The plate was read on a spectrophotometer (Vmax) at 450 and 650 nm as reference wavelength and the concentration of Ng was calculated using a 4‐parametric equation. As calibrator, a full‐length recombinant Ng with concentrations ranging between 8000–62.5 pg/mL was used in eight different concentrations. The lower and higher limits of quantification were 125 and 4000 pg/mL, respectively. Intra‐assay coefficients of variation (CV) were 8% for a high concentration Ng control.
For the MSD assay, the reading was performed with MSD read buffer (2×) using electrochemiluminescence (Meso Scale Discovery). The same calibrator was used as for ELISA measurement but ranging between 31.3–4000 pg/mL, 8‐different concentrations.
Altogether 16 values were truncated, because they were below the lower limit of quantification.
MRI acquisition and processing
T1‐weighted volumetric MR images were acquired on three different scanners (one 3.T Siemens Trio unit and two 1.5T Signa units) using spoiled gradient recalled or gradient echo (MPRAGE) sequences for amnestic‐ and PCA‐AD patients (scans were not acquired for control participants). The scans consisted of full brain coverage coronal or sagittal slices running between 124 and 208 contiguous slices of 1.5 or 1.1 mm. Whole‐bran volume was obtained using geodesic information flows (GIF).22 Briefly, for the volumetric analysis, brain was parcellated into 143 nonoverlapping regions using a multi‐atlas segmentation propagation approach following the brainCOLOR protocol [http://www.braincolor.org/protocols/docs/BrainCOLOR_cortical_parcellation_protocol.pdf] for deep grey matter regions and the Neuromorphometrics protocol [http://www.neuromorphometrics.org:8080/seg] for cortical regions.22 Regions of interest (ROIs) included right and left hippocampus, entorhinal cortex, angular gyrus, parahippocampal gyrus, superior parietal lobule and the frontal and occipital cortex. Total intracranial volume (TIV) was calculated using the Statistical Parametric Mapping (SPM) 12 software, version 6470 (www.fil.ion.ucl.ac.uk/spm), running under Matlab R2014b (Math Works, Natick, MA, USA).23
Statistical analysis
All analyses were carried out using Stata version 14. Global tests for differences between amnestic AD, PCA and controls for gender, age at lumbar puncture, disease duration at lumbar puncture, MMSE, and CSF biomarkers were carried out and pairwise comparisons investigated if the global test was statistically significant; differences in brain region volumes between amnestic AD and PCA were explored. These tests used linear regression (allowing for variability to differ between groups where necessary), Fisher's exact, Mann–Whitney U test, and Kruskal–Wallis followed by Dunn's Test, as appropriate.
All analyses involving Ng allowed for there being two Ng assay platforms and the truncated lower Ng values. Data were available for 18 individuals with both ELISA and MSD Ng assay values; 11 were from this study's ELISA group and seven were not eligible for this study. Using these data, a censored normal linear regression, which allowed for truncated lower values, of ELISA Ng on MSD Ng provided estimated regression coefficients that were used to convert this study's 43 MSD assay Ng measures to the ELISA scale: ELISA = 60.54924 + (0.7723643 × MSD). The combined dataset (N = 114) comprised 71 ELISA Ng measures and the 43 MSD to ELISA converted Ng measures.
All CSF Ng values were log transformed to improve normality. Estimates of the pairwise differences in Ng between controls and the two patient groups were obtained using a censored normal regression model, to allow for truncated values, adjusting for age at LP, gender and whether or not the Ng value had been converted (“assay type”). The model allowed for variability to differ between patient groups and also between the unconverted and converted Ng groups.
Subsequent analyses used the same type of model and adjustment variables but did not include controls, for whom brain imaging data were not available; these analyses also additionally adjusted for time between diagnosis and lumbar puncture (“disease duration”). Combining the PCA and amnestic AD patient groups, we estimated the association between log‐transformed Ng and four CSF biomarkers (Aβ42, T‐tau, log‐transformed Tau/Aβ42 ratio and NFL). Finally, we estimated the association between log‐transformed Ng and brain volume measures (whole brain, average hippocampi, right and left hippocampi, right and left entorhinal, right and left parahippocampal gyrus, right and left angular gyrus, right and left superior parietal lobules, right and left frontal cortex and right and left occipital cortex), additionally adjusting for TIV. All results on the log‐transformed scale were back‐transformed to geometric means, and percentage differences between such geometric means, as appropriate.
As a sensitivity analysis, all analyses were repeated using the smaller dataset (N = 71) of only the participants who had ELISA data. This removed the issue of converted data and reduced the proportion of truncated data.
Results
Demographic and core CSF biomarker information
Demographic, core CSF AD biomarker characteristics, and differences between the participant groups, are shown in Table 1. We found differences in age across the groups with controls being statistically significantly younger than the amnestic AD and PCA groups (P < 0.01 for both comparisons with controls). The mean disease duration was longer in the PCA group than the amnestic AD group (P = 0.04). Observed median MMSE scores were the same for the two patient groups and the distributions similar (25th %tile – 75th %tile: PCA 20–26; amnestic AD 16–26) and, as expected, higher in controls (29–30). Both amnestic AD and PCA patients had significantly lower mean CSF Aβ42 levels (374 and 367 pg/mL, respectively) than controls (1058 pg/mL) and higher median T‐tau values (762 and 511 pg/mL, respectively) than controls (256 pg/mL) (P ≤ 0.0001 for all comparisons with controls); median T‐Tau was also 50% higher in amnestic AD than PCA (P = 0.03). As expected, the amnestic AD and PCA groups had a higher median T‐tau/Aβ42 ratio (2.15 and 1.45, respectively) than controls (0.26) (P < 0.0001 for both comparisons with controls). Median CSF NFL levels were higher in the amnestic AD and PCA groups (1408 and 1360 pg/mL, respectively) than controls (560 pg/mL) (P < 0.0001 for both comparisons with controls). There were no statistically significant differences between amnestic AD and PCA CSF for Aβ42 (P = 0.83), Tau/Aβ42 (P = 0.11), NFL (P = 0.49).
Table 1.
Demographic and CSF biomarker characteristics of 114 participants
| PCA | Amnestic AD | Controls | P* | |
|---|---|---|---|---|
| N | 19 | 68 | 27 | |
| Gender, female/male (% female) | 12/7 (63.2%) | 43/25 (63.2%) | 16/11 (59.3%) | G: 0.96a |
| Age at LP (years) |
65.6 (6.9) [55–80] |
63.1 (6.6) [48–80] |
58.6 (8.5) [43–71] |
G: 0.003b
PvC: 0.001b AvC: 0.006b PvA: 0.19b |
| Disease duration at LP (months) |
55.5 (25.3) [15–96] |
42.1 (22.4) [9–120] |
N/A | PvA: 0.04c |
| MMSE |
23 (20–26) [11–29] (Missing = 2) |
23 (16–26) [2–30] (Missing = 9) |
30 (29–30) [28–30] |
G: 0.0001d
PvC: <0.0001d AvC: <0.0001d PvA: 0.44d |
| Aβ42 (pg/mL) |
367.1 (120.6) [117–629] |
374.1 (156.3) [101–729] |
1058 (239.7) [568–1601] |
G: <0.0001e
PvC: <0.001e AvC: <0.001e PvA: 0.83e |
| T‐tau (pg/mL) |
511 (412–690) [299–977] |
762 (453–1045) [135–2722] |
256 (188–338) [107–473] |
G: 0.0001d
PvC: 0.0001d AvC: <0.0001d PvA: 0.03d |
| Tau/Aβ42 ratio |
1.45 (1.03–2.11) [0.64–6.93] |
2.15 (1.09–3.78) [0.54–11.88] |
0.26 (0.20–0.30) [0.13–0.33] |
G: 0.0001d
PvC: <0.0001d AvC: <0.0001d PvA: 0.11d |
| NFL (pg/mL) |
1360 (1149–1539) [911–2157] |
1408 (1112–1853) [424–4446] (Missing=1) |
560 (444–808) [257–2232] |
G: 0.0001d
PvC: <0.0001d AvC: <0.0001d PvA: 0.49 |
| Ng (pg/mL) |
ELISA (n = 14) 372.6 (273.0, 468.0) [193.3–629.3] MSD (n = 5) 232.0 (120.0, 334.0) [120.0–462.2] |
ELISA (n = 49) 501.0 (328.7, 724.9) [125.0–1516.0] MSD (n = 19) 474.9 (264.3, 623.9) [120.0–2483.9] |
ELISA (n = 8) 256.3 (125.0, 331.9) [125.0–363.8] MSD (n = 19) 195.8 (120.0, 296.7) [120.0–838.6] |
See text (Results) |
LP, lumbar puncture; MMSE, mini mental state examination; Aβ42, amyloid‐beta 1–42; T‐tau, total tau; NFL, neurofilament light; Ng, neurogranin.
The values presented are median (25th, 75th %tile) [range], except for Gender, Age at LP (years), Disease duration (months), and Aβ42 (pg/mL) which are presented as mean (SD) [range] or number (percentage), as appropriate. *P‐values are shown for: G: a global test: null hypothesis is no differences between the groups; PvC, PCA versus Amnestic AD; AvC, Amnestic AD versus PCA; PvC, PCA versus Amnestic AD.
aFisher's exact; bordinary least squares linear regression; cMann–Whitney U test; dKruskal–Wallis and Dunn's test; egeneralized least squares linear regression, allowing for variability to differ between groups.
CSF Ng in AD and PCA patients
CSF Ng concentrations for the combined dataset were higher in amnestic AD patients (median 466.0 pg/mL, 25th %tile–75th %tile 294.0–684.5) compared to PCA patients (median 370.2 pg/mL, 239.7–417.5) and controls (218.9 pg/mL, 153.2–291.2) (Fig. 1). See Table 1 for separate ELISA and unconverted MSD assay medians and ranges. After adjustment for age at LP, gender, assay type, and allowing for truncated values (see Statistical analysis section), geometric mean CSF Ng concentrations were an estimated 137.1% higher in amnestic AD patients (95% CI 68.9–233.0), and 67.8% higher in PCA patients (95% CI 16.7–141.2), than controls (P < 0.001 and P = 0.005 respectively). CSF Ng levels were an estimated 41.3% higher in amnestic AD patients than PCA patients (95% CI 12.0–78.4) (P = 0.004). When comparing the two patient groups only, and after additionally adjusting for disease duration, CSF Ng concentrations were an estimated 30.7% higher in amnestic AD patients (95% CI 3.5–65.0) compared to PCA patients (P = 0.025).
Figure 1.
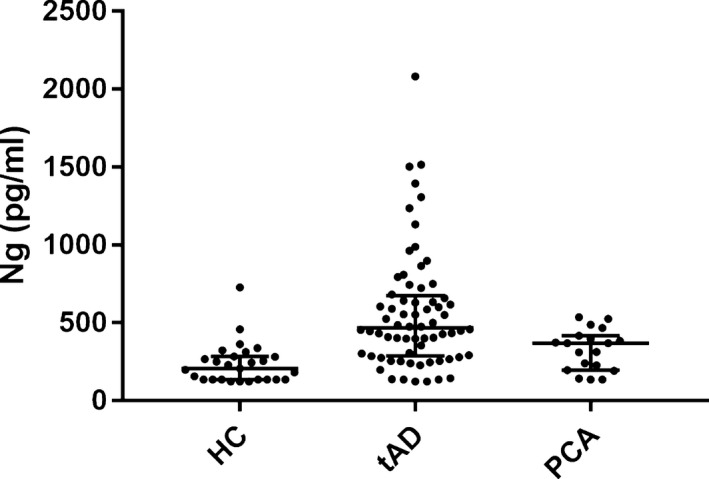
Scatter plots displaying CSF Ng concentrations (Elisa‐ including converted MSD to Elisa values) in controls and AD variants. The lower, middle, and upper lines of the box correspond to the 25th %tile, median, and 75th %tilerespectively. Ng, neurogranin; PCA, posterior cortical atrophy.
Regional brain volumes in AD variants
Whole and regional brain volumes were compared between amnestic AD and PCA patients (Table 2). After adjusting for TIV, whole brain volume was on average 27,333 mm3 smaller (95% CI 56,625 smaller —1959 larger) in PCA patients, although this was not found to be statistically significant (P = 0.07). Evidence of statistically significant differences in regional brain volumes between the patient groups, after adjusting for TIV, were found in the left hippocampus, which was on average 223 mm3 larger (95% CI 19–426; P = 0.03) in the PCA group (observed mean 3457 mm3) compared to amnestic AD patients (3209 mm3); the right superior parietal lobule, which was on average 975 mm3 smaller (95% CI 1556–394; P = 0.001) in the PCA group (observed mean 6601 mm3) compared to amnestic AD patients (7501 mm3); and in the left superior parietal lobule, which was on average 1081 mm3 smaller (95% CI 1567–596; P < 0.001) in the PCA group (observed mean 6634 mm3) compared to amnestic AD patients (7637 mm3). There were no significant differences in frontal lobe volumes between groups, but, as expected, occipital lobe volumes were smaller in PCA compared to AD (P = 0.01 right, P = 0.03 left, Table 2). No statistically significant differences were found for other brain regions and there was no material difference in P values reported in Table 2 after adjusting for age at LP, gender and disease duration.
Table 2.
Regional brain volumes compared between AD and PCA
| PCA | Amnestic AD | P * | |
|---|---|---|---|
| N | 19 | 68 | |
| Whole brain (mm3) |
951,948 (86,033) [797,538–1142903] |
969,757 (126,099) [655,039–1314248] |
0.07a |
| Right hippocampus (mm3) |
3514 (604) [ 2256–4584] |
3336 (449) [ 2291–4303] |
0.18b |
| Left hippocampus (mm3) |
3457 (484) [2574–4249] |
3209 (435) 2174–4141] |
0.03b |
| Right EC (mm3) |
2253 (355) [1462–2811] |
2212 (349) [1435–3150] |
0.83b |
| Left EC (mm3) |
1954 (293) [1438–2452] |
1896 (286) [1211–2524] |
0.52b |
| Right PHG (mm3) |
2892 (532) [2062–3828] |
2894 (400) [2073–3831] |
0.63b |
| Left PHG (mm3) |
3166 (565) [2186–4099] |
3064 (432) [2238–4050] |
0.47b |
| Right AG (mm3) |
6454 (1213) [4313–8436] |
6598 (1231) [3839–9522] |
0.43b |
| Left AG (mm3) |
6118 (1084) [4432–8624] |
6341 (1279) [3848–9971] |
0.31b |
| Right SPL (mm3) |
6601 (1546) [3692–9704] |
7501 (1200) [4987–9811] |
0.001b |
| Left SPL (mm3) |
6634 (1303) [4541–8899] |
7627 (1417) [4203–10,541] |
<0.001a |
| Right frontal (mm3) |
117,454 (10,627) [98,247–134,058] |
113,799 (16,065) [74,928–153,361] |
0.36b |
| Left frontal (mm3) |
117,674 (11,092) [99,542–139,374] |
113,732 (15,730) [73,511–146,192] |
0.30b |
| Right occipital (mm3) |
40,392 (5798) [31,240–52,095] |
42,783 (6570) [25,259–57,635] |
0.01b |
| Left occipital (mm3) |
38,567 (6443) [25,675–53786] |
40,677 (6025) [28,131–56,436] |
0.03b |
EC, entorhinal cortex; PHG, parahippocampal gyrus; AG, angular gyrus; SPL, superior parietal lobule.
Data presented as (mean (SD), range [ ]); *P‐values are shown for a pairwise test: null hypothesis is no differences between the groups, adjusting for TIV; ageneralized least squares linear regression, allowing for variability to differ between groups; bordinary least squares linear regression.
Associations between CSF Ng and regional brain volumes and CSF AD biomarkers
We investigated associations between CSF Ng and whole and regional brain volumes as well as the core CSF biomarkers including T‐tau, Aβ42, tau/ Aβ42ratio and NFL in the patient group dataset. These models adjusted for age at LP, gender, assay type, disease duration and, when modeling brain volume regions, TIV. We found no statistically significant evidence of associations between CSF Ng and whole brain and individual regional volumes.
Ng was strongly associated with T‐tau (P < 0.001) in the patient group dataset, with an estimated adjusted 0.11% (95% CI 0.08–0.13) increase in the geometric mean of CSF Ng for every 1 pg/mL increase in T‐tau. There was no evidence (P = 0.70) of an association with Aβ42 (estimated adjusted 0.02% (95% CI −0.07 to 0.11) increase in Ng for every 1 pg/mL increase in Aβ42) but a strong association was, as expected, found with Tau/ Aβ42 ratio (P < 0.001), with an estimated 0.44% increase (95% CI 0.26–0.61) in the geometric mean of Ng for every 1% increase in the geometric mean of T‐tau/ Aβ42 ratio. There was also evidence of an association with NFL (P = 0.005), with an estimated adjusted 0.03% increase (95% CI 0.01–0.05) in the geometric mean of Ng for every 1 pg/mL increase in NFL.
Sensitivity analysis
Rerunning the analyses using only the 71 participants with ELISA assay Ng data produced results that were consistent with those reported above using the full dataset (data not shown).
Discussion
The main findings of this study are: (1) that compared to controls, CSF Ng is elevated in both amnestic AD and PCA‐AD, and that Ng is significantly higher in amnestic AD compared to PCA‐AD; (2) CSF Ng levels are strongly associated with T‐tau and less strongly with NFL; (3) T‐tau levels but not NFL or Aβ42 are significantly different between AD and PCA‐AD; and (4) despite there being significant differences in the expected regional brain volumes between amnestic AD and PCA‐AD, there were no significant relationships between Ng levels and brain volumes.
Although a number of studies have demonstrated elevated levels of Ng in AD, this is to our knowledge the first study to explore CSF Ng in different AD phenotypes. We confirm previous findings that Ng is elevated in “typical” AD, extending it to demonstrate that it is also elevated in one of the canonical AD variants, PCA. While PCA is not invariably due to AD, Alzheimer pathology is the commonest underlying cause, and our cases all had a core CSF biomarker signature in keeping with AD, providing further evidence for Ng being a specific marker for AD. However, our finding that Ng levels in PCA were intermediate between controls and typical AD and significantly different from both – independent of disease severity – suggests that variation in Ng level is likely due to other factors, for example difference in disease topology or to other pathological mechanisms.
Previous studies have shown that individuals presenting with the visual variant of AD, PCA, have proportionately more regional atrophy, cortical thinning and tau deposition in the occipitoparietal regions than hippocampi and other medial temporal structures compared to those with typical memory led AD.24, 25, 26 Our imaging findings are broadly in keeping with these, with the PCA patients having larger hippocampal and small parietal lobe volumes than patients with typical AD. Previous studies have shown correlations between CSF Ng and whole brain volume and regional volumes, including the mesial temporal lobe, entorhinal cortex, hippocampus and parrahippocampus.27, 28 Conversely, this trend has not been observed in other brain regions, supporting the hypothesis that Ng release may be more likely to occur when neurodegeneration involves these areas. We were unable to demonstrate relationships between Ng concentration and regional volume across the patient cohort. There are a number of possible reasons for this. The elevated Ng in AD may not be specific to hippocampal atrophy and may represent more widespread global degeneration, perhaps in AD related areas including the parietal cortex. Our results may be a consequence of small sample size and the cross‐sectional nature of this study, noting that previous studies have reported no association between CSF Ng and hippocampal volumes in a similar cross‐sectional analysis6; it may be that rates of atrophy derived from longitudinal assessments would better reflect the rate of synaptic loss. Finally, the CSF levels of neuronal and synaptic proteins such as tau and Ng are believed to reflect the state (or intensity) of the degenerative process, while MRI measurements of cortical volumes reflect the stage of degeneration,29 and thus these measures may not be expected to correlate well.
To explore differential pathological mechanisms, we compared other AD‐related biomarkers between PCA and amnestic AD. There were no significant differences in Aβ42 or NFL, but similar to the Ng findings, T‐tau was significantly lower in PCA than typical AD. When we compared levels with other AD biomarkers, we similarly observed no association between Ng and CSF Aβ42 levels. This is perhaps not surprising, since amyloid deposition probably occurs many years before synaptic loss and neurodegeneration,30 and previous studies have shown no correlation between synaptic loss and amyloid plaque burden. In keeping with other studies,7 we did however find T‐tau and Ng levels to be strongly associated (which would also be in keeping with reports of lower levels of CSF T‐tau in PCA compared to other AD phenotypes31, 32), and a relationship – albeit not as strongly – between Ng and NFL.
While all are ostensibly markers of neurodegeneration, these three proteins are not thought to be mechanistically linked but thought to have very different roles in neuronal cell physiology. The exact biological role of T‐tau is not clear; it is from a biomarker perspective thought to be a surrogate marker of neurodegeneration33 which is elevated in AD and some other neurodegenerative diseases, although interestingly not in all tau‐opathies. However, it is becoming apparent that tau may not be a simple damage biomarker, but is secreted from cells under physiological conditions, a process which is regulated by neuronal activity.34, 35NFL is a marker of large fiber myelinated axonal degeneration,36 is elevated in neurodegeneration independent of amyloid deposition,27 and has been shown to be a prognostic marker in a large number of different neurodegenerative conditions.37, 38 By contrast, Ng is a synaptic marker, which does not appear to be elevated in other degenerative diseases that involve atrophy/degeneration in cortical regions,8, 9 such as FTD, suggestive of a mechanism of release independent of cell death per se. In the case of AD, it is also not clear whether Ng is released at the synapse during neuronal cell death,39 or whether abnormal secretion occurs due to other physiological stressors.
Our data therefore provide some new insights into the relationship between T‐tau, Ng and NFL. Ng is the only marker that appears relatively specific for AD, and in established AD, T‐tau and Ng appear to be closely related. This does however not necessarily imply that the two are mechanistically linked, for which further work is required. NFL by contrast, appears to be a measure of disease intensity (i.e., prognosis) across a wide range of diseases, likely through a mechanistically distinct and similar (i.e., long myelinated axons) process.
This study has a number of limitations. Two assay versions were used to quantify CSF Ng concentration but we were able to allow for this by running some samples on both platforms, both demonstrating a very tight correlation between the values obtained in both (data not shown, P < 0.0001) and allowing for appropriate conversion of MSD assay values to the ELISA scale. We also demonstrate consistency of results when the analyses were repeated using only ELISA assay data. Our study contained relatively small numbers of subjects, an inevitable consequence of PCA being a relatively rare condition, but we note that our numbers compare well to other similar studies.31, 40 We did not have longitudinal measures of biomarkers or atrophy which would allow for a more detailed analysis of the dynamic changes and relationships.
These results, of the present study, extend the finding that Ng is a marker for AD pathology to atypical forms of the disease, suggesting that it may be a useful diagnostic marker across the AD spectrum. The lack of evidence for a relationship between Ng and patterns of atrophy suggest that the significant differences in Ng between patients with amnestic AD and PCA‐AD may relate to factors other than disease topography, although this requires histopathological confirmation. The differential relationships between Ng, T‐tau and NFL in PCA, amnestic AD, and across the spectrum of disease provide evidence for mechanistically distinct and variably coupled markers of neurodegeneration. Measurement of all three may provide a means of assessing the mechanistic effects of drug therapies targeting different aspects of AD pathogenesis.
Author Contributions
HW, RWP, ASG, NCF, HZ, and JMS were responsible for study concept and design, data acquisition and analysis, and drafting the manuscript and figures. US, EP, CFS, NKM, and KB were responsible for data acquisition and analysis. TP and CF were responsible for statistical analysis, drafting (TP), and editing the manuscript and figures.
Conflicts of Interest
HW declares no conflicts of interest.
RWP declares no conflicts of interest.
ASG declares no conflicts of interest.
TP declares no conflict of interest.
CF declares no conflict of interest.
US declares no conflict of interest.
CFS received an honorarium for a lecture to GE Healthcare.
NKM declares no conflict of interest.
ML declares no conflict of interest.
KB is cofounder of Brain Biomarker Solutions, a GU Ventures‐based platform company at the University of Gothenburg and has served at advisory boards for IBL International, Roche Diagnostics and given lectures for Fujirebio Europe.
NCF reports consultancy fees from Biogen, GSK, Sanofi, Novartis Pharma AG, Eli Lilly, Janssen Alzheimer's Immunotherapy, Roche/Genentech paid to the institution.
HZ is cofounder of Brain Biomarker Solutions in Gothenburg AB, a GU Venture‐based platform company at the University of Gothenburg, Sweden and has served at advisory boards for Roche Diagnostics, Eli Lilly and Pharmasum Therapeutics.
JMS reports personal fees from Roche and Eli Lilly, grants and nonfinancial support from AVID Radiopharmaceuticals, and serves on a data safety management board for Axon Neuroscience.
Acknowledgments
We are grateful to the patients, their carers, and the control subjects who took part in the study. Sample analysis was supported by the Swedish Research Council, Swedish State Support for Clinical Research, the Knut and Alice Wallenberg Foundation, the Torsten Söderberg Foundation, Frimurarestiftelsen and Swedish Brain Foundation. The study was supported by the Wolfson Foundation and Alzheimer's Research UK. JMS is supported by the National Institute for Health Research Queen Square Dementia Biomedical Research Unit, the National Institute for Health Research University College London Hospital Biomedical Research Centre, Wolfson Foundation, Engineering and Physical Sciences Research Council (EP/J020990/1), Medical Research Council (CSUB19166), Alzheimer's Research UK (ARUK‐Network 2012–6‐ICE; ARUK‐PG2014–1946), and the European Union's Horizon 2020 research and innovation programme (grant 666992). This article presents independent research supported by the Leonard Wolfson Experimental Neurology Centre (LWENC) Clinical Research Facility and BRC at the UCL Institute of Neurology and UCLH‐National Hospital for Neurology and Neurosurgery, London, UK.
Funding Statement
This work was funded by Wolfson Foundation grant ; Alzheimer's Research UK grants ARUK‐Network 2012–6‐ICE and ARUK‐PG2014–1946; National Institute for Health Research Queen Square Dementia Biomedical Research Unit grant ; National Institute for Health Research University College London Hospital Biomedical Research Centre grant ; Engineering and Physical Sciences Research Council grant EP/J020990/1; Medical Research Council grant CSUB19166; European Union's Horizon 2020 research and innovation programme grant 666992.
References
- 1. Dekosky S, Scheff S. Synapse loss in frontal cortex biopsies in Alzheimer's disease: correlation with cognitive severity. Ann Neurol 1990;27:457–464. [DOI] [PubMed] [Google Scholar]
- 2. Terry RD, Masliah E, Salmon DP, et al. Physical basis of cognitive alterations in Alzheimer's disease: synapse loss is the major correlate of cognitive impairment. Ann Neurol 1991;30:572–580. [DOI] [PubMed] [Google Scholar]
- 3. Blennow K, Bogdanovic N, Alafuzoff I, et al. Synaptic pathology in Alzheimer's disease: relation to severity of dementia, but not to senile plaques, neurofibrillary tangles, or the ApoE4 allele. J Neural Transm 1996;103:603–618. [DOI] [PubMed] [Google Scholar]
- 4. Kvartsberg H, Duits FH, Ingelsson M, et al. Cerebrospinal fluid levels of the synaptic protein neurogranin correlates with cognitive decline in prodromal Alzheimer's disease. Alzheimer's Dement 2015;11:1180–1190. [DOI] [PubMed] [Google Scholar]
- 5. Sanfilippo C, Forlenza O, Zetterberg H, Blennow K. Increased neurogranin concentrations in cerebrospinal fluid of Alzheimer's disease and in mild cognitive impairment due to AD. J Neural Transm 2016;123:1443–1447. [DOI] [PubMed] [Google Scholar]
- 6. Portelius E, Zetterberg H, Skillbäck T, et al. Cerebrospinal fluid neurogranin: relation to cognition and neurodegeneration in Alzheimer's disease. Brain 2015;138:3373–3385. [DOI] [PMC free article] [PubMed] [Google Scholar]
- 7. Kester MI, Teunissen CE, Crimmins DL, et al. Neurogranin as a cerebrospinal fluid biomarker for synaptic loss in symptomatic Alzheimer disease. JAMA Neurol 2015;72:1275–1280. [DOI] [PMC free article] [PubMed] [Google Scholar]
- 8. Janelidze S, Hertze J, Zetterberg H, et al. Cerebrospinal fluid neurogranin and YKL‐40 as biomarkers of Alzheimer's disease. Ann Clin Transl Neurol 2015;3:12–20. [DOI] [PMC free article] [PubMed] [Google Scholar]
- 9. Wellington H, Paterson RW, Portelius E, et al. Increased CSF neurogranin concentration is specific to Alzheimer disease. Neurology 2016;86:829–835. [DOI] [PMC free article] [PubMed] [Google Scholar]
- 10. Davidsson P, Blennow K. Neurochemical dissection of synaptic pathology in Alzheimer's disease. Int Psychogeriatr 1998;10:11–23. [DOI] [PubMed] [Google Scholar]
- 11. Reddy PH, Mani G, Park BS, et al. Differential loss of synaptic proteins in Alzheimer's disease: implications for synaptic dysfunction. J Alzheimer's Dis 2005;7:103–117. [DOI] [PubMed] [Google Scholar]
- 12. Likeman M, Anderson VM, Stevens JM, et al. Visual assessment of atrophy on magnetic resonance imaging in the diagnosis of pathologically confirmed young‐onset dementias. Arch Neurol 2005;62:1410. [DOI] [PubMed] [Google Scholar]
- 13. Chang J, Schumacher E, Coulter P, et al. Dendritic translocation of RC3/ neurogranin mRNA in normal aging, Alzheimer's disease and fronto‐temporal dementia. J Neuropathol Exp Neurol 1997;56:1105–1118. [DOI] [PubMed] [Google Scholar]
- 14. Dubois B, Feldman HH, Jacova C, et al. Advancing research diagnostic criteria for Alzheimer's disease: the IWG‐2 criteria. Lancet Neurol 2014;13:614–629. [DOI] [PubMed] [Google Scholar]
- 15. Duits FH, Teunissen CE, Bouwman FH, et al. The cerebrospinal fluid “Alzheimer profile”: easily said, but what does it mean? Alzheimer's Dement 2014;10:713–723. [DOI] [PubMed] [Google Scholar]
- 16. Tang‐Wai D, Graff‐Radford N, Boeve B, et al. Clinical, genetic, and neuropathologic characteristics of posterior cortical atrophy. Neurology 2004;63:1168–1174. [DOI] [PubMed] [Google Scholar]
- 17. Crutch SJ, Schott JM, Rabinovici GD, et al. Consensus classification of posterior cortical atrophy. Alzheimer's Dement 2017;13:870–884. [DOI] [PMC free article] [PubMed] [Google Scholar]
- 18. Magdalinou NK, Paterson RW, Schott JM, et al. A panel of nine cerebrospinal fluid biomarkers may identify patients with atypical Parkinsonian syndromes. J Neurol Neurosurg Psychiatry 2015;86:1240–1247. [DOI] [PMC free article] [PubMed] [Google Scholar]
- 19. Schmidt K, Mattis P, Adams J, Nestor P. Alternate‐form reliability of the Dementia Rating Scale‐2. Arch Clin Neuropsychol 2005;20:435–441. [DOI] [PubMed] [Google Scholar]
- 20. Folstein MF, Folstein SE, McHugh PR. “Mini‐Mental State”. A practical method for grading the cognitive state of patients for the clinician. J Psychiatr Res 1975;12:189–198. [DOI] [PubMed] [Google Scholar]
- 21. Blennow K, Hampel H, Weiner M, Zetterberg H. Cerebrospinal fluid and plasma biomarkers in Alzheimer disease. Nat Rev Neurol 2010;6:131–144. [DOI] [PubMed] [Google Scholar]
- 22. Cardoso MJ, Modat M, Wolz R, et al. Geodesic information flows: spatially‐variant graphs and their application to segmentation and fusion. IEEE Trans Med Imaging 2015;34:1976–1988. [DOI] [PubMed] [Google Scholar]
- 23. Malone IB, Leung KK, Clegg S, et al. Accurate automatic estimation of total intracranial volume: a nuisance variable with less nuisance. NeuroImage 2015;104:366–372. [DOI] [PMC free article] [PubMed] [Google Scholar]
- 24. Lehmann M, Crutch SJ, Ridgway GR, et al. Cortical thickness and voxel‐based morphometry in posterior cortical atrophy and typical Alzheimer's disease. Neurobiol Aging 2011;32:1466–1476. [DOI] [PubMed] [Google Scholar]
- 25. Cho H, Choi JY, Lee SH, et al. Excessive tau accumulation in the parieto‐occipital cortex characterizes early‐onset Alzheimer's disease. Neurobiol Aging 2017;53:103–111. [DOI] [PubMed] [Google Scholar]
- 26. Xia C, Makaretz S, Caso C, et al. Association of in vivo [18F]AV‐1451 tau PET imaging results with cortical atrophy and symptoms in typical and atypical Alzheimer disease. JAMA Neurol 2017;74:427–436. [DOI] [PMC free article] [PubMed] [Google Scholar]
- 27. Mattsson N, Insel PS, Palmqvist S, et al. Cerebrospinal fluid tau, neurogranin, and neurofilament light in Alzheimer's disease. EMBO Mol Med 2016;8:1184–1196. [DOI] [PMC free article] [PubMed] [Google Scholar]
- 28. Tarawneh R, D'Angelo G, Crimmins D, et al. Diagnostic and prognostic utility of the synaptic marker neurogranin in Alzheimer disease. JAMA Neurol 2016;73:561–571. [DOI] [PMC free article] [PubMed] [Google Scholar]
- 29. Blennow K, Hampel H. CSF markers for incipient Alzheimer's disease. Lancet Neurol 2003;2:605–613. [DOI] [PubMed] [Google Scholar]
- 30. Jack CR, Knopman DS, Jagust WJ, et al. Tracking pathophysiological processes in Alzheimer's disease: an updated hypothetical model of dynamic biomarkers. Lancet Neurol 2013;12:207–216. [DOI] [PMC free article] [PubMed] [Google Scholar]
- 31. Paterson RW, Toombs J, Slattery CF, et al. Dissecting IWG‐2 typical and atypical Alzheimer's disease: insights from cerebrospinal fluid analysis. J Neurol 2015;262:2722–2730. [DOI] [PubMed] [Google Scholar]
- 32. Ossenkoppele R, Mattsson N, Teunissen CE, et al. Cerebrospinal fluid biomarkers and cerebral atrophy in distinct clinical variants of probable Alzheimer's disease. Neurobiol Aging 2015;36:2340–2347. [DOI] [PMC free article] [PubMed] [Google Scholar]
- 33. Hampel H, Blennow K, Shaw LM, et al. Total and phosphorylated tau protein as biological markers of Alzheimer's disease. Exp Gerontol 2010;45:30–40. [DOI] [PMC free article] [PubMed] [Google Scholar]
- 34. Pooler AM, Phillips EC, Lau DHW, et al. Physiological release of endogenous tau is stimulated by neuronal activity. EMBO Rep 2013;14:389–394. [DOI] [PMC free article] [PubMed] [Google Scholar]
- 35. Yamada K, Holth JK, Liao F, et al. Neuronal activity regulates extracellular tau in vivo. J Exp Med 2014;211:387–393. [DOI] [PMC free article] [PubMed] [Google Scholar]
- 36. Zetterberg H, Skillbäck T, Mattsson N, et al. Association of cerebrospinal fluid neurofilament light concentration with Alzheimer disease progression. JAMA Neurol 2016;73:60–67. [DOI] [PMC free article] [PubMed] [Google Scholar]
- 37. Gaiani A, Martinelli I, Bello L, et al. Diagnostic and prognostic biomarkers in amyotrophic lateral sclerosis. JAMA Neurol 2017;74:525–532. [DOI] [PMC free article] [PubMed] [Google Scholar]
- 38. Salzer J, Svenningsson A, Sundström P. Neurofilament light as a prognostic marker in multiple sclerosis. Mult Scler J 2010;16:287–292. [DOI] [PubMed] [Google Scholar]
- 39. Jackson JS, Witton J, Johnson JD, et al. Altered synapse stability in the early stages of tauopathy. Cell Rep 2017;18:3063–3068. [DOI] [PMC free article] [PubMed] [Google Scholar]
- 40. Coppi E, Ferrari L, Santangelo R, et al. Further evidence about the crucial role of CSF biomarkers in diagnosis of posterior cortical atrophy. Neurol Sci 2014;35:785–787. [DOI] [PubMed] [Google Scholar]