

The dynamic process of a nucleophilic addition reaction has been investigated in graphene-molecule single-molecule junctions.
Abstract
Single-molecule detection can reveal time trajectories and reaction pathways of individual intermediates/transition states in chemical reactions and biological processes, which is of fundamental importance to elucidate their intrinsic mechanisms. We present a reliable, label-free single-molecule approach that allows us to directly explore the dynamic process of basic chemical reactions at the single-event level by using stable graphene-molecule single-molecule junctions. These junctions are constructed by covalently connecting a single molecule with a 9-fluorenone center to nanogapped graphene electrodes. For the first time, real-time single-molecule electrical measurements unambiguously show reproducible large-amplitude two-level fluctuations that are highly dependent on solvent environments in a nucleophilic addition reaction of hydroxylamine to a carbonyl group. Both theoretical simulations and ensemble experiments prove that this observation originates from the reversible transition between the reactant and a new intermediate state within a time scale of a few microseconds. These investigations open up a new route that is able to be immediately applied to probe fast single-molecule physics or biophysics with high time resolution, making an important contribution to broad fields beyond reaction chemistry.
INTRODUCTION
The investigation of reaction dynamics at the single-molecule level is of crucial importance for exploring the intrinsic mechanisms of chemical reactions and biological processes. To this end, discrete optical or mechanical methods—such as fluorescence resonance energy transfer (1, 2), scanning near-field optical microscopy (SNOM) (3, 4), fluorescence correlation spectroscopy (5–7), Raman spectroscopy (8), scanning probe microscopy (9), optical tweezers (10), and so on—have been developed to monitor the reaction processes of biological macromolecular systems, such as gene expression and protein/DNA folding. Because these traditional methods have the high special resolution and high sensitivity to the change of molecular configuration, the flickering fluorescent signals detected in real time can reflect the details of the dynamic reaction processes. For example, SNOM was used to detect the fluorescent signals produced in Au nanoparticle–based catalytic reactions (4). Each fluorescent trajectory was attributed to one turnover of the catalytic reaction, which reveals the interplay of catalysis, heterogeneous reactivity, and surface structural dynamics in nanocatalysts at the single-molecule level. However, because of unavoidable complex fluorescent labeling, short-lasting time caused by fluorescent bleaching, and limited maximum temporal resolution of milliseconds, there are still formidable challenges, which hamper the application of optical methods to the investigation of single-molecule reaction dynamics, in particular for small-molecule chemical reactions. In this regard, developing novel effective methods with label-free capabilities and time resolutions high enough to study fast single-molecule dynamics would be invaluable.
As a promising alternative, electrical methods, which are based on the correlation between the conductive characteristics and the molecular information, can overcome the previously mentioned challenges (11, 12). In comparison with optical methods, electrical measurements can realize direct, ultrasensitive current detection for extended periods, which allows continuous monitoring of single reaction events with high accuracy, as demonstrated by single-molecule biosensors formed through point functionalization of single-walled carbon nanotubes (13–16) or silicon nanowires (17, 18). These approaches to build up electrical circuits for biological detection imply the prospect of electrical measurements in single-molecule reaction dynamics investigation. Among single-molecule electrical methods, single-molecule electronics (19), which have started to move from simple descriptions of charge transport and branch out in interdisciplinary directions, are potentially attractive because these devices can be naturally extended to perform electrical detection with single-molecule/single-event sensitivity. Previous reports have proved that through molecular engineering, various single-molecule devices with desired functions can be created, such as diodes (20, 21), memory (22), transistors (23), and switches (24, 25). Here, we exemplify a universal strategy based on a reliable platform of graphene-molecule-graphene single-molecule junctions (GMG-SMJs) (26) to carry out single-molecule reaction analysis. In combination with the theoretical calculation, we found a new intermediate in a nucleophilic addition reaction, which showed the reversible transition to its reactant with strong solvent dependence, thus leading to distinct two-level current oscillations in in situ electrical measurements. In comparison with another method based on different molecular junctions (27), the key to our success in realizing fast single-molecule reaction dynamics is the strong stability of GMG-SMJs, which are covalently constructed through robust chemical amide linkages between molecules and electrodes (24, 28).
RESULTS AND DISCUSSION
Device fabrication and electrical characterization
High-quality single-layer graphene was synthesized via a low-pressure chemical vapor deposition process on copper foils. After the graphene was transferred to pretreated SiO2/Si wafers, Au electrodes were subsequently patterned by using photolithography through thermal evaporation. Nanogapped graphene point contact arrays with carboxylic acid groups on each side were fabricated by a dash-line lithographic method (figs. S1 and S2). GMG-SMJs were then constructed by covalently connecting functional molecules terminated by amino groups with graphene electrodes through the formation of amide linkages (26). Note that these GMG-SMJ devices are stable and can endure chemical treatments and external stimuli, thus providing a reliable platform for single-molecule chemical or biological detection in solution. We chose a nucleophilic addition reaction to carbonyl groups as a representative because it is one of the most important elementary reactions in chemical systems. To study the dynamic process of such a reaction, we designed and synthesized a molecular wire with 9-fluorenone as the functional center and terminated with amino groups on both sides (Fig. 1A). The nucleophilic addition reaction is expected to take place between the carbonyl group on the molecule and NH2OH in solution. More specifically, with base catalysis, the carbonyl group first reacts with NH2OH to form an intermediate, and then the loss of an H2O molecule produces an oxime as the product. The device structure is shown in Fig. 1A. More details of molecular synthesis and device fabrication can be found in Materials and Methods (see also the Supplementary Materials).
Fig. 1. Device structure and electrical characterization of GMG-SMJs.
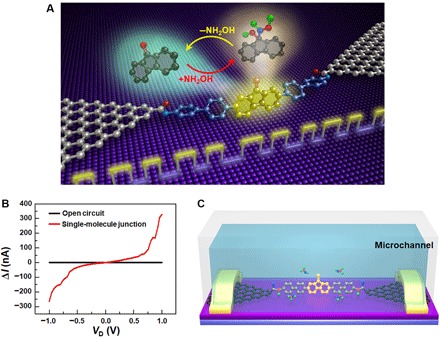
(A) Schematic representation of the device structure that highlights a reversible nucleophilic addition reaction of hydroxylamine to a carbonyl group. (B) I-V curves of open circuits with graphene point contacts (black) and single-molecule junctions after molecular connection (red). (C) Schematic diagram of real-time measurement setup with a home-made microchannel for single-molecule dynamics characterization.
To confirm the formation of GMG-SMJs, we studied the current-voltage relation (I-V) curves of the devices as shown in Fig. 1B. It can be observed that the current dropped to zero after precise etching by oxygen plasma (black) and recovered to some extent after molecular assembly (red), indicating a successful single-molecule connection. Under optimized conditions, the connection yield was found to be ~20%, that is, ~30 of 169 devices on the same silicon chip showed increased conductance. In combination with the comparison of the dI/dV-V curves (orbital-mediated tunneling spectroscopy) between working GMG-SMJs (connected by the functional fluorenone molecule) and control GMG-SMJs reconnected by a [1,1′:4′,1′′:4′′,1′′′:4′′′,1′′′′:4′′′′,1′′′′′-sexiphenyl]-4,4′′′′′-diamine molecule (without the functional ketone center) (figs. S3 and S5), we can conclude that the signals originate from the single-molecule connection (29), consistent with the statistical analysis (see the Supplementary Materials).
Real-time electrical measurement
To study the reaction dynamics between carbonyl groups on GMG-SMJs and NH2OH in solution, we used a home-made microchannel to confine the solution in a small channel area on the top of the GMG-SMJs (Fig. 1C). As the whole GMG-SMJ device was surrounded by the solution containing NH2OH and a base catalyst, the reaction between the carbonyl group in the central part of the junction and NH2OH in the outside solution took place. With a small bias of 300 mV applied between source and drain electrodes, real-time current [I(t)] signals were measured to follow the reaction. A set of typical real-time current recording signals are shown in Fig. 2 (A and B), which were obtained from a GMG-SMJ device when immersed in a mixed ethanol (EtOH)/H2O (1:4) solution with NH2OH (10 μM) and NaOH (10 μM) at 298 K. ΔI(t) signals with a period of 1 s, which were obtained by subtracting the baseline to produce a filtered data set for showing the intrinsic signal fluctuations (15), illustrated two distinct reproducible states with dwell times of a few microseconds. However, for both working GMG-SMJs measured without the reaction solution (fig. S4) and control GMG-SMJs (the same as used above) measured under the same conditions (fig. S6), no signal fluctuations were observed, proving that the two distinct states only originated from the interaction between the functional fluorenone center and NH2OH. More data during long-time measurements are provided in fig. S3 (see the Supplementary Materials), demonstrating good device stability.
Fig. 2. Real-time current recordings and mechanism analysis.
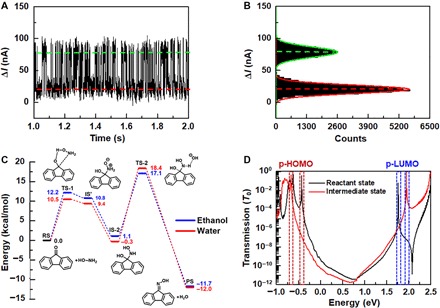
(A) Real-time current recordings of single-molecule reaction dynamics during 1 s measured in a mixed EtOH/H2O (1:4) solution with NH2OH (10 μM) and NaOH (10 μM) at 298 K. VD = 300 mV. (B) Corresponding histogram of current values, showing a bimodal current distribution. (C) Reaction mechanism and energy profile of 9-fluorenone reacting with NH2OH. Energies are shown in kcal/mol. (D) Transmission spectra of GMG-SMJs with the RS and the IS. The red and blue rectangles mark the transmission peaks of p-HOMO and p-LUMO for both states.
Theoretical simulation
To understand the reactive events associated with the two current states, we performed computational studies on the nucleophilic addition of the 9-fluorenone functional center by NH2OH. Reaction energy profiles (Fig. 2C) show that the reaction proceeds through the nucleophilic addition of NH2OH to 9-fluorenone [reactant state (RS)] to form a shallow intermediate (IS’) via a transition state (TS-1). IS’ transforms to a stable intermediate state (IS) by proton transfer in water, which is presumably very fast. The calculated free energy barriers for the forward (RS to IS) and backward (IS to RS) reactions are ~10.5 and ~10.8 kcal/mol in water solvent, and ~12.2 and ~11.1 kcal/mol in EtOH solvent, respectively. Subsequently, the intermediate (IS) is deprotonated by a hydroxyl ion via a TS-2 to form the final product state (PS). The free energy barriers for the forward and backward reactions between IS and PS are ~18.7 and ~30.4 kcal/mol in water solvent, and ~16 and ~28.8 kcal/mol in EtOH solvent, respectively. According to the transition state theory, the reaction rate constant (k) can be calculated from these reaction energy barriers from the following equation
where ΔG* is the reaction energy barrier, R is the gas constant, T is the reaction temperature, kB is the Boltzmann constant, h is the Plank constant, and κ is the pre-exponential factor, which approximates to 1 for single-molecule reactions. From calculated reaction rates (Table 1), it was found that the reversible reaction between RS and IS happens at a time scale of a few microseconds. In contrast, thousands of hours would be required for the reverse reaction, from PS to IS, to occur. Therefore, it is reasonable to conclude that the observed high- and low-conductance states with dwell times of a few microseconds should be assigned to the reversible reaction between the RS and IS in the GMG-SMJ devices. To further prove this hypothesis, liquid chromatography–mass spectrometry (LC-MS) analyses of the 9-fluorenone monomer reaction under the same conditions were carried out. As shown in fig. S8, a characteristic MS peak for the IS was successfully detected, demonstrating the presence of a stable IS in the reaction.
Table 1. Energy barriers and reaction rates of each step during the reaction.
Theoretical calculations are only performed under pure EtOH and water conditions, which are good enough to confirm the experimental results. Lifetimes of the low and high states during the first-step reaction with different proportions of water are summarized. The second step is not observed in single-molecule experiments because of a high-energy barrier. NA, not applicable.
| Solvent (EtOH/water) | 100% EtOH | 80%/20% | 60%/40% | 40%/60% | 20%/80% | 100% water | |||
| Energy barriers | Calculation results | First step | Forward | 12.2 kcal/mol | NA | NA | NA | NA | 10.5 kcal/mol |
| Backward | 11.1 kcal/mol | NA | NA | NA | NA | 10.8 kcal/mol | |||
| Second step | Forward | 16.0 kcal/mol | NA | NA | NA | NA | 18.7 kcal/mol | ||
| Backward | 28.8 kcal/mol | NA | NA | NA | NA | 30.4 kcal/mol | |||
| Experiment results | First step | Forward | 13.0 kcal/mol | 12.9 kcal/mol | 12.5 kcal/mol | 12.5 kcal/mol | 12.4 kcal/mol | 11.9 kcal/mol | |
| Backward | 12.1 kcal/mol | 12.0 kcal/mol | 12.6 kcal/mol | 12.6 kcal/mol | 12.7 kcal/mol | 12.8 kcal/mol | |||
| Second step | Forward | NA | NA | NA | NA | NA | NA | ||
| Backward | NA | NA | NA | NA | NA | NA | |||
| Reaction rates | Calculation results | First step | Forward | 138.53 μs | NA | NA | NA | NA | 7.88 μs |
| Backward | 21.68 μs | NA | NA | NA | NA | 13.07 μs | |||
| Second step | Forward | 84.03 ms | NA | NA | NA | NA | 7,976.09 ms | ||
| Backward | 55,229.7 hours | NA | NA | NA | NA | 844,695.89 hours | |||
| Experiment results | First step | Forward | 557 μs | 466 μs | 230 μs | 228 μs | 207 μs | 86 μs | |
| Backward | 127 μs | 98.2 μs | 261 μs | 268 μs | 298 μs | 369 μs | |||
| Second step | Forward | NA | NA | NA | NA | NA | NA | ||
| Backward | NA | NA | NA | NA | NA | NA | |||
To attribute the high- and low-conductance states to the corresponding RS and IS, we investigated the conductance properties of the device with the RS and IS using theoretical calculations (see Materials and Methods and “Computational analyses” in the Supplementary Materials). Transmission spectra for GMG-SMJs in different states are shown in Fig. 2D (black and red curves for the RS and IS, respectively). It can be observed that for the RS, the energy gap between the perturbed highest occupied molecular orbital (p-HOMO) and lowest unoccupied molecular orbital (p-LUMO) is smaller than the gap for the IS. The p-HOMO and p-LUMO of the RS are closer to the graphene Fermi level than those of the IS. At low bias voltages, the conductance contribution from p-HOMO is dominant, as reflected by transmission spectra according to the Landauer formula (19). In Fig. 2D, the conductance for the RS near the Fermi level is higher than that for the IS. In addition to this, the molecularly projected self-consistent Hamiltonians (MPSHs) show more delocalized p-HOMOs in the RS than that in the IS (fig. S7), thus providing a better conductive channel for the RS. Collectively, these results consistently prove that the high-conductance state of GMG-SMJ devices in the experimental I-V plots should be attributed to the RS, whereas the low-conductance state corresponds to the IS.
Solvent-dependent measurement
As mentioned above, different solvents (EtOH and water) affect the energy barriers of the reversible reaction between RS and IS (Fig. 2C). To investigate such a solvent effect, the reversible reaction on GMG-SMJs was monitored in solutions with a series of ratios of EtOH and water. Consistently, signal fluctuations between two states were observed GMG-SMJs in all solutions. From both I-t curves and corresponding histograms of each state (Fig. 3), we found that, with increasing the ratio of water from 0 to 100%, the proportion of the low state grew markedly, whereas the proportion of the high state decreased gradually at the same time. This indicates that the low state, which corresponds to the intermediate, forms at higher proportions, and the reactant tends to convert into the intermediate in the water solution. We believe that this phenomenon is related to the solvent polarity. When the reactant converts into the intermediate, the dipole moment of the reaction center increases. This leads to the enhancement of the intermediate and solvent’s interaction, which favors the intermediate to stabilize. To prove this, we performed further experiments by adding cyclohexane into EtOH to decrease the solvent polarity (fig. S10). With increasing cyclohexane, the proportion of the high state increased gradually, whereas the proportion of the low state decreased gradually at the same time. This indicates that the high state, which corresponds to the reactant, forms at higher proportion, and the polar intermediate tends to convert into the reactant in the cyclohexane/EtOH solution.
Fig. 3. Solvent-dependent measurements.
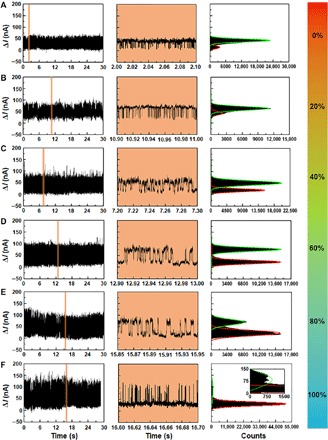
I-t curves, corresponding enlarged I-t curves marked in orange, and corresponding histograms of a working GMG-SMJ device measured in the reaction solutions with 0% (A), 20% (B), 40% (C), 60% (D), 80% (E), and 100% (F) water in EtOH at 298 K. VD = 300 mV.
Statistical analyses
By using a QUB software, the idealized fitting of I-t curves with two plain states (Fig. 4A) can be derived from a segmental k-means method based on hidden Markov model analysis (30). Meanwhile, the time intervals of the high- and low-conductance states (Thigh or Tlow) can also be obtained from the idealized fitting. Plots of the dwell times of each state obtained by frequency analysis for a typical signal in the reactive solution (Vwater = 60%) were shown in Fig. 4 (B and C). These plots can be fitted by a single-exponential function, the parameter of which in the exponential part corresponds to the average lifetimes (τhigh or τlow) of the corresponding states. On the basis of this analysis, the average lifetimes of the high- and low-conductance states in solutions with different water contents can be obtained (fig. S9 and Table 1). With the increase of water concentration from 0 to 100%, τhigh (the lifetime of the RS), decreases significantly from ~557 to ~86 μs (Fig. 4D). This corresponds to the reduced energy barrier from ~12.2 to ~10.5 kcal/mol for the forward reaction from the reactant to the intermediate (Fig. 2C), leading to the acceleration of the reaction rate. Meanwhile, τlow (the lifetime of the intermediate) shows an obvious increase from ~127 μs in EtOH to ~369 μs in water. This indicates that aqueous solutions can stabilize the intermediate and keep a stable configuration for a relatively prolonged period. Correspondingly, the energy of the intermediate (IS) drops from ~1.1 kcal/mol in EtOH to ~−0.3 kcal/mol in water. However, the energy barrier for the backward reaction (from the intermediate to the reactant) only has a slight change from ~11.1 to ~10.8 kcal/mol. The little mismatch between the energy barriers and the reaction rates might be due to the less degree of freedom of the carbonyl group in the junction. Because the molecule with the functional center was covalently bonded to the graphene electrodes on the silicon wafer, the carbonyl group could only make contact with NH2OH at a certain angle, thus reducing the possibility of the reaction. In the theoretical calculation, the free 9-fluorenone was used as the active center, which facilitates the reaction easier. This also leads to the fact that the obtained lifetimes from the fitting data are also a little bit slower than those obtained from the theoretical calculation results (Table 1). In addition, biphenyl groups are used as the spacers on both sides of the 9-fluorenone center for adjusting the molecular size and anchoring the molecule to the electrode, which may also reduce the reactivity of the carbonyl group. Despite all these, both theoretical simulations and experimental results consistently demonstrated a strong solvent-dependent carbonyl addition reaction proceeding in a time scale of microseconds.
Fig. 4. Kinetic analyses of single-molecule reaction dynamics.
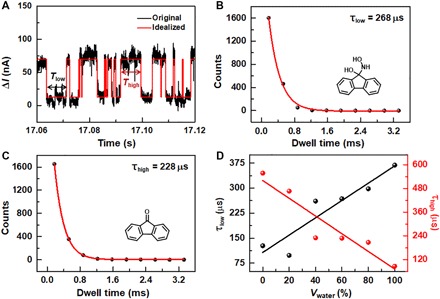
(A) I-t curve (black) of GMG-SMJs immersed in the reactive solution (Vwater = 60%) at 298 K and the idealized fit (red) obtained from a segmental k-means method based on hidden Markov model analysis by using a QUB software. (B and C) Plots of time intervals of the low-current (B) and high-current (C) states in the idealized fit in (A). Single-exponential fittings derive the lifetimes of each state (τlow and τhigh). (D) Lifetime changes of the low (black) and the high states (red) with different proportions of water.
CONCLUSION
This work demonstrates how applying the unique platform of GMG-SMJs can reveal the dynamical process of many basic chemical reactions at the single-molecule level in in situ solution environments. Both experimental results and theoretical simulations consistently show and interpret the reversible reaction process between the RS and the IS in the nucleophilic addition of NH2OH to a carbonyl group, leading to two distinct signal oscillations within the time scale of a few microseconds. The discovery of the intermediate is further proved by the ensemble experiment and its strong solvent dependence on the reaction rate. By taking advantage of label-free capability, high-speed data acquisition, and good device stability, this nanocircuit-based structure is able to directly study stochastic fluctuations under equilibrium conditions and to reveal time trajectories and reaction pathways of individual intermediate/transition states in nonequilibrated systems in either chemical reactions, such as SN1/SN2 substitution and nucleophilic/electrophilic addition, or biological processes, such as protein folding and DNA sequencing. Therefore, this method, in combination with molecular engineering, offers infinite opportunities to understand molecular mechanisms at the molecular level for a wide variety of chemical and biochemical applications.
MATERIALS AND METHODS
Molecular synthesis
The details of molecular synthesis are provided in the Supplementary Materials.
Device fabrication and molecular connection
As shown in fig. S1, graphene-based field-effect transistor (FET) arrays were fabricated via a previous method (31). High-quality monolayer graphene was grown on copper films via a low-pressure chemical vapor deposition process. Polymethyl methacrylate (495 PMMA A6, MicroChem) was spin-coated on the copper film as a supporting layer, and a FeCl3 solution (0.5 M) was used to etch away the copper. After etching, monolayer graphene was transferred to precleaned silicon substrates. Through three steps of photolithography, two steps of thermal evaporation, and one step of oxygen plasma etching, graphene microribbons were obtained, and patterned metallic electrodes (8 nm Cr/60 nm Au) separated by 8 μm were formed on the substrate. To prevent any direct contact and leakage between the solution and metal electrodes during electrical measurements, a 50-nm-thick silicon oxide layer was deposited by electron beam thermal evaporation after thermal deposition of metallic electrodes. Next, polymethyl methacrylate (950 PMMA A5, MicroChem) was spin-coated on the devices as the mask, and high-resolution electron beam lithography was used to open a window precursor by a DesignCAD file with a 5-nm-wide dashed line. Finally, through the open window, precise oxygen plasma etching was applied to form carboxylic acid–functionalized graphene point contact arrays (fig. S2).
For molecular connection, the resulted devices were immersed in a pyridine solution containing 0.2 mM fluorenone molecules and 6 mM 1-ethyl-3-(3-dimethylaminopropyl) carbodiimide hydrochloride, a well-known carbodiimide dehydrating/activating agent. After reaction for 36 hours, the devices were taken out from solution, washed with abundant acetone and deionized water, and dried with a N2 gas stream.
Electrical characterization
Device characterizations were carried out by using an Agilent 4155C semiconductor characterization system and a Karl Suss (PM5) manual probe station. A locked-in amplifier (HF2LI, Zurich Instruments Ltd.) with a low-noise current preamplifier (SR570, Stanford Research Systems) was used to monitor the junction conductance at a small bias voltage of 300 mV and a sample rate of 57.6 kSa/s in real time. During real-time measurements, the molecular conductance fluctuated owing to the rearrangement of molecule orbitals corresponding to the chemical reaction processes.
LC-MS characterization
An EtOH/water solution (VEtOH/ = 1:1) that contains 9-fluorenone (10 μM), NaOH (10 μM), and NH2OH (10 μM) was used as the sample solution. LC-MS analyses were carried out on a high-performance liquid chromatography (Agilent 1200) system coupled to a quadrupole time-of-flight mass spectrometer (Agilent 6510) equipped with an electrospray ionization (ESI) source by using an Agilent Zorbax Eclipse Plus C18 reversed-phase column (150 mm × 2.1 mm, 5 μm). Analytes were eluted with a 100% methanol mobile phase with a flow rate of 0.25 ml/min. During the analyses, the ESI parameters were set as follows: source temperature, 350°C; drying gas, 6 liters/min; nebulizer, 241.325 kPa; capillary voltage, 2 kV for negative mode; fragmentor, 175 V; tandem mass spectrometry precursor ion mass/charge ratio, 210.055; and collision energy, 5 V.
Theoretical calculation
The geometries and energies (9-fluorenone as the reactant) of the intermediates and transition structures were obtained using the M06-2X (32) method and triple ζ basis set 6-311+G(d,p) combined with SMD water or EtOH solvation (33), except TS-2, where the geometry was optimized in the gas phase, whereas the energy was calculated using the SMD solvation model. Frequency calculations were also performed at the optimization level to verify that the intermediates have no imaginary frequency, whereas the transition structures have only one imaginary frequency. All calculations were performed with Gaussian 09 software (34). The reported Gibbs free energies were calculated at 298 K and 1 M. Corrections were made by adding RTln(c0s/c0g) (that is, about 1.89 kcal/mol) to the energies of all structures, where c0s is the standard molar concentration in aqueous solution (1 M), c0g is the standard molar concentration in gas phase (0.0446 M), and R is the gas constant. The calculated reaction rates from reaction energy barriers (Fig. 2C) are shown in Table 1, which are consistent with our experimental results.
For the calculation of transmission spectra, the geometry optimization of both molecules and molecular devices was conducted by the semiempirical method AM1 (35), which is implemented in the Gaussian package. The molecular orbitals were then calculated using the hybrid functional B3LYP (36) with a basis set of 6-31+G* (37). Transmission spectra of molecular junctions were investigated using the Atomistix toolkit package (38, 39). We chose the local density approximation with a single ζ basis set, a mesh cutoff of 150 Ry, and a vacuum space of 15 Å following our previous studies (24, 37). The MPSH spectra of the reactant and the intermediate near the graphene Fermi level are shown in fig. S7, in which the HOMO of the RS is more delocalized, providing a better conductive channel.
Supplementary Material
Acknowledgments
Funding: We acknowledge primary financial support from the National Key R&D Program of China (2017YFA0204901), the National Natural Science Foundation of China (21373014, 21727806, 21372226, and 21661132006), the Strategic Priority Research Program of the CAS (XDB12010300), and the National Science Foundation of America (CHE 1361104). We are particularly grateful to Z. Liu of Peking University for providing the computing source and helpful discussions. Author contributions: X.G., D.Z., and K.N.H. conceived and designed the experiments. J.G., C.J., C.G., and D.S. performed the device fabrication and most of the device characterizations. Y.L., J.W., and Z.Y. provided the theoretical results. Z.L. and D.Z. carried out the molecular synthesis. J.G., C.J., Y.L., K.N.H., D.Z., and X.G. analyzed the data and wrote the paper. All authors discussed the results and commented on the manuscript. Competing interests: The authors declare that they have no competing interests. Data and materials availability: All data needed to evaluate the conclusions in the paper are present in the paper and/or the Supplementary Materials. Additional data related to this paper may be requested from the authors.
SUPPLEMENTARY MATERIALS
Supplementary material for this article is available at http://advances.sciencemag.org/cgi/content/full/4/2/eaar2177/DC1
Supplementary Materials and Methods
scheme S1. Synthetic routes to the carbonyl molecule (compound 4) with a 9-fluorenone functional center and −NH2-terminal groups.
fig. S1. Schematic of fabricating graphene FET arrays.
fig. S2. Schematic of fabricating graphene point contact arrays.
fig. S3. Electrical measurements of single-molecule junctions.
fig. S4. I-t curves and corresponding histograms of current values for a typical GMG-SMJ in different environments at 298 K.
fig. S5. Representative I-V and dI/dV-V curves of a control device.
fig. S6. I-t curves and corresponding histograms of current values for a control device in different environments at 298 K.
fig. S7. MPSH spectra of the molecule in the RS and IS.
fig. S8. LC-MS characterizations of the two-step reaction.
fig. S9. Plots of time intervals.
fig. S10. Additional solvent-dependent experiments.
Reference (40)
REFERENCES AND NOTES
- 1.Roy R., Hohng S., Ha T., A practical guide to single-molecule FRET. Nat. Methods 5, 507–516 (2008). [DOI] [PMC free article] [PubMed] [Google Scholar]
- 2.Deindl S., Hwang W. L., Hota S. K.,Blosser T. R., Prasad P., Bartholomew B., Zhuang X., ISWI remodelers slide nucleosomes with coordinated multi-base-pair entry steps and single-base-pair exit steps. Cell 152, 442–452 (2013). [DOI] [PMC free article] [PubMed] [Google Scholar]
- 3.Lu H. P., Xun L., Xie X. S., Single-molecule enzymatic dynamics. Science 282, 1877–1882 (1998). [DOI] [PubMed] [Google Scholar]
- 4.Xu W., Kong J. S., Yeh Y.-T. E., Chen P., Single-molecule nanocatalysis reveals heterogeneous reaction pathways and catalytic dynamics. Nat. Mater. 7, 992–996 (2008). [DOI] [PubMed] [Google Scholar]
- 5.Bonnet G., Krichevsky O., Libchaber A., Kinetics of conformational fluctuations in DNA hairpin-loops. Proc. Natl. Acad. Sci. U.S.A. 95, 8602–8606 (1998). [DOI] [PMC free article] [PubMed] [Google Scholar]
- 6.Yin Y., Yang L., Zheng G., Gu C., Yi C., He C., Gao Y. Q., Zhao X. S., Dynamics of spontaneous flipping of a mismatched base in DNA duplex. Proc. Natl. Acad. Sci. U.S.A. 111, 8043–8048 (2014). [DOI] [PMC free article] [PubMed] [Google Scholar]
- 7.Hess S. T., Huang S., Heikal A. A., Webb W. W., Biological and chemical applications of fluorescence correlation spectroscopy: A review. Biochemistry 41, 679–705 (2002). [DOI] [PubMed] [Google Scholar]
- 8.Cao Y. C., Jin R., Mirkin C. A., Nanoparticles with Raman spectroscopic fingerprints for DNA and RNA detection. Science 297, 1536–1540 (2002). [DOI] [PubMed] [Google Scholar]
- 9.Uchihashi T., Iino R., Ando T., Noji H., High-speed atomic force microscopy reveals rotary catalysis of rotorless F1-ATPase. Science 333, 755–758 (2011). [DOI] [PubMed] [Google Scholar]
- 10.Heller I., Hoekstra T. P., King G. A., Peterman E. J., Wuite G. J., Optical tweezers analysis of DNA–protein complexes. Chem. Rev. 114, 3087–3119 (2014). [DOI] [PubMed] [Google Scholar]
- 11.Guo X., Single-molecule electrical biosensors based on single-walled carbon nanotubes. Adv. Mater. 25, 3397–3408 (2013). [DOI] [PubMed] [Google Scholar]
- 12.Gu C., Jia C., Guo X., Single-molecule electrical detection with real-time label-free capability and ultrasensitivity. Small Methods 1, 1700071 (2017). [Google Scholar]
- 13.Choi Y., Olsen T. J., Sims P. C., Moody I. S., Corso B. L., Dang M. N., Weiss G. A., Collins P. G., Dissecting single-molecule signal transduction in carbon nanotube circuits with protein engineering. Nano Lett. 13, 625–631 (2013). [DOI] [PMC free article] [PubMed] [Google Scholar]
- 14.Sorgenfrei S., Chiu C.-y., Gonzalez R. L. Jr, Yu Y.-J., Kim P., Nuckolls C., Shepard K. L., Label-free single-molecule detection of DNA-hybridization kinetics with a carbon nanotube field-effect transistor. Nat. Nanotechnol. 6, 126–132 (2011). [DOI] [PMC free article] [PubMed] [Google Scholar]
- 15.Choi Y. K., Moody I. S., Sims P. C., Hunt S. R., Corso B. L., Perez I., Weiss G. A., Collins P. G., Single-molecule lysozyme dynamics monitored by an electronic circuit. Science 335, 319–324 (2012). [DOI] [PMC free article] [PubMed] [Google Scholar]
- 16.Bouilly D. Hon J., Daly N. S., Trocchia S., Vernick S., Yu J., Warren S., Wu Y., Gonzalez R. L. Jr, Shepard K. L., Nuckolls C., Single-molecule reaction chemistry in patterned nanowells. Nano Lett. 16, 4679–4685 (2016). [DOI] [PMC free article] [PubMed] [Google Scholar]
- 17.Wang J., Shen F., Wang Z., He G., Qin J., Cheng N., Yao M., Li L., Guo X., Point decoration of silicon nanowires: An approach toward single-molecule electrical detection. Angew. Chem. Int. Ed. 53, 5038–5043 (2014). [DOI] [PubMed] [Google Scholar]
- 18.He G., Li J., Ci H., Qi C., Guo X., Direct measurement of single-molecule DNA hybridization dynamics with single-base resolution. Angew. Chem. Int. Ed. 55, 9036–9040 (2016). [DOI] [PubMed] [Google Scholar]
- 19.Xiang D., Wang X., Jia C., Lee T., Guo X., Molecular-scale electronics: From concept to function. Chem. Rev. 116, 4318–4440 (2016). [DOI] [PubMed] [Google Scholar]
- 20.Díez-Pérez I., Hihath J., Lee Y., Yu L., Adamska L., Kozhushner M. A., Oleynik I. I., Tao N., Rectification and stability of a single molecular diode with controlled orientation. Nat. Chem. 1, 635–641 (2009). [DOI] [PubMed] [Google Scholar]
- 21.Guo C., Wang K., Zerah-Harush E., Hamill J., Wang B., Dubi Y., Xu B., Molecular rectifier composed of DNA with high rectification ratio enabled by intercalation. Nat. Chem. 8, 484–490 (2016). [DOI] [PubMed] [Google Scholar]
- 22.Lee J., Chang H., Kim S., Bang G. S., Lee H., Molecular monolayer nonvolatile memory with tunable molecules. Angew. Chem. Int. Ed. 121, 8653–8656 (2009). [DOI] [PubMed] [Google Scholar]
- 23.Song H. Kim Y., Jang Y. H., Jeong H., Reed M. A., Lee T., Observation of molecular orbital gating. Nature 462, 1039–1043 (2009). [DOI] [PubMed] [Google Scholar]
- 24.Jia C., Migliore A., Xin N., Huang S., Wang J., Yang Q., Wang S., Chen H., Wang D., Feng B., Liu Z., Zhang G., Qu D.-H., Tian H., Ratner M. A., Xu H. Q., Nitzan A., Guo X., Covalently bonded single-molecule junctions with stable and reversible photoswitched conductivity. Science 352, 1443–1445 (2016). [DOI] [PubMed] [Google Scholar]
- 25.Su T. A., Li H., Steigerwald M. L., Venkataraman L., Nuckolls C., Stereoelectronic switching in single-molecule junctions. Nat. Chem. 7, 215–220 (2015). [DOI] [PubMed] [Google Scholar]
- 26.Jia C., Ma B., Xin N., Guo X., Carbon electrode–molecule junctions: A reliable platform for molecular electronics. Acc. Chem. Res. 48, 2565–2575 (2015). [DOI] [PubMed] [Google Scholar]
- 27.Zhao Y., Ashcroft B., Zhang P., Liu H., Sen S., Song W., Im J., Gyarfas B., Manna S., Biswas S., Borges C., Lindsay S., Single-molecule spectroscopy of amino acids and peptides by recognition tunnelling. Nat. Nanotechnol. 9, 466–473 (2014). [DOI] [PMC free article] [PubMed] [Google Scholar]
- 28.Wen H., Li W., Chen J., He G., Li L., Olson M. A., Sue A. C. H., Stoddart J. F., Guo X., Complex formation dynamics in a single-molecule electronic device. Sci. Adv. 2, e1601113 (2016). [DOI] [PMC free article] [PubMed] [Google Scholar]
- 29.Karthäuser S., Control of molecule-based transport for future molecular devices. J. Phys. Condens. Matter 23, 013001 (2011). [DOI] [PubMed] [Google Scholar]
- 30.Milescu L. S., Yildiz A., Selvin P. R., Sachs F., Maximum likelihood estimation of molecular motor kinetics from staircase dwell-time sequences. Biophys. J. 91, 1156–1168 (2006). [DOI] [PMC free article] [PubMed] [Google Scholar]
- 31.Cao Y., Dong S., Liu S., He L., Gan L., Yu X., Steigerwald M. L., Wu X., Liu Z., Guo X., Building high-throughput molecular junctions using indented graphene point contacts. Angew. Chem. Int. Ed. 51, 12228–12232 (2012). [DOI] [PubMed] [Google Scholar]
- 32.Zhao Y., Truhlar D. G., The M06 suite of density functionals for main group thermochemistry, thermochemical kinetics, noncovalent interactions, excited states, and transition elements: Two new functionals and systematic testing of four M06-class functionals and 12 other functionals. Theor. Chem. Acc. 120, 215–241 (2008). [Google Scholar]
- 33.Marenich A. V., Cramer C. J., Truhlar D. G., Universal solvation model based on solute electron density and on a continuum model of the solvent defined by the bulk dielectric constant and atomic surface tensions. J. Phys. Chem. B 113, 6378–6396 (2009). [DOI] [PubMed] [Google Scholar]
- 34.M. J. Frisch, G. W. Trucks, H. B. Schlegel, G. E. Scuseria, M. A. Robb, J. R. Cheeseman, G. Scalmani, V. Barone, B. Mennucci, G. A. Petersson, H. Nakatsuji, M. Caricato, X. Li, H. P. Hratchian, A. F. Izmaylov, J. Bloino, G. Zheng, J. L. Sonnenberg, M. Hada, M. Ehara, K. Toyota, R. Fukuda, J. Hasegawa, M. Ishida, T. Nakajima, Y. Honda, O. Kitao, H. Nakai, T. Vreven, J. A. Montgomery Jr., J. E. Peralta, F. Ogliaro, M. Bearpark, J. J. Heyd, E. Brothers, K. N. Kudin, V. N. Staroverov, T. Keith, R. Kobayashi, J. Normand, K. Raghavachari, A. Rendell, J. C. Burant, S. S. Iyengar, J. Tomasi, M. Cossi, N. Rega, J. M. Millam, M. Klene, J. E. Knox, J. B. Cross, V. Bakken, C. Adamo, J. Jaramillo, R. Gomperts, R. E. Stratmann, O. Yazyev, A. J. Austin, R. Cammi, C. Pomelli, J. W. Ochterski, R. L. Martin, K. Morokuma, V. G. Zakrzewski, G. A. Voth, P. Salvador, J. J. Dannenberg, S. Dapprich, A. D. Daniels, O. Farkas, J. B. Foresman, J. V. Ortiz, J. Cioslowski, D. J. Fox, Gaussian 09, Revision D.01 (Gaussian Inc., 2013).
- 35.Dewar M. J. S., Zoebisch E. G., Healy E. F., Stewart J. J. P., Development and use of quantum mechanical molecular models. 76. AM1: A new general purpose quantum mechanical molecular model. J. Am. Chem. Soc. 107, 3902–3909 (1985). [Google Scholar]
- 36.Becke A. D., Density-functional thermochemistry. III. The role of exact exchange. J. Chem. Phys. 98, 5648–5652 (1993). [Google Scholar]
- 37.Jia C. Wang J., Yao C., Cao Y., Zhong Y., Liu Z., Liu Z., Guo X., Conductance switching and mechanisms in single-molecule junctions. Angew. Chem. Int. Ed. 52, 8666–8670 (2013). [DOI] [PubMed] [Google Scholar]
- 38.Taylor J., Guo H., Wang J., Ab initio modeling of quantum transport properties of molecular electronic devices. Phys. Rev. B 63, 245407 (2001). [Google Scholar]
- 39.Brandbyge M., Mozos J.-L., Ordejón P., Taylor J., Stokbro K., Density-functional method for nonequilibrium electron transport. Phys. Rev. B 65, 165401 (2002). [Google Scholar]
- 40.Xin N., Wang J., Jia C., Liu Z., Zhang X., Yu C., Li M., Wang S., Gong Y., Sun H., Zhang G., Liu Z., Zhang G., Liao J., Zhang D., Guo X., Stereoelectronic effect-induced conductance switching in aromatic chain single-molecule junctions. Nano Lett. 17, 856–861 (2017). [DOI] [PubMed] [Google Scholar]
Associated Data
This section collects any data citations, data availability statements, or supplementary materials included in this article.
Supplementary Materials
Supplementary material for this article is available at http://advances.sciencemag.org/cgi/content/full/4/2/eaar2177/DC1
Supplementary Materials and Methods
scheme S1. Synthetic routes to the carbonyl molecule (compound 4) with a 9-fluorenone functional center and −NH2-terminal groups.
fig. S1. Schematic of fabricating graphene FET arrays.
fig. S2. Schematic of fabricating graphene point contact arrays.
fig. S3. Electrical measurements of single-molecule junctions.
fig. S4. I-t curves and corresponding histograms of current values for a typical GMG-SMJ in different environments at 298 K.
fig. S5. Representative I-V and dI/dV-V curves of a control device.
fig. S6. I-t curves and corresponding histograms of current values for a control device in different environments at 298 K.
fig. S7. MPSH spectra of the molecule in the RS and IS.
fig. S8. LC-MS characterizations of the two-step reaction.
fig. S9. Plots of time intervals.
fig. S10. Additional solvent-dependent experiments.
Reference (40)