Fig. 3.
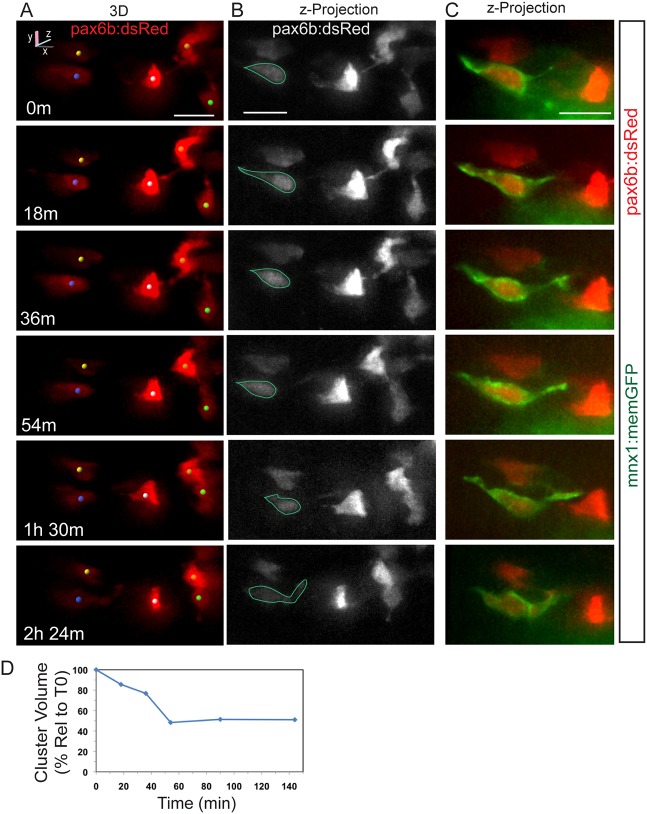
Dynamics of cell coalescence. (A) Confocal time-lapse series of Notch inhibitor-treated pax6b:dsRed; mnx1:memGFP transgenic at 7 dpf showing coalescence of two cells (orange and green spheres). Three additional cells are tracked. (B) z-projections corresponding to the images in A, with RFP rendered in gray. (C) Two-channel, close-up view of the GFP+ cell outlined in B (green). A subset of images from a series collected at 18 min intervals are shown. Scale bars: 10 µm. (D) Quantitation of clustering (as in Fig. 2D) for the tracked cells indicated in A.

