Abstract
Objective
To examine sex differences in cerebrovascular pathologies (CVPs) as seen on fluid-attenuated inversion recovery (FLAIR) MRI and in cardiovascular and metabolic risk factors in a population-based cognitively unimpaired cohort and to examine whether sex is independently associated with FLAIR findings after accounting for differences in important midlife risk factors.
Methods
We identified 1,301 cognitively normal participants (663 men and 638 women) enrolled in the Mayo Clinic Study of Aging (age ≥70 years) who had FLAIR MRI and ascertained total burden of white matter (WM) hyperintensities (WMH), subcortical infarctions, and cortical infarctions. We compared CVPs and midlife and late-life vascular risk factors between men and women. We fit regression models with each CVP as an outcome, treating age, sex, and midlife risk factors as predictors.
Results
Women had significantly greater WMH volume relative to their WM volume compared to men (2.8% vs 2.4% of WM, p < 0.001), while men had a greater frequency of cortical infarctions compared to women (9% vs 4%, p < 0.001). Subcortical infarctions were equally common in men and women (20%). In regression modeling after adjustment for WM volume, the mean WMH volume difference between men and women was of the same magnitude as a 7-year difference in age. In contrast, men had 2.2-greater relative odds of having a cortical infarction compared to women. These sex differences persisted even after adjustment for midlife vascular risk factors.
Conclusions
There were important sex differences in CVP findings on FLAIR in cognitively unimpaired elderly. Understanding these sex differences could aid in the development of sex-specific preventive strategies.
Cerebrovascular pathologies (CVP) are one of the most common pathologies concurrent with late-onset mixed dementias.1 While the impact of CVP on cognitive decline has gained attention in recent years, sex differences in CVP have not been thoroughly investigated. Studies typically correct for sex differences instead of investigating sex-specific mechanisms. Identifying and understanding potential sex differences also could aid in the development of sex-specific preventive strategies.
The most commonly used imaging technique to visualize lesions associated with CVP is T2-weighted or fluid-attenuated inversion recovery (FLAIR) MRI, which is used to visualize white matter (WM) hyperintensities (WMH) and infarctions. Both of these features have been shown to increase the risk of dementia and stroke.2,3 The goal of this study was 2-fold: to explore sex differences in the frequency of CVPs on FLAIR MRI (WMH volume, subcortical infarctions, and cortical infarctions) and cardiovascular and metabolic risk factors in a population-based cognitively unimpaired cohort and to examine whether sex is independently associated with CVP after accounting for differences in major midlife risk factors. We used data from cognitively unimpaired individuals participating in the population-based Mayo Clinic Study of Aging (MCSA).
Methods
Selection of participants
MCSA is a population-based cohort study of Olmsted County, Minnesota, residents designed to investigate the epidemiology of healthy aging, mild cognitive impairment, and dementia.4,5 The MCSA cohort represents a sex- and age-stratified random sample of Olmsted County residents, with individuals randomly selected from an enumeration with the Rochester Epidemiology Project (REP) medical records linkage system.6–9 For the current study, the inclusion criteria were cognitively unimpaired participants using a consensus criteria4,5 (based on nurse, physician, and neuropsychologist evaluation) ≥70 years of age with usable baseline 3T FLAIR MRI and T1 MRI scans performed between August 2005 and September 2011. A total of 280 individuals were excluded because of cognitive impairment, including 258 with mild cognitive impairment and 22 with dementia. Beyond no cognitive impairment, we did not exclude individuals with prior stroke or other cerebrovascular findings. Of all MCSA participants, ≈80% consent for an MRI. Among those identified for this study, 8 individuals had scans that failed quality control measures and were removed from this study. Our final cohort consisted of 1,301 participants. From the REP, we were able to ascertain risk factors in these participants as described below.
Standard protocol approvals, registrations, and patient consents
The study was approved by the Mayo Clinic institutional review board, and informed consent was obtained from all participants.
CVP assessment
WMH on standard 2-dimensional FLAIR imaging were segmented and edited by a trained imaging analyst (G.M.P.) using a semiautomated method.10 We estimated the total WM volume from T1 MRI scans. In a sample of 9 individuals who had a pair of 3T MRI scans within 10 days, we found very high intraclass correlations (>0.95) for both computed WM volume and WMH volume, indicating that these quantities can be reliably estimated. Brain infarctions were assessed by a trained image analyst (G.M.P.) and confirmed by a radiologist (K.K.) blinded to all clinical information. Cortical infarcts were defined as lesions with a largest diameter of >1 cm, while subcortical infarcts were defined as those >3 mm in diameter. The intrarater reliability of this assessment has been recorded as 0.98 for cortical infarcts and 0.94 for subcortical infarcts.11
Cardiovascular and metabolic risk factors
Midlife risk factors
Using the REP medical records linkage system, trained nurses abstracted the history of midlife (age 40–64 years) vascular risk factors for each participant, including type 2 diabetes mellitus, hypertension, dyslipidemia, and obesity.12 We also estimated a summary score for midlife physical inactivity based on 21 minus the midlife physical activity summary scores published previously from a questionnaire that was obtained for all MCSA participants.13 Of all the study participants, 1 was missing all midlife risk factors, 97 were missing obesity data, and 61 did not have completed midlife physical activity questionnaires.
Late-life chronic conditions
In addition to the above risk factors, we included the standard definition of chronic conditions in a 5-year capture frame (late life).14 From the US Department of Health and Human Services list proposed in 2010 for studying multimorbidity, we limited the scope to 7 cardiac and metabolic conditions, which included hypertension, hyperlipidemia, cardiac arrhythmias, coronary artery disease, congestive heart failure, diabetes mellitus, and stroke. In appendix e-1 (http://links.lww.com/WNL/A106) we have listed these conditions and the ICD-9 codes used to identify these conditions.
Statistical methods
We compared men and women using t tests for continuous variables and χ2 tests for categorical variables. To evaluate sex differences in WMH volume, we fit a linear regression model with log-transformed WMH volume as the response and age, total WM volume, and several midlife vascular risk factors as the predictors. The midlife risk factors in this regression model were midlife diabetes mellitus, midlife hypertension, and midlife dyslipidemia, along with smoking status (ever vs never). We did not include midlife obesity because of missing data. The log of the outcome was modeled to account for skewness in the data. By adjusting for total WM volume, we were able to assess whether for a given WM volume, i.e., tissue at risk, men and women differ on average in log WMH volume. At a given age, men had ≈11% greater WM volumes compared to women, and the effect size, defined as the differences in means divided by the overall SD, was 0.76. However, with both 89% of men and 89% of women having WM volumes in the range of 375 to 575 cm3, we found that regression adjustment for WM volume was justified and allowed a comparison of men and women holding WM volume constant.
To evaluate sex differences in cortical and subcortical infarctions, we used logistic regression with infarctions as the binary outcome and age, midlife diabetes mellitus, midlife hypertension, midlife dyslipidemia, and smoking status as predictors. We chose to include midlife risk factors in our regression models primarily because CVP seen on FLAIR reflects long-term changes to the brain and the midlife risk factors have been abstracted and validated in the MCSA by trained nurses.12
Results
The characteristics of all participants overall and stratified by sex are summarized in the table. The mean (SD) age for both men and women was 79 (5) years, and the 2 groups had similar frequencies of APOE ε4 carrier status (25% in women vs 24% in men). Men were more likely to have a smoking history (59% vs 35%, p < 0.001). Among the late-life chronic conditions, men had a higher frequency of cardiac arrhythmias (31% vs 21%, p < 0.001) and coronary artery disease (38% vs 20%, p < 0.001). There was also a slightly higher frequency of diabetes mellitus among men (33% vs 27%, p = 0.017). When scaled by total WM volume, WMHs constituted a greater fraction of tissue in women compared to men (2.8% vs 2.4% of WM, p < 0.001). While relatively rare in both groups, men had a greater frequency of cortical infarctions compared to women (9% vs 4%, p < 0.001). About 20% of both men and women had subcortical infarctions.
Table.
Characteristics by sex
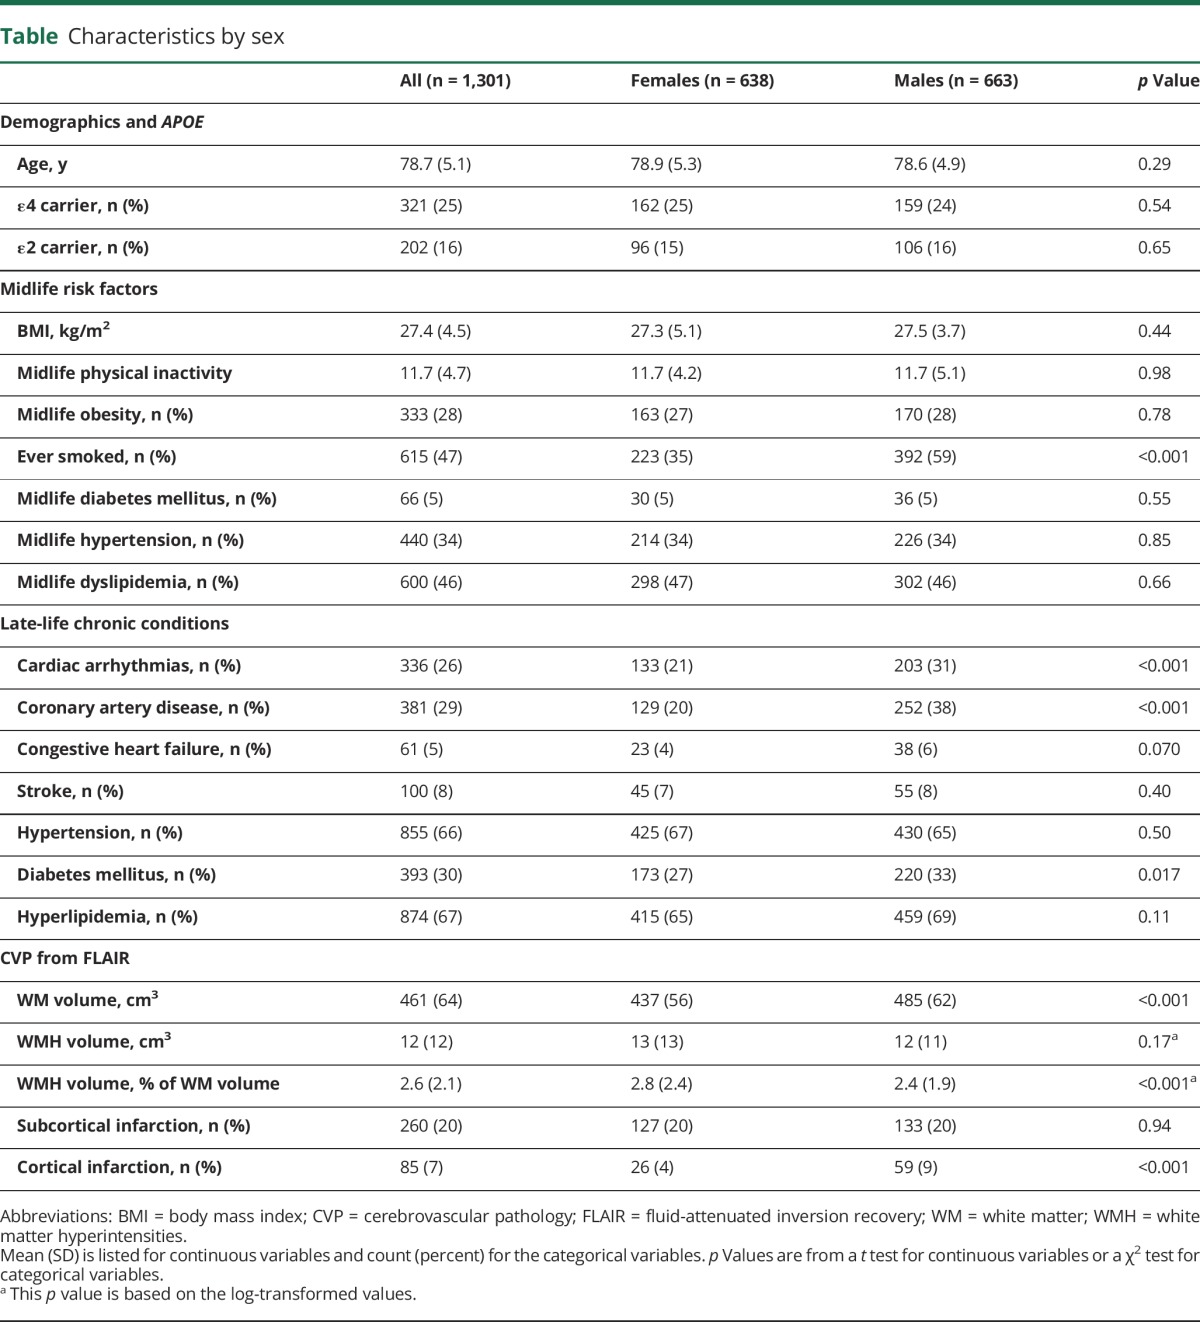
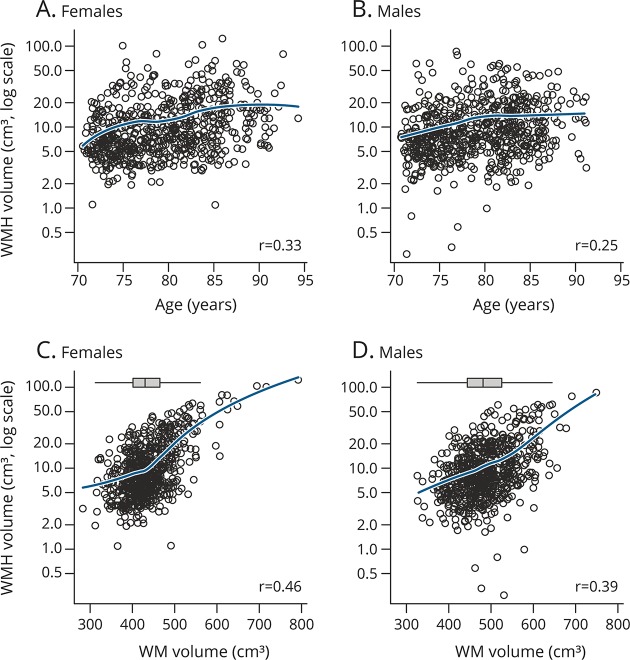
Figure 1 shows the distribution of WMH volume by age and by total WM volume stratified by sex. The figure illustrates that both men and women have similar distributions of WMH volume and that this measure is positively associated with age and scales with total WM volume, i.e., the total WM at risk for hyperintensities. The bottom panel of figure 1 shows the overall distribution of WM volume in men and women. Figure 2 shows the frequency of cortical and subcortical infarctions for men vs women by age category.
Figure 1. WMH volume by age and total WM volume stratified by sex.
(A) WMH vs age in women, (B) WMH vs age in men, (C) WHM vs WM volume in women, and (D) WMH vs WM volume in men. Blue line is from a locally weighted scatterplot smoother and represents the estimated mean WMH volume for a given age or total WM volume. The rank correlation (r) is shown in each panel. To aid comparison of WM volume for women and men, we include box plots showing the marginal distributions at the top of the lower 2 panels. WM = white matter; WMH = white matter hyperintensities.
Figure 2. Estimated percentage of (A) cortical and (B) subcortical infarctions by age group stratified by sex.
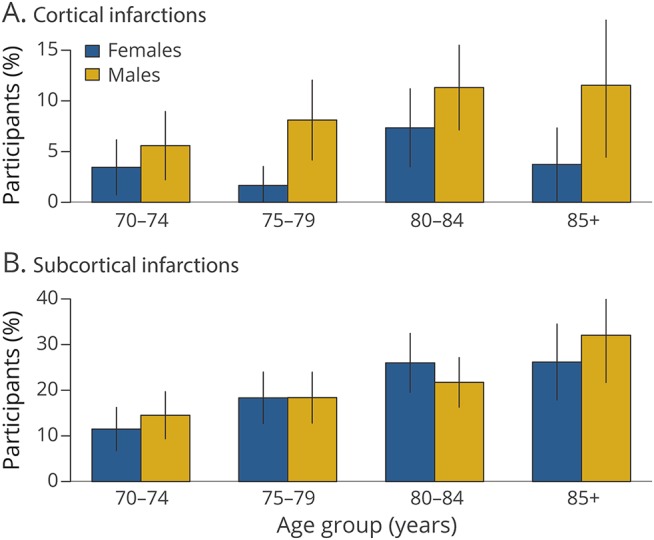
Error bars indicate 95% confidence intervals for the percentage.
Regression models
In the regression model for WMH volume, for a given WM volume, after for adjustment for age, midlife diabetes mellitus, midlife hypertension, midlife dyslipidemia, and smoking status, women had higher log WMH volumes compared to men (0.39, 95% confidence interval [CI] 0.31–0.46, p < 0.001) (figure 3). A 10-year increase in age was associated with a 0.56 increase in log WMH volume (95% CI 0.49–0.63, p < 0.001). In terms of effect sizes, for a given WM volume and with midlife vascular risk factors held constant, the magnitude of the difference in WMH volume between men and women was equivalent to a 7-year increase in age. Differences according to midlife risk factors were comparatively small, with marginally higher log WMH volumes found in those with midlife diabetes mellitus (0.09, 95% CI −0.06 to 0.25, p = 0.23), midlife hypertension (0.07, 95% CI 0.00–0.14, p = 0.05), midlife dyslipidemia (0.03, 95% CI −0.04 to 0.10, p = 0.42), and a history of smoking (0.03, 95% CI −0.03 to 0.10, p = 0.33). Adjustment for these factors had very little impact on the estimates for age and sex.
Figure 3. Effect of sex, age, total WM volume, and midlife vascular risk factors on log-transformed WMH volume.
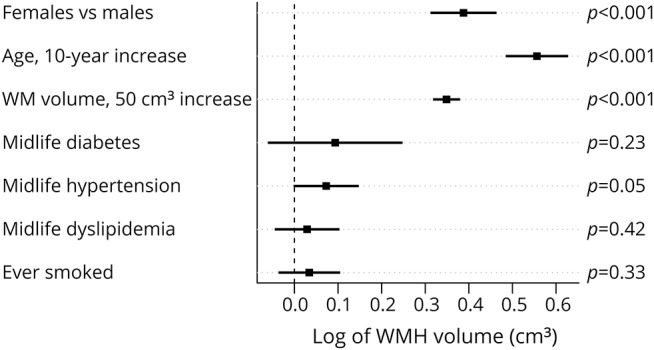
WM = white matter; WMH = white matter hyperintensities.
In logistic regression modeling of cortical infarctions, men had a >2-fold increase in the odds of cortical infarctions (odds ratio [OR] 2.2, 95% CI 1.4–3.7, p = 0.001), while a 10-year increase in age was associated with an 80% increase in the odds of cortical infarctions (OR 1.8, 95% CI 1.2–2.9, p = 0.01) (figure 4). Midlife hypertension was associated with an ≈50% increase in odds of cortical infarctions (OR 1.5, 95% CI 1.0–2.4, p = 0.07). The strength of the association with midlife diabetes mellitus was apparently similar although not significant (OR 1.4, 95% CI 0.5–3.3, p = 0.42), and associations were smaller for midlife dyslipidemia (OR 1.1, 95% CI 0.7–1.8, p = 0.64) and history of smoking (OR 1.3, 95% CI 0.8–2.0, p = 0.32). A very similar elevated odds of cortical infarctions for men was found with or without adjustment for vascular risk factors.
Figure 4. Relative odds of (A) cortical or (B) subcortical infarctions for sex, age, and midlife risk factors.
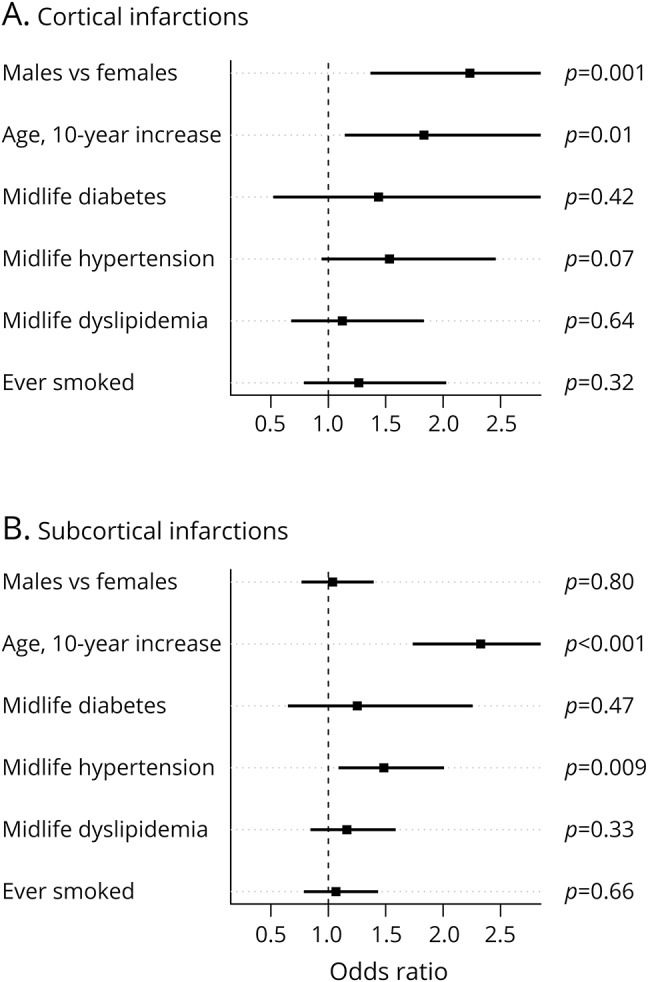
In the model for subcortical infarctions, a 10-year increase in age was associated with a doubling of odds of subcortical infarctions (OR 2.3, 95% CI 1.7–3.1, p < 0.001), but a sex difference was not observed (figure 4). Midlife hypertension was associated with an ≈50% increase in the relative odds of subcortical infarction (OR 1.5, 95% CI 1.1–2.0, p = 0.009). Although not statistically significant, midlife diabetes mellitus was associated with an increased odds of subcortical infarctions (OR 1.3, 95% CI 0.7–2.2, p = 0.47), while, if anything, midlife dyslipidemia and smoking appeared to be only weakly associated with subcortical infarctions.
Discussion
In a large, population-based cohort, using well-established methods of quantification, we found that women had significantly greater WMH volume compared to men after adjusting for WM volume, age, and midlife risk factors. In contrast, men had greater frequency of cortical infarctions compared to women. Sex was independently associated with these CVP outcomes after accounting for differences in midlife risk factors, and the latter did not appear to mediate the observed sex effect in any appreciable way. Understanding these sex differences in the frequency of CVP and associated risk factors could aid in the development of sex-specific preventive strategies. The findings of this study may explain the different patterns in prevalence and development of dementia seen in women and men, as explained in detail below.
A greater WMH burden in women may seem counterintuitive given that men tend to have a worse vascular risk factor profile, but our WMH findings are generally consistent with evidence suggesting sex differences in the risk of developing WMH.15 A population-based longitudinal study also reported that elderly women have a greater progression of WMH than men.16,17 Furthermore, that study found that the progression of WMH paralleled the cognitive decline seen in participants. Numerous studies have reported a higher frequency of arterial stiffness in women compared to men.18,19 Because arterial stiffness is related to remodeling of the cerebral vasculature, it may be a possible explanation for the increased prevalence of abnormal WMH in women. Another explanation is the sexual dimorphism in the WM microstructure between men and women.20 In addition to the observed sex effects, older individuals tended to carry a greater WMH burden for a given WM volume, as did individuals with midlife hypertension, findings that are consistent with the literature.21
We found clear evidence for increased odds of cortical infarctions in men. Studies have linked several vascular risk factors to the risk of cortical strokes: smoking,22 coronary heart disease,23 cardiac arrhythmias,24 and blood pressure.25 In the logistic regression models (figure 4), we found a weak association between midlife hypertension and odds of cortical infarctions, consistent with the literature.25 In addition, there was an increased frequency of several late-life chronic conditions in men in our sample (table). We found that age and midlife hypertension were the clearest predictors of subcortical infarctions. Besides age, hypertension is the most definitive risk factor for lacunar infarcts.24,25 Our results suggest that given midlife hypertension and age, there are no sex differences in the odds of subcortical infarctions. The presence of associations between each of the CVPs and hypertension, which is one of the major risk factors for CVP, and the fact that sex was independently associated with cortical infarctions and WMH strengthen our findings.
The findings of this study may help elucidate the different patterns in the prevalence and development of dementia in women and men. The higher frequency of cortical infarctions seen in men may explain in part the higher prevalence of nonamnestic mild cognitive impairment in men compared to women.26 On the other hand, women show greater WMH burden. In contrast to an infarction, which has a stepwise impact on cognition, WMH is a progressive process. Therefore, at a given level of amyloid, women may show greater longitudinal cognitive decline than men because they have a greater burden of WMH. This may be a possible underlying reason for a greater proportion of women with Alzheimer disease dementia compared to men.27
A potential explanation for our WMH finding is so-called collider bias in which a spurious statistical association between 2 variables is observed that is due to conditioning on a common downstream effect of these variables.28 That is, 2 variables that are independent can be linked statistically in an analysis that conditions on a factor that both variables influence. The conditioning can take the form of regression adjustment, stratification, or restriction of an analysis to a subgroup. Our study analyzed cognitively unimpaired individuals; therefore, we are conditioning via restriction on cognitive status. Because both sex and WMH volume affect cognitive status, the link we found could be due to collider bias. However, a secondary analysis among a subset of 219 individuals with mild cognitive impairment in a previously published cohort12 suggests that collider bias could be only a partial explanation because the sex effect among mild cognitive impairment was similar (−0.25 log-WMH volume units, 95% CI 0.06–0.44). Our analysis used regression adjustment to account for WM volume, yet WM volume would not be a collider, providing a spurious link between sex and WMH volume. The reason is that WM volume is not a common downstream effect of both sex and WMH volume; in fact, greater WM volume leads to greater WMH volume, not vice versa. This is our primary motivation for adjusting for WM volume. With sampling bias an unlikely explanation for our findings and in the absence of an identified systematic bias, we think our WMH findings are valid.
Another limitation of our WMH regression analysis is that, even though we adjusted for WM volume in our models to compare men and women at a given WM volume level, the relationship between WMH and WM volume is not straightforward. We observed that in men and women, individuals with greater WM volumes tended to have a higher ratio of WMH to WM volume; i.e., the ratio is not constant across the entire WM volume spectrum. There are 2 possible explanations for this: individuals with greater WM (or WM reserve) may be able to withstand greater burden of WMH while remaining cognitively normal, and the sensitivity of WMH detection could be influenced by the extent of WM. Although further studies are needed to understand the dynamics between WM volume and WMH volume, the approach we took to contrast WMH for men and women holding WM volume constant is reasonable for testing the hypothesis proposed here.
A major strength of our study is the availability of a large population-based sample with imaging and thorough risk factor assessment. A limitation of the study is the lack of arterial stiffness measures in our cohort, a factor that could clarify a mechanism by which women would be at increased risk of WMH. Given our large sample size, sampling variation is a possible but seemingly unlikely explanation for a possibly unexpected WMH finding. In any cohort, participation bias or selection effects should be considered. However, in a recent analysis, rigorously accounting for possible selection effects tended to affect estimates minimally.29 More in-depth investigation is needed to elucidate the effects of each risk factor on CVPs.
Acknowledgment
The authors thank all the study participants and staff in the MCSA, Mayo Alzheimer's Disease Research Center, and Aging and Dementia Imaging Research laboratory at the Mayo Clinic for making this study possible.
Glossary
- CI
confidence interval
- CVP
cerebrovascular pathology
- FLAIR
fluid-attenuated inversion recovery
- ICD-9
International Classification of Diseases, 9th revision
- MCSA
Mayo Clinic Study of Aging
- OR
odds ratio
- REP
Rochester Epidemiology Project
- WM
white matter
- WMH
white matter hyperintensities
Author contributions
Farzan Fatemi: drafting/revising the manuscript; analysis or interpretation of data; accepts responsibility for conduct of research and will give final approval. Stephen D. Weigand: drafting/revising the manuscript; analysis or interpretation of data; accepts responsibility for conduct of research and will give final approval; statistical analysis. Kejal Kantarci: drafting/revising the manuscript; analysis or interpretation of data; accepts responsibility for conduct of research and will give final approval; acquisition of data. Jonathan Graff-Radford: drafting/revising the manuscript; study concept or design; analysis or interpretation of data; accepts responsibility for conduct of research and will give final approval; acquisition of data. Gregory M. Preboske: analysis or interpretation of data; accepts responsibility for conduct of research and will give final approval. Scott A. Przybelski: analysis or interpretation of data; accepts responsibility for conduct of research and will give final approval; acquisition of data; statistical analysis. David S. Knopman: drafting/revising the manuscript; analysis or interpretation of data; accepts responsibility for conduct of research and will give final approval. Mary M. Machulda: drafting/revising the manuscript; accepts responsibility for conduct of research and will give final approval. Rosebud O. Roberts: drafting/revising the manuscript; accepts responsibility for conduct of research and will give final approval; acquisition of data; obtaining funding. Michelle M. Mielke: drafting/revising the manuscript; analysis or interpretation of data; accepts responsibility for conduct of research and will give final approval. Ronald C. Petersen: drafting/revising the manuscript; accepts responsibility for conduct of research and will give final approval; obtaining funding. Clifford R. Jack Jr.: drafting/revising the manuscript; accepts responsibility for conduct of research and will give final approval; acquisition of data; obtaining funding. Prashanthi Vemuri: drafting/revising the manuscript; study concept or design; analysis or interpretation of data; accepts responsibility for conduct of research and will give final approval; contribution of vital reagents/tools/patients; study supervision; obtaining funding.
Study funding
This work was supported by NIH grants R01 NS097495 (principal investigator [PI] Vemuri), R01 AG056366 (PI Vemuri), U01 AG006786 (PI Petersen), P50 AG016574/P1 (PI Vemuri), P50 AG016574 (PI Petersen), R01 AG034676 (PI Rocca), R01 AG011378 (PI Jack Jr.), R01 AG041851 (PIs Jack and Knopman), R01 AG055151 (PI Mielke); the GHR Foundation grant, the Alexander Family Alzheimer's Disease Research Professorship of the Mayo Foundation, the Elsie and Marvin Dekelboum Family Foundation, and Opus building NIH grant C06 RR018898. The funding sources were not involved in the manuscript review or approval.
Disclosure
The authors report no disclosures relevant to the manuscript. Go to Neurology.org/N for full disclosures.
References
- 1.Nelson PT, Head E, Schmitt FA, et al. Alzheimer's disease is not “brain aging”: neuropathological, genetic, and epidemiological human studies. Acta Neuropathol 2011;121:571–587. [DOI] [PMC free article] [PubMed] [Google Scholar]
- 2.Brickman AM, Zahodne LB, Guzman VA, et al. Reconsidering harbingers of dementia: progression of parietal lobe white matter hyperintensities predicts Alzheimer's disease incidence. Neurobiol Aging 2015;36:27–32. [DOI] [PMC free article] [PubMed] [Google Scholar]
- 3.Kaffashian S, Tzourio C, Zhu YC, Mazoyer B, Debette S. Differential effect of white-matter lesions and covert brain infarcts on the risk of ischemic stroke and intracerebral hemorrhage. Stroke 2016;47:1923–1925. [DOI] [PubMed] [Google Scholar]
- 4.Roberts RO, Geda YE, Knopman DS, et al. The Mayo Clinic Study of Aging: design and sampling, participation, baseline measures and sample characteristics. Neuroepidemiology 2008;30:58–69. [DOI] [PMC free article] [PubMed] [Google Scholar]
- 5.Petersen RC, Roberts RO, Knopman DS, et al. Prevalence of mild cognitive impairment is higher in men: the Mayo Clinic Study of Aging. Neurology 2010;75:889–897. [DOI] [PMC free article] [PubMed] [Google Scholar]
- 6.Rocca WA, Yawn BP, St. Sauver JL, Grossardt BR, Melton LJ. History of the Rochester Epidemiology Project: half a century of medical records linkage in a US population. Mayo Clinic Proc 2012;87:1202–1213. [DOI] [PMC free article] [PubMed] [Google Scholar]
- 7.St Sauver JL, Grossardt BR, Leibson CL, Yawn BP, Melton LJ III, Rocca WA. Generalizability of epidemiological findings and public health decisions: an illustration from the Rochester Epidemiology Project. Mayo Clinic Proc Mayo Clinic 2012;87:151–160. [DOI] [PMC free article] [PubMed] [Google Scholar]
- 8.St Sauver JL, Grossardt BR, Yawn BP, et al. Data resource profile: the Rochester Epidemiology Project (REP) medical records-linkage system. Int J Epidemiol 2012;41:1614–1624. [DOI] [PMC free article] [PubMed] [Google Scholar]
- 9.St Sauver JL, Grossardt BR, Yawn BP, Melton LJ III, Rocca WA. Use of a medical records linkage system to enumerate a dynamic population over time: the Rochester Epidemiology Project. Am J Epidemiol 2011;173:1059–1068. [DOI] [PMC free article] [PubMed] [Google Scholar]
- 10.Raz L, Jayachandran M, Tosakulwong N, et al. Thrombogenic microvesicles and white matter hyperintensities in postmenopausal women. Neurology 2013;80:911–918. [DOI] [PMC free article] [PubMed] [Google Scholar]
- 11.Kantarci K, Petersen RC, Przybelski SA, et al. Hippocampal volumes, proton magnetic resonance spectroscopy metabolites, and cerebrovascular disease in mild cognitive impairment subtypes. Arch Neurol 2008;65:1621–1628. [DOI] [PMC free article] [PubMed] [Google Scholar]
- 12.Roberts RO, Knopman DS, Przybelski SA, et al. Association of type 2 diabetes with brain atrophy and cognitive impairment. Neurology 2014;82:1132–1141. [DOI] [PMC free article] [PubMed] [Google Scholar]
- 13.Vemuri P, Lesnick TG, Przybelski SA, et al. Effect of lifestyle activities on Alzheimer disease biomarkers and cognition. Ann Neurol 2012;72:730–738. [DOI] [PMC free article] [PubMed] [Google Scholar]
- 14.Vassilaki M, Aakre JA, Cha RH, et al. Multimorbidity and risk of mild cognitive impairment. J Am Geriatr Soc 2015;63:1783–1790. [DOI] [PMC free article] [PubMed] [Google Scholar]
- 15.Sachdev PS, Parslow R, Wen W, Anstey KJ, Easteal S. Sex differences in the causes and consequences of white matter hyperintensities. Neurobiol Aging 2009;30:946–956. [DOI] [PubMed] [Google Scholar]
- 16.van Dijk EJ, Prins ND, Vrooman HA, Hofman A, Koudstaal PJ, Breteler MM. Progression of cerebral small vessel disease in relation to risk factors and cognitive consequences: Rotterdam Scan Study. Stroke 2008;39:2712–2719. [DOI] [PubMed] [Google Scholar]
- 17.van den Heuvel DM, Admiraal-Behloul F, ten Dam VH, et al. Different progression rates for deep white matter hyperintensities in elderly men and women. Neurology 2004;63:1699–1701. [DOI] [PubMed] [Google Scholar]
- 18.Berry KL, Cameron JD, Dart AM, et al. Large-artery stiffness contributes to the greater prevalence of systolic hypertension in elderly women. J Am Geriatr Soc 2004;52:368–373. [DOI] [PubMed] [Google Scholar]
- 19.Coutinho T. Arterial stiffness and its clinical implications in women. Can J Cardiol 2014;30:756–764. [DOI] [PubMed] [Google Scholar]
- 20.van Hemmen J, Saris IMJ, Cohen-Kettenis PT, Veltman DJ, Pouwels PJW, Bakker J. Sex differences in white matter microstructure in the human brain predominantly reflect differences in sex hormone exposure. Cereb Cortex 2017;27:2994–3001. [DOI] [PubMed] [Google Scholar]
- 21.Raz N, Yang Y, Dahle CL, Land S. Volume of white matter hyperintensities in healthy adults: contribution of age, vascular risk factors, and inflammation-related genetic variants. Biochim Biophys Acta 2012;1822:361–369. [DOI] [PMC free article] [PubMed] [Google Scholar]
- 22.Riba-Llena I, Koek M, Verhaaren BF, et al. Small cortical infarcts: prevalence, determinants, and cognitive correlates in the general population. Int J Stroke 2015;10(suppl A100):18–24. [DOI] [PubMed] [Google Scholar]
- 23.Hoshide S, Kario K, Mitsuhashi T, et al. Different patterns of silent cerebral infarct in patients with coronary artery disease or hypertension. Am J Hypertens 2001;14:509–515. [DOI] [PubMed] [Google Scholar]
- 24.Vermeer SE, Longstreth WT Jr, Koudstaal PJ. Silent brain infarcts: a systematic review. Lancet Neurol 2007;6:611–619. [DOI] [PubMed] [Google Scholar]
- 25.Vermeer SE, Den Heijer T, Koudstaal PJ, Oudkerk M, Hofman A, Breteler MM. Incidence and risk factors of silent brain infarcts in the population-based Rotterdam Scan Study. Stroke 2003;34:392–396. [DOI] [PubMed] [Google Scholar]
- 26.Roberts RO, Geda YE, Knopman DS, et al. The incidence of MCI differs by subtype and is higher in men: the Mayo Clinic Study of Aging. Neurology 2012;78:342–351. [DOI] [PMC free article] [PubMed] [Google Scholar]
- 27.Mielke MM, Vemuri P, Rocca WA. Clinical epidemiology of Alzheimer's disease: assessing sex and gender differences. Clin Epidemiol 2014;6:37–48. [DOI] [PMC free article] [PubMed] [Google Scholar]
- 28.Cole SR, Platt RW, Schisterman EF, et al. Illustrating bias due to conditioning on a collider. Int J Epidemiol 2010;39:417–420. [DOI] [PMC free article] [PubMed] [Google Scholar]
- 29.Roberts RO, Knopman DS, Syrjanen JA, et al. Weighting and standardization of frequencies to determine prevalence of AD imaging biomarkers. Neurology 2017;89:2039–2048. [DOI] [PMC free article] [PubMed] [Google Scholar]


