

Abstract
Objective
To determine the association of a neurologist visit with headache health care utilization and costs.
Methods
Utilizing a large privately insured health care claims database, we identified patients with an incident headache diagnosis (ICD-9 codes 339.xx, 784.0x, 306.81) with at least 5 years follow-up. Patients with a subsequent neurologist visit were matched to controls without a neurologist visit using propensity score matching, accounting for 54 potential confounders and regional variation in neurologist density. Co–primary outcomes were emergency department (ED) visits and hospitalizations for headache. Secondary outcomes were quality measures (abortive, prophylactic, and opioid prescriptions) and costs (total, headache-related, and non-headache-related). Generalized estimating equations assessed differences in longitudinal outcomes between cases and controls.
Results
We identified 28,585 cases and 57,170 controls. ED visits did not differ between cases and controls (p = 0.05). Hospitalizations were more common in cases in year 0–1 (0.2%, 95% confidence interval [CI] 0.2%–0.3% vs 0.01%, 95% CI 0.01%–0.02%; p < 0.01), with minimal differences in subsequent years. Costs (including non-headache-related costs) and high-quality and low-quality medication utilization were higher in cases in the first year and decreased toward control costs in subsequent years with small differences persisting over 5 years. Opioid prescriptions increased over time in both cases and controls.
Conclusion
Compared with those without a neurologist, headache patients who visit neurologists had a transient increase in hospitalizations, but the same ED utilization. Confounding by severity is the most likely explanation given the non-headache-related cost trajectory. Claims-based risk adjustment will likely underestimate disease severity of headache patients seen by neurologists.
While the future of the Patient Protection and Affordable Care Act of 2010 is uncertain, the principles underlying the bipartisan Medicare Access and CHIP Reauthorization Act of 2015 (MACRA) are likely to remain.1 Namely, MACRA adjusts Medicare fee-for-service reimbursement using either alternative payment models (APM) or the merit-based incentive payment system (MIPS).2,3 APM and MIPS both attempt to incentivize high-quality and cost-effective care as opposed to the volume of services provided. This major shift in payment structure increases the importance of the quality and costs of care delivered by neurologists.
Headache is one of the most common disorders, with a lifetime prevalence of greater than 90%.4 Furthermore, headache is also the most common reason for patients to see a neurologist, accounting for 1.91 million visits per year.5 While 27% of migraine headache patients follow with a neurologist, the remainder are seen by a variety of providers.6 Given that this condition is common and often involves both neurologists and non-neurologists, a headache population is ideal for investigating the differences in quality and cost between those with and without a neurologist.
We aimed to determine the association between neurologist visits and acute care utilization (i.e., emergency department [ED] visits and hospitalizations) in a large, privately insured health care claims database. Secondary outcomes to be assessed include measures of quality (abortive and prophylactic headache medications, opioids) and costs (total, headache-related, non-headache-related). Our goals were twofold: to explore the value of neurologist care in patients with headache and the potential strengths and limitations of administrative approaches to measuring quality of care.
Methods
Population
We utilized the de-identified Clinformatics Datamart (OptumInsight, Eden Prairie, MN) database, which contains detailed medical and pharmaceutical claims on more than 59.7 million individuals insured by United Healthcare from 2001 to 2014. We identified individuals over the age of 18 with an incident headache diagnosis listed as the primary diagnostic code based on ICD-9 codes (339.xx, 784.0x, 306.81).7 Our concentration on headache diagnoses listed as the primary diagnostic code was to ensure that headache was identified as the primary reason for the provider visit. Our focus on incident headache diagnoses was intended to standardize the care between patients cared for by neurologists and non-neurologists. Patients were required to have 6 years of continuous insurance enrollment with at least 1 year before and 5 years after the incident headache diagnosis (figure 1). Patients with prescriptions for triptans prior to the incident headache diagnosis were excluded to decrease the likelihood of past headache diagnoses that are not captured in the database. We did not exclude previous prophylactic or opioid use as these medications are not specific for headache and can be used for other indications. Patients with other common neurologic conditions5 diagnosed prior to the incident headache diagnosis were also excluded to ensure that the neurologist visit was focused on headache as opposed to other neurologic problems.5
Figure 1. Study design overview.

Study design overview including propensity matching, adjustment for lag period variables, and follow-up periods.
Primary exposure and comparison group
Our primary exposure was a neurologist visit, defined as an outpatient visit with a neurologist (index date) after the incident headache diagnosis.
We then utilized a propensity score matching technique without replacement to create a headache comparison group without an outpatient neurologist visit. We identified 2 controls for every 1 case using the following variables: age, sex, 17 individual Charlson comorbidities,8 mood disorders,7 chronic overlapping pain conditions (fibromyalgia, irritable bowel syndrome, temporomandibular joint disorder, chronic pelvic pain, interstitial cystitis, chronic low back pain), high-quality prophylactic medications prescribed (β-blockers, topiramate, serotonin and norepinephrine reuptake inhibitors [SNRI], tricyclic antidepressants [TCA], valproic acid), high-quality abortive medications prescribed (ergots), opioid use, nonsteroidal anti-inflammatory drug (NSAID) use, total medication costs, total medical expenditures, number of ED visits for any reason, number of hospitalizations for any reason, year of diagnosis, and number of years of data available. Matching was performed using a 2:1 nearest neighbor matching after estimating a propensity score using multilevel logistic regression with a dependent variable of whether a patient had a neurologist visit, all independent variables listed above, and a random regional level intercept to account for regional variation in neurology availability. After matching, controls were assigned an index date corresponding to the date when the case had an outpatient neurologist visit.
Lag time variables
Cases had variable lag times between the incident headache diagnosis and the outpatient neurologist visit, but these were the same as their matched controls. As care could differ between cases and controls after the index date, but prior to the neurologist visit, we adjusted for variables that occurred during the lag time. Specifically, we captured the following lag time variables: length of the lag time, number of ED visits for headache, number of hospitalizations for headache, high-quality prophylactic medications prescribed (β-blockers, topiramate, SNRI, TCA, valproic acid), high-quality abortive medications prescribed (triptans, ergots), opioid use, total drug costs, and total medical expenditures.
Co–primary outcomes
ED visits and hospitalizations with a headache diagnosis listed as the primary diagnostic code were the main outcomes measures.
Secondary outcomes
High headache quality of care was indicated by evidence-based prophylactic (β-blockers, topiramate, SNRI, TCA, and valproic acid) and abortive (triptans and ergots) medication prescriptions.9 Low headache quality of care was indicated by opioid prescriptions.10 Cost indicators included total medical expenditures (inpatient, outpatient, prescription), headache-related expenditures (ED visits and hospitalizations for headache, outpatient visits for headache, prophylactic medications, abortive medications, opioids, head CT, MRI brain), and non-headache-related expenditures (total less headache-related expenditures).
Statistical analysis
Separate regression models (logistic regression for binary outcomes, linear regression for continuous outcomes, and log-linked linear regression for costs) were built to estimate the association between neurologist visits and each individual outcome over time. Each outcome was estimated per year (e.g., total expenditures in year 0–1) for each patient and multilevel regression models were fit for each outcome, after adjusting for all lag period variables and including a random subject-level intercept. The influence of neurologist visits, over time, on each outcome was estimated with average marginal effects, setting the random intercept at its mean. Sensitivity analyses were run adjusting for chronic opioid use (more than 6 opioid prescription claims per year) in the propensity score model and as a lag time covariate, and focusing on the subset of our population with migraine headache diagnoses.
Standard protocol approvals, registrations, and patient consents
The University of Michigan institutional review board determined that this study was exempt.
Results
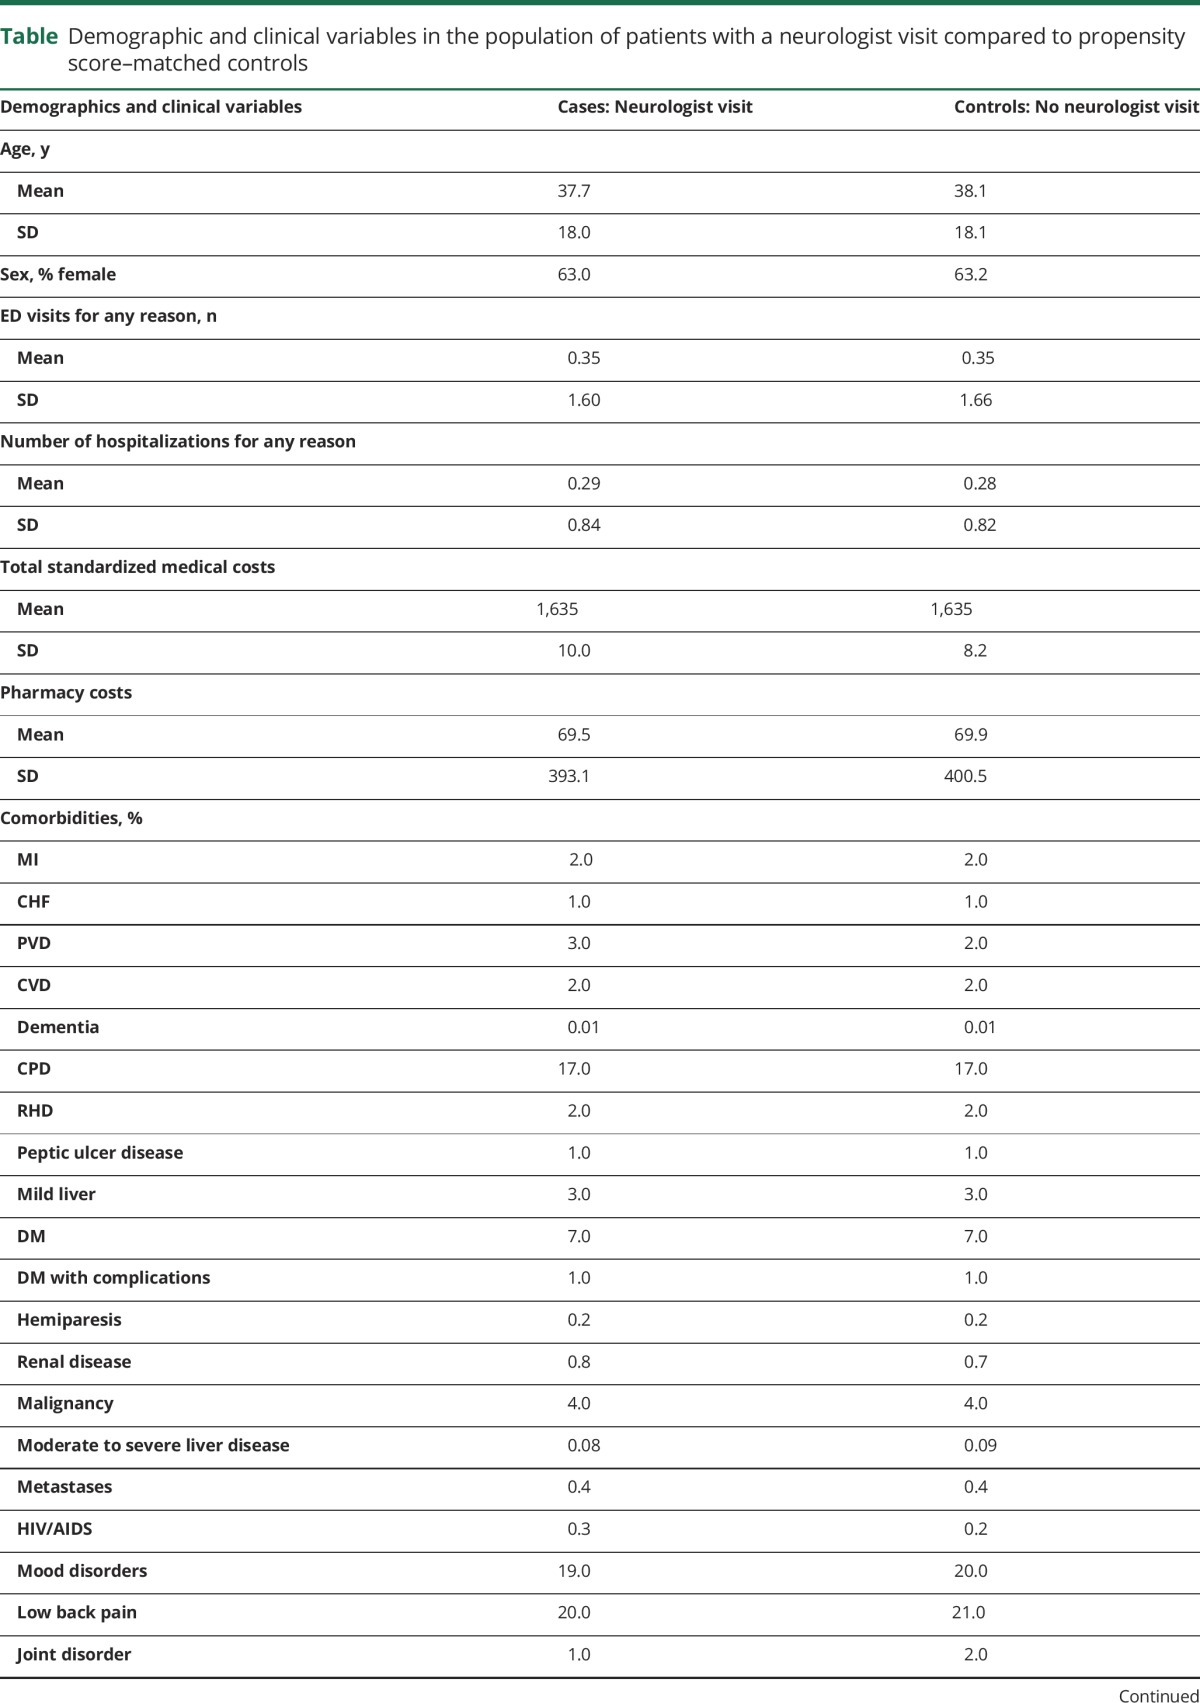
We identified 28,585 patients who saw a neurologist after their incident headache diagnosis and who met our inclusion criteria and 57,170 matched controls. The incidence of headache is much higher but we placed many restrictions on the population. Loss to follow-up was similar in cases and controls (year 0–1: 0% in both groups, year 1–2: 2.0% in both groups, year 2–3: 7.4% in cases and 7.2% in controls, year 3–4: 15.1% in both groups, year 4–5: 26.7% in both groups). The mean (SD) age at time of headache diagnosis was 37.7 (18.0) for cases and 38.1 (18.1) for controls with 63% female (table). Of note, the headache population demographics are different than the whole population (younger and more female enrollees). The mean (SD) number of ED visits in the year prior to the incident headache diagnosis was 0.35 (1.59) for cases and 0.35 (1.66) for controls and for number of hospitalizations was 0.29 (0.84) and 0.28 (0.82), although none of these visits was for headache because these visits were prior to the incident headache diagnosis.
Table.
Demographic and clinical variables in the population of patients with a neurologist visit compared to propensity score–matched controls
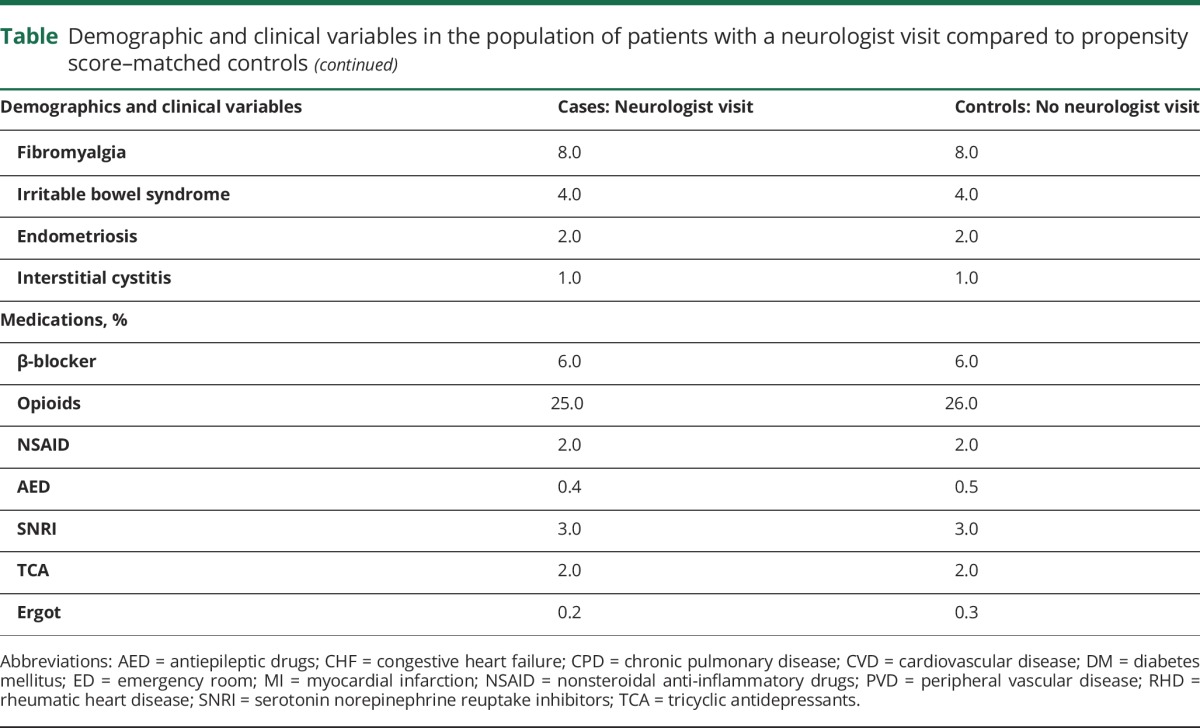
For ED visits for headache, we found no statistically significant differences between cases and controls (p = 0.05) (figure 2A). For hospitalization for headache, cases had higher predicted probability of utilization in year 0–1 than controls (0.2%, 95% confidence interval [CI] 0.2%–0.3% vs 0.01%, 95% CI 0.01%–0.02%, p < 0.01), and this difference rapidly decreased by year 1–2 (p = 0.69) (figure 2B).
Figure 2. Comparison of emergency department (ED) visits and hospitalizations for headache between those seeing a neurologist and propensity-matched controls.
(A) ED visits and (B) hospitalizations for headache in cases and controls after adjustment for lag time variables.
For high-quality abortive headache medications, cases had higher utilization in year 0–1 (8.1% vs 3.5%, p < 0.001); this difference decreased by year 2–3 (3.9% vs 2.4%, p < 0.001) (figure 3A), and persisted thereafter (figure 3A). For high-quality prophylactic headache medications, cases had higher utilization in year 0–1 (12.1% vs 6.7%, p < 0.001); this difference decreased by year 1–2 (8.8% vs 6.6%, p < 0.001), and persisted thereafter (figure 3B). For low-quality opioid use, cases had higher utilization in year 0–1 (28.4% vs 22.4%, p < 0.001); this difference decreased by year 1–2 (24.5% vs 22.2%, p < 0.001), and both cases and controls had higher utilization by year 4–5 (27.1% vs 24.1%, p < 0.001) (figure 3C).
Figure 3. Comparison of medications prescribed in the headache population between those seeing a neurologist and propensity-matched controls.

(A) High-quality abortive medications, (B) high-quality prophylactic medications, and (C) low-quality opioids in the headache population in cases and controls after adjustment for lag time variables. Predictive margins within 95%.
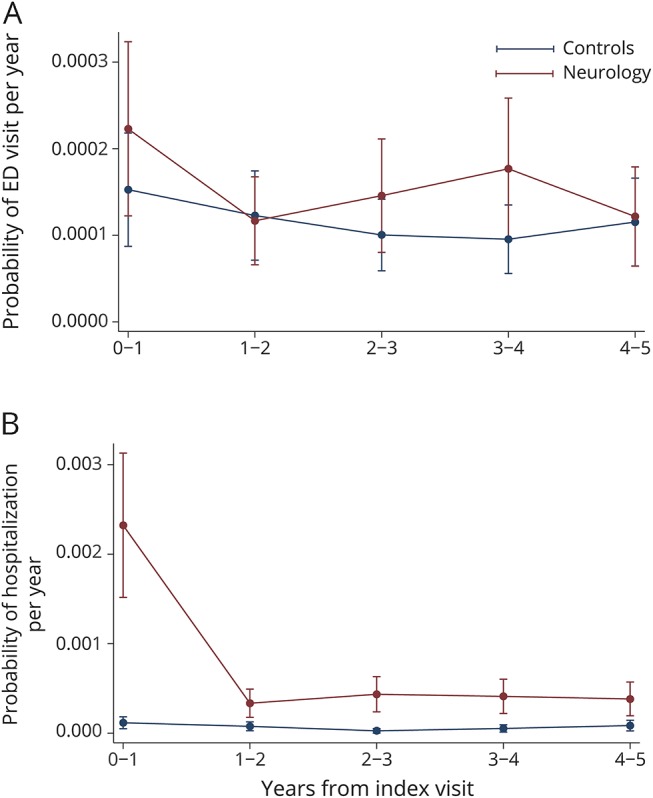
For total costs, cases had higher expenditures in year 0–1 ($9,572 vs $4,889, p < 0.001), and this difference rapidly decreased by year 1–2 ($6,628 vs $5,075, p < 0.001), and persisted thereafter (figure 4A). Similar trends were seen for headache-related and non-headache-related costs (figure 4, B and C). The most common diagnostic categories (Healthcare Cost and Utilization Project–Clinical Classifications Software level 1 classification) associated with non-headache-related costs were related to musculoskeletal/connective tissue, circulatory, neoplastic, and digestive disorders. Neurologic diagnoses were uncommon. Given these diagnostic categories, non-headache-related costs were unlikely to be related to headaches. The difference in headache-related costs was not secondary to differences in neuroimaging.
Figure 4. Comparison of costs in the headache population between those seeing a neurologist and propensity-matched controls.
(A) Total costs, (B) headache-related costs, (C) and non-headache-related costs in the headache population in cases and controls after adjustment for lag time variables. Predictive margins within 95%.
Sensitivity analyses accounting for chronic opioid use revealed no significant changes in any of our outcomes. Focusing on the subset of our population with migraine diagnoses, the only differences in our outcome models are that abortive medication utilization is higher in both cases and controls, prophylactic utilization is higher only in cases, and all costs (total, headache, and non-headache) are slightly lower in the migraine only population. However, the differences between cases and controls initially and over time reveal the same pattern of results.
Discussion
In a large, national sample of 85,755 privately insured patients with an incident headache diagnosis, patients who had a neurologist visit had no differences in subsequent ED utilization for headaches compared to those without a neurologist visit. While hospitalizations for headache were higher in those with a neurologist visit in the first year, this small absolute difference rapidly attenuated in the second year and beyond. Similar trends were seen for both headache-related and non-headache-related costs. There are 2 main potential explanations for the higher first-year hospitalizations and costs in those with a neurologist visit. First, residual confounding by disease severity despite robust attempts to adjust for key variables could explain these differences.11 Second, neurologist involvement could lead to higher utilization.12–14 The higher non-headache-related costs in cases compared to controls provides evidence supporting unmeasured confounding by severity, because these costs are unlikely to be the result of care by neurologists. It is also possible that neurologists are higher users of testing and hospitalization in headache patients, though this may also be related to headache severity and complexity. Overall, our findings suggest that efforts to measure the value of care provided by neurologists using claims data may be limited by residual confounding. Moreover, if claims-based approaches cannot fully account for unmeasured severity, initiatives to establish quality, value, or reimbursement standards using such measures may not achieve their intended goals. One potential way to better estimate value may be to measure clinical metrics, such as headache burden and quality of life, in addition to information available in claims data, but future studies are needed.
Total health care costs, headache-related costs, and non-headache-related costs all initially increased in the first year after seeing a neurologist, then declined toward control levels in subsequent years. While total costs in those seeing a neurologist are approximately $4,500 more in the first year compared with controls, three-fourths of the total is non-headache-related costs. The non-headache-related costs are difficult to attribute to neurologists, and are much more likely to represent residual confounding. The most likely explanation for this difference is unmeasured confounding by either headache disease severity or patient propensity to seek medical care.11 That such confounding likely exists is troubling and has important implications. We went to considerable lengths to minimize the effect of confounding by focusing on incident headaches, excluding patients with concomitant neurologic conditions, matching on an extensive list of comorbidities and potential measured confounders, and then adjusting for changes in care that occurred prior to the first neurologist visit. Despite this elaborate statistical approach, which is much more comprehensive than Medicare's proposed risk adjustment, cases still had much higher non-headache-related costs in the first year. These data have important implications for neurologists as new payment models emerge. Risk adjustment strategies, like those proposed by Medicare, may systematically penalize neurologists in MIPS and encourage APM to exclude neurologists due to perceived higher costs without accounting for severity of disease. While this study does not include patients insured through either Medicare or Medicaid, the concept of inappropriate risk adjustment likely applies to these populations and the newly proposed payment models as well. Our results are conceptually similar to studies in other conditions that have explored the performance of risk adjustment models. For example, claims-based risk-adjusted 30-day mortality models are now used by Medicare to estimate the quality of hospital care for stroke. Yet, when stroke severity or early do-not-resuscitate orders are included in similar models, markedly different perceptions of hospital quality emerge, suggesting that stroke severity and patient preferences are important unmeasured confounders.11,15 In the case of headache, we do not know what confounding variables may be present, but it is likely that similar confounders are in play.
Another important observation with implications for payment models is that the increase in costs in cases compared to controls is mostly transient. Potential explanations are that neurologists are able to reign in the costs of these headache patients over time or there is regression to the mean as headache patients improve over time.16 The latter explanation is supported by the decline in non-headache-related costs in addition to headache-related costs. Either way, the increased costs experienced by patients cared for by neurologists are only temporary. Thus, analyses that include longer longitudinal data are required to ascertain the long-term benefit of seeing a neurologist, rather than only focusing on the first year after a neurologist visit. Importantly, payment models that utilize bundled payments for headache episodes of care will be more favorable to neurologists if the time frame is longer.
We also found that ED visits and hospitalizations for headache are rare especially in patients who never see a neurologist; therefore, demonstrating a reduction in these outcomes with neurology involvement is unlikely. Similarly, given that these outcomes are relatively infrequent, they may be poor targets for value-based initiatives. Seeking to reduce ED visits and hospitalizations for headache, particularly when it is likely that these represent the appropriate health care setting for some of these patients, is unlikely to be an effective cost reduction technique. Further, these data underscore the point that patients with a disease severity that leads to ED or hospitalization for headache are highly likely to see a neurologist. Of note, the proportion of ED visits and hospitalizations for headaches that is appropriate is currently unknown and deserves future study. When developing new payment models, it will be important not to penalize neurologists for seeing the sickest headache patients.
While ED, hospitalizations, and costs are important outcomes to study in headache populations, the effect of neurologists on high-quality (abortive17 and prophylactic medications9) and low-quality (opioids)10,18,19 care are also crucial to understand. For high-quality outcomes, similar trajectories were seen. Both high-quality abortive and prophylactic medications increased in the first year in cases, decreased toward control levels in second year, and remained significantly increased over the entire 5 years of follow-up. As with the cost and other utilization measures, the differences in high-quality utilization may be at least partly explained by residual confounding by disease severity, particularly in the first year given the increases non-headache-related costs in this time period. For opioid utilization, we found an increase in cases during the first year that dropped toward control levels in the second year, and remained significantly increased over the entire 5 years of follow-up, which may also be explained by residual confounding by disease severity. Interestingly, opioid utilization increased in both cases and controls in subsequent years, unlike any of our other outcomes. These results may indicate the temporal trends in increasing opioid utilization regardless of physician involvement, highlighting the need for strategies to reduce opioids particularly in those with chronic noncancer pain such as this headache population.10,18 Given the potential for rebound headache, decreased opioid utilization may not only prevent the morbidity and mortality associated with their use, but also improve headache control in these patients.
Limitations are primarily those related to using a health care claims database. Our database does not contain granular clinical information, which likely leads to residual confounding. On the other hand, this database includes all ED, hospitalization, diagnostic testing, and pharmaceutical claims. Headache diagnoses rely on appropriate coding by physicians, which can be suboptimal. The generalizability of our results is likely limited to the privately insured population and primarily those under the age of 65. However, the 80,000+ patients included in this analysis make this one of the largest studies of headache patients to date. We do not have information linking medication use to headache; therefore, some of these medications likely had other indications. Furthermore, we are unable to link utilization or costs to specific providers. As a result, utilization and costs associated with neurologists may be the result of other provider types.
Neurologist involvement is not associated with a change in ED utilization for headache compared to matched controls. While a transient increase in hospitalizations for headache is seen, residual confounding by disease severity is the most likely explanation, which is supported by the increase in non-headache-related costs in cases compared to controls. Persistent increase in high-quality and low-quality medication utilization is associated with neurology involvement, but these differences are likely, at least in part, due to residual confounding. The main implication for neurologists as payments change from a volume-based model to APM and MIPS is that claims data are likely insufficient to appropriately risk adjust for the patients with more severe symptoms referred to neurologists even when using sophisticated and nuanced techniques.
Acknowledgment
Qingmei Jiang performed the statistical analyses.
Glossary
- APM
alternative payment models
- ED
emergency department
- ICD-9
International Classification of Diseases–9
- MACRA
Medicare Access and CHIP Reauthorization Act of 2015
- MIPS
merit-based incentive payment system
- SNRI
serotonin and norepinephrine reuptake inhibitors
- TCA
tricyclic antidepressants
Author contributions
Brian Callaghan and Jim Burke were involved in the study design and interpretation of the statistical analysis and wrote the manuscript. Kevin Kerber, Lesli Skolarus, John Ney, Brandon Magliocco, and Gregory Esper were integrally involved in interpretation of the data and critical revisions of the manuscript.
Study funding
Dr. Callaghan is supported by a NIH K23 grant (NS079417). Dr. Burke is supported by NINDS K08 NS082597 and R01 MD008879. Dr. Kerber is supported by NIH/NCRR K23 RR024009, AHRQ R18 HS017690, NIH/NIDCD R01DC012760, and AHRQ R18HS022258. Dr. Skolarus is supported by NIH/NIMHD R01 MD008879 and NIH/NIMHD U01MD010579.
Disclosure
B. Callaghan receives research support from Impeto Medical Inc. He performs medical consultations for Advance Medical, consults for a PCORI grant, consults for the immune tolerance network, and performs medical legal consultations. J. Burke has received compensation from Astra Zeneca for his role on the adjudication committee of the SOCRATES trial. K. Kerber and L. Skolarus report no disclosures relevant to the manuscript. J. Ney is an employee of the US government. This manuscript was not a term of his employment, nor did he receive any compensation for the manuscript. Dr. Ney has been a consultant for AxelaCare, a home IV infusion company; SpecialtyCare, a surgical services company; and Ceribell, an EEG device company. B. Magliocco reports no disclosures relevant to the manuscript. G. Esper performs medical legal consultations and also serves as a consultant for NeuroOne, Incorporated, an EEG device company. Go to Neurology.org/N for full disclosures.
References
- 1.Schneider EC, Hall CJ. Improve quality, control spending, maintain access: can the merit-based incentive payment system deliver? N Engl J Med 2017;376:708–710. [DOI] [PubMed] [Google Scholar]
- 2.Clough JD, McClellan M. Implementing MACRA: implications for physicians and for physician leadership. JAMA 2016;315:2397–2398. [DOI] [PubMed] [Google Scholar]
- 3.Mechanic RE. When new Medicare payment systems collide. N Engl J Med 2016;374:1706–1709. [DOI] [PubMed] [Google Scholar]
- 4.Rasmussen BK, Jensen R, Schroll M, Olesen J. Epidemiology of headache in a general population: a prevalence study. J Clin Epidemiol 1991;44:1147–1157. [DOI] [PubMed] [Google Scholar]
- 5.Burke JF, Skolarus LE, Callaghan BC, Kerber KA. Choosing Wisely: highest-cost tests in outpatient neurology. Ann Neurol 2013;73:679–683. [DOI] [PMC free article] [PubMed] [Google Scholar]
- 6.Ney JP, Johnson B, Knabel T, Craft K, Kaufman J. Neurologist ambulatory care, health care utilization, and costs in a large commercial dataset. Neurology 2016;86:367–374. [DOI] [PMC free article] [PubMed] [Google Scholar]
- 7.HCUP clinical classification software (CCS) for ICD- 9-CM [online]. Available at: hcup-us.ahrq.gov/toolssoftware/ccs/ccs.jsp. Accessed January 24, 2013.
- 8.Quan H, Sundararajan V, Halfon P, et al. Coding algorithms for defining comorbidities in ICD-9-CM and ICD-10 administrative data. Med Care 2005;43:1130–1139. [DOI] [PubMed] [Google Scholar]
- 9.Silberstein SD, Holland S, Freitag F, et al. Evidence-based guideline update: pharmacologic treatment for episodic migraine prevention in adults: report of the Quality Standards Subcommittee of the American Academy of Neurology and the American Headache Society. Neurology 2012;78:1337–1345. [DOI] [PMC free article] [PubMed] [Google Scholar]
- 10.Franklin GM. Opioids for chronic noncancer pain: a position paper of the American Academy of Neurology. Neurology 2014;83:1277–1284. [DOI] [PubMed] [Google Scholar]
- 11.Fonarow GC, Pan W, Saver JL, et al. Comparison of 30-day mortality models for profiling hospital performance in acute ischemic stroke with vs without adjustment for stroke severity. JAMA 2012;308:257–264. [DOI] [PubMed] [Google Scholar]
- 12.Callaghan BC, Burke JF, Rodgers A, et al. Expenditures in the elderly with peripheral neuropathy: where should we focus cost-control efforts? Neurol Clin Pract 2013;3:421–430. [DOI] [PMC free article] [PubMed] [Google Scholar]
- 13.Callaghan BC, Kerber K, Smith AL, Fendrick AM, Feldman EL. The evaluation of distal symmetric polyneuropathy: a physician survey of clinical practice. Arch Neurol 2012;69:339–345. [DOI] [PMC free article] [PubMed] [Google Scholar]
- 14.Callaghan BC, Kerber KA, Pace RJ, Skolarus L, Cooper W, Burke JF. Headache neuroimaging: routine testing when guidelines recommend against them. Cephalalgia 2015;35:1144–1152. [DOI] [PMC free article] [PubMed] [Google Scholar]
- 15.Kelly AG, Zahuranec DB, Holloway RG, Morgenstern LB, Burke JF. Variation in do-not-resuscitate orders for patients with ischemic stroke: implications for national hospital comparisons. Stroke 2014;45:822–827. [DOI] [PMC free article] [PubMed] [Google Scholar]
- 16.Linden A. Assessing regression to the mean effects in health care initiatives. BMC Med Res Methodol 2013;13:119. [DOI] [PMC free article] [PubMed] [Google Scholar]
- 17.Silberstein SD. Practice parameter: evidence-based guidelines for migraine headache (an evidence-based review): report of the Quality Standards Subcommittee of the American Academy of Neurology. Neurology 2000;55:754–762. [DOI] [PubMed] [Google Scholar]
- 18.Dowell D, Haegerich TM, Chou R. CDC guideline for prescribing opioids for chronic pain: United States, 2016. JAMA 2016;315:1624–1645. [DOI] [PMC free article] [PubMed] [Google Scholar]
- 19.Rapoport A, Stang P, Gutterman DL, et al. Analgesic rebound headache in clinical practice: data from a physician survey. Headache 1996;36:14–19. [DOI] [PubMed] [Google Scholar]