Abstract
Objective
To assess the variation in baseline and seizure onset zone interictal high-frequency oscillation (HFO) rates and amplitudes across different anatomic brain regions in a large cohort of patients.
Methods
Seventy patients who had wide-bandwidth (5 kHz) intracranial EEG (iEEG) recordings during surgical evaluation for drug-resistant epilepsy between 2005 and 2014 who had high-resolution MRI and CT imaging were identified. Discrete HFOs were identified in 2-hour segments of high-quality interictal iEEG data with an automated detector. Electrode locations were determined by coregistering the patient's preoperative MRI with an X-ray CT scan acquired immediately after electrode implantation and correcting electrode locations for postimplant brain shift. The anatomic locations of electrodes were determined using the Desikan-Killiany brain atlas via FreeSurfer. HFO rates and mean amplitudes were measured in seizure onset zone (SOZ) and non-SOZ electrodes, as determined by the clinical iEEG seizure recordings. To promote reproducible research, imaging and iEEG data are made freely available (msel.mayo.edu).
Results
Baseline (non-SOZ) HFO rates and amplitudes vary significantly in different brain structures, and between homologous structures in left and right hemispheres. While HFO rates and amplitudes were significantly higher in SOZ than non-SOZ electrodes when analyzed regardless of contact location, SOZ and non-SOZ HFO rates and amplitudes were not separable in some lobes and structures (e.g., frontal and temporal neocortex).
Conclusions
The anatomic variation in SOZ and non-SOZ HFO rates and amplitudes suggests the need to assess interictal HFO activity relative to anatomically accurate normative standards when using HFOs for presurgical planning.
Patients with drug-resistant epilepsy frequently undergo invasive EEG monitoring to identify the origin of their seizures. Despite the associated invasiveness and infection risk,1 15% of these patients do not undergo resective surgery,2 and among resected cases, seizures recur in up to 40% of temporal3,4 and 54%–73% of extratemporal cases.3,5 Better biomarkers could improve the efficacy of epilepsy surgery by identifying previously overlooked pathologic tissue.6 High-frequency oscillations (HFOs)7,8 have been identified as biomarkers of seizure-generating tissue in the brain.9–16 HFOs have also been shown to have a role in normal cognitive processing and memory,12,17,18 and differentiation between pathologic and normal physiologic oscillations remains challenging.8,19
Despite the well-known relationships between brain regions and cognitive tasks, and the role of HFOs in cognition, few studies have investigated spatial variation of HFOs. Studies of physiologic oscillations have focused on individual cognitive tasks in specific brain regions, but little data exist about the spatial distribution and characteristics of nonepileptogenic oscillations. Regional differences in cellular organization (e.g., archaecortex vs neocortex), function, and networks20 suggest that significantly different baseline rates of HFOs may characterize different brain structures, and that accurately identifying pathologic brain tissue may require comparison to baseline HFO rates. The present study investigates the anatomic distribution of HFO counts and amplitudes19 recorded in 70 patients, analyzed with a detection algorithm to provide an objective measure of HFO rates.
Methods
Standard protocol approvals, registrations, and patient consents
The Mayo Clinic Institutional Review Board reviewed and approved all research data collection activities associated with this study, and written informed consent was obtained from all participants.
Data collection
Intracranial EEG (iEEG) recordings from a cohort of 70 patients (3,693 recorded channels in total) who underwent intracranial monitoring between October 2005 and February 2014 as part of their clinical presurgical evaluation with wide-bandwidth (5 kHz sampling) research EEG recordings and adequate perioperative imaging were analyzed in this work. Wide-bandwidth recordings were made in parallel with clinical iEEG recordings (512 Hz sampling rate) for evaluation for epilepsy surgery.21 The patients underwent intracranial subdural and depth electrode implantation as part of their evaluation for epilepsy surgery. Data were acquired on a DC-capable Neuralynx (Bozeman, MT) electrophysiology system sampling at 32 kHz. The data were filtered using a Bartlett-Hanning window finite impulse response low-pass filter with cutoff at 1 kHz and decimated to a sampling frequency of 5 kHz. Raw data were stored in an open-source compressed electrophysiology file format (multiscale electrophysiology format)21 that incorporates encryption of patient identifiers and cyclic redundancy checks to ensure data fidelity in compressed data blocks. Determination of clinical seizure onset zone (SOZ) and non-SOZ channels was made independently by the clinical team of board-certified epileptologists after reviewing the clinical iEEG data. Channels designated as uncertain SOZ or irritative zone were excluded from analysis.
Coregistration of preoperative MRI with postoperative CT and electrode localization
As part of each patient's routine presurgical evaluation, a preoperative T1-weighted volumetric MRI was acquired, typically a sagittal magnetization-prepared rapid gradient echo (MPRAGE) (voxel dimensions 0.9375 × 0.9375 × 1.2 mm, repetition time 6.2 ms, echo time 2.4 ms, 8° flip angle, 3T field strength), although other coronal and axial MPRAGE and spoiled gradient recalled echo images with similar resolution were present as well. The preoperative MRI was preprocessed in FreeSurfer22–24 to segment brain structures, extract the pial surface, extract the leptomeningeal surface (i.e., a smoothed pial surface), and map the patient's cortical surface to the FreeSurfer average cortical surface. As part of this process, each patient's cortical surface is mapped to the Desikan-Killiany brain atlas,22 which assigns each neocortical vertex to 1 of 35 areas based on gyral morphology. Following electrode implantation, high-resolution X-ray CT images were acquired to confirm electrode placement. The postimplant CT volume was rigidly coregistered to the preoperative MRI using the FMRIB's linear image registration tool algorithm included in FSL25,26 via a 6 degrees of freedom affine transformation that maximized the mutual information between the 2 volumes. Resulting coregistered image volumes were visually inspected for accuracy. The coregistered CT volume was imported into BioImage Suite and electrode locations were manually labeled.
The cortical surface and apparent electrode positions in the postimplant CT sag or shift due to loss of CSF during surgery.23,24 To compensate for this issue, subdural grid and strip electrode coordinates are projected to the leptomeningeal surface using an inverse gnomonic projection method described by Yang et al.27 The surface under each grid is approximated as part of a larger sphere, and the algorithm iteratively adjusts the projection of the grid plane onto the sphere to minimize the difference between the projected and known electrode geometry. Subdural strip electrodes were assigned to the nearest leptomeningeal surface vertex and depth electrode coordinates were not corrected for brain shift. This brain shift correction was done in MATLAB (Mathworks Inc., Natick, MA) via iELVis,28 which was also used for identifying and visualizing the anatomic location of electrodes.
SOZ electrodes were determined from the clinical iEEG report and verified independently by identifying the electrodes with the earliest iEEG seizure discharge. Seizure onset was determined as the earliest iEEG change in a clear electrographic seizure discharge.
Automated HFO detection was performed using a previously described detector29 with high specificity and sensitivity HFO identification. The algorithm employs a cascade of adaptive frequency-dependent amplitude thresholds based on metric normalization, and artifacts and interictal spikes are excluded on the basis of the candidate detection's frequency content dominance. Algorithm measures were tuned with HFOs visually identified by expert reviewers.30 The algorithm has excellent temporal precision and is efficient enough for real-time processing. In order to further assess the HFO detection algorithm's insensitivity to interictal spikes, we ran a commonly used spike detection algorithm31 on our iEEG data, and evaluated the Pearson linear correlation coefficient between the detections.
Results
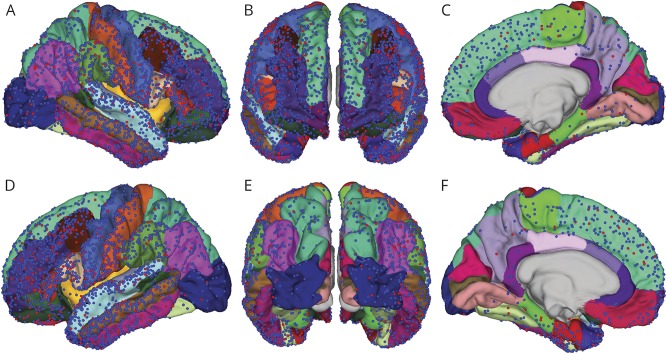
The 70-patient cohort consisted of 44 (63%) women and 26 (37%) men. Fifty-three (76%) were right-handed, 14 (20%) were left-handed, and 2 were undetermined or ambidextrous. Median age at onset of seizures was 13 years (range 0–48). Figure 1 shows the localizations of all 3,693 electrode SOZ (red) and non-SOZ (blue) contact positions with respect to the Desikan-Killiany (D-K) atlas (table e-1, links.lww.com/WNL/A170) parcellations in all 70 patients transformed into Montreal Neurological Institute atlas space. Electrode placement was determined entirely by the patient's clinical plan, and the distribution broadly covers the cerebral cortex. Note that in this figure depth electrode contacts lie below the cortical surface and are not visible. In this group of 70 patients, 50 (71%) went on to have resective epilepsy surgery, and of this group, 31 (62%) were seizure-free at last recorded follow-up (median 37.8 months, range 4.1–120.8 months).
Figure 1. Electrode positions on the Desikan-Killiany (D-K) atlas.
Electrode positions on the pial surface of the D-K atlas for all patients studied. The red and blue points represent seizure onset zone (SOZ) and non-SOZ electrodes, respectively, observed from the (A) right lateral view, (B) anterior view, (C) right mesial view, (D) left lateral view, (E) posterior view, and (F) left mesial view. While not visible in the figure, the right and left hippocampi were sampled by 18 and 26 SOZ electrodes and 17 and 21 non-SOZ electrodes, respectively. The right and left amygdalae were sampled by 3 and 8 SOZ electrodes and 1 and 14 non-SOZ electrodes, respectively.
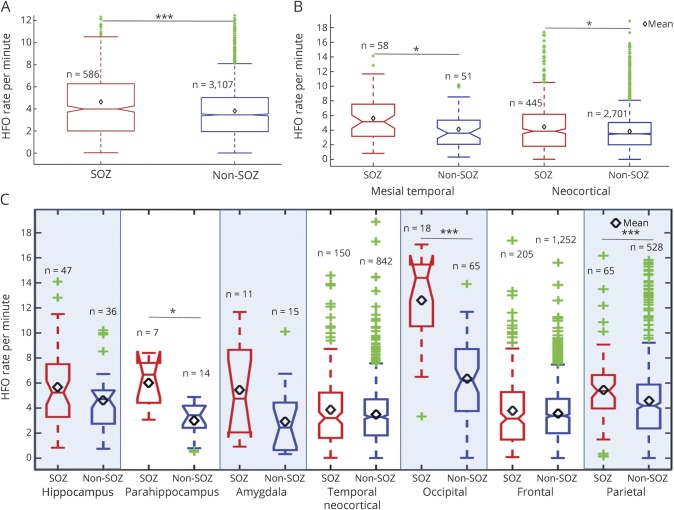
Figure 2 plots the mean, median, and quartile HFO rates for SOZ (red) and non-SOZ (blue) contacts in cerebral lobes and structures. When aggregated over all brain tissues (figure 2A), the difference in HFO counts between SOZ and non-SOZ is highly significant. If the electrodes are separated into the 2 most general focal epilepsy categories, mesial temporal and neocortical, HFO rates are significantly elevated in the SOZ in both categories (figure 2B). When parcellated into brain lobe and structure, the HFO rates were significantly elevated in SOZ compared with non-SOZ in parahippocampus, occipital lobe, and parietal lobe contacts, but did not show a significant difference in temporal neocortex or frontal lobe. Statistical significance was determined using the Wilcoxon rank sum test with p values adjusted for multiple comparisons using the Benjamini and Hochberg32 false discovery rate correction.
Figure 2. High-frequency oscillation (HFO) rates in seizure onset zone (SOZ) and non-SOZ electrodes.
(A) High-frequency oscillation rates for SOZ (red) and non-SOZ (blue) are significantly different (p < 0.001) when aggregated across all brain regions. (B) High-frequency oscillation rates for SOZ (red) and non-SOZ (blue) are significantly different (p < 0.05) for mesial temporal and neocortical structures. (C) High-frequency oscillation rates for SOZ (red) and non-SOZ (blue) channels in different brain structures. Mean HFO rates are noted by the black diamonds. The green points represent outliers. Statistical tests were performed using the Hochberg-Benjamini false discovery rate correction for multiple comparisons. *Statistically significant with p < 0.05, **statistically significant with p < 0.01, ***statistically significant with p < 0.001.
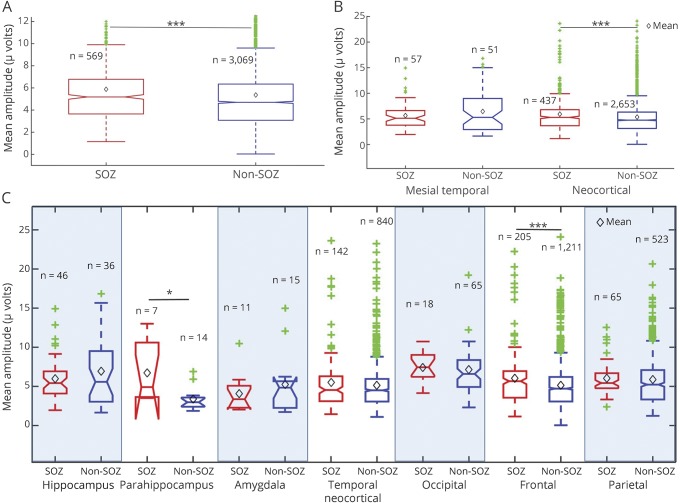
Similarly, figure 3 shows the mean, median, and quartile HFO amplitudes in different brain regions, where SOZ contacts are shown in red and non-SOZ regions in blue. Figure 3A compares HFO amplitudes in aggregate over the entire brain and shows a significant difference between SOZ and non-SOZ electrodes. Figure 3B compares SOZ and non-SOZ HFO amplitudes in mesial temporal and neocortical regions, with statistically significant results in neocortical electrodes. When separated into individual lobes and structures, amplitude differences between SOZ and non-SOZ were statistically significant in the frontal lobe and parahippocampal region.
Figure 3. High-frequency oscillation (HFO) amplitudes in seizure onset zone (SOZ) and non-SOZ electrodes.
(A) The mean HFO amplitudes for SOZ and non-SOZ contacts are significantly different (p < 0.001) when aggregated across all brain regions. (B) Mean HFO amplitudes in SOZ (red) and non-SOZ (blue) are significantly (p < 0.001) different for electrodes in neocortical regions, but not mesial temporal regions (amygdala, hippocampus). (C) Mean peak HFO amplitudes of SOZ (red) and non-SOZ (blue) channels in different brain lobes. The Benjamini-Hochberg false discovery rate correction was applied to compensate for multiple comparisons. Mean HFO amplitudes are noted by the black diamonds. The green points represent outliers.
A one-way analysis of variance test on non-SOZ channels showed that the differences in the brain regions in figures 2C and 3C in HFO counts (F statistic = 24.8, p < 0.001) and HFO amplitudes (F statistic = 5.69, p < 0.001) are statistically significant. A 2-tailed paired t test comparing left and right atlas regions (excluding atlas subregions with no electrodes in one hemisphere) shows a significant difference in mean HFO rates (p < 0.01) and amplitudes (p < 0.05) between hemispheres.
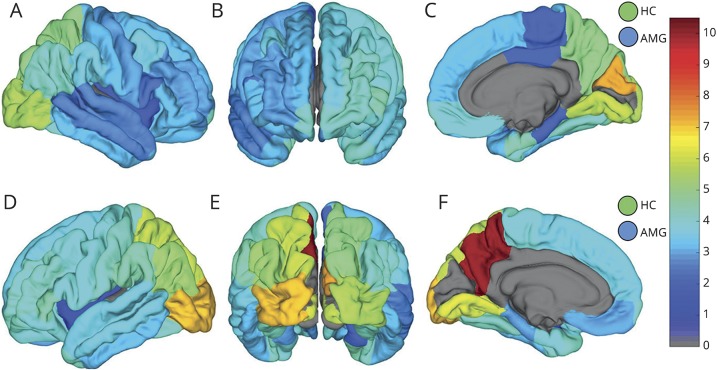
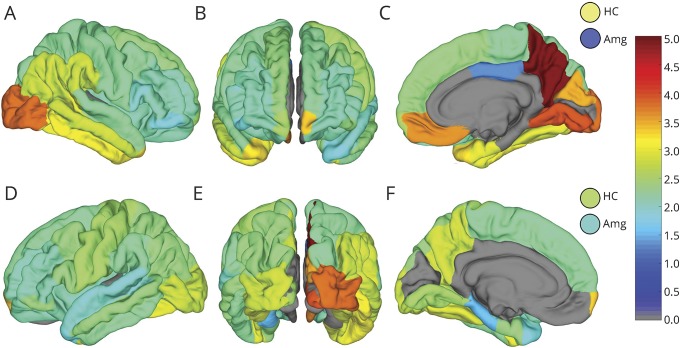
The mean HFO rates and amplitudes for individual substructures in the D-K atlas for non-SOZ region are shown in figures 4 and 5, respectively. Atlas regions with fewer than 4 contacts in this cohort were excluded and are shown in gray. The linear correlation between HFO and interictal spike detections was 0.108 (p < 0.001).
Figure 4. Non–seizure onset zone (SOZ) high-frequency oscillation (HFO) count rates across the Desikan-Killiany (D-K) atlas.
Map of mean non-SOZ HFO counts per minute in the D-K atlas brain regions shown from right (A) and left (D) lateral, anterior (B), right (C) and left (F) mesial, and posterior (E) perspectives. Hippocampus (HC) and amygdala (AMG) counts in right and left hemisphere are shown by the circles in the top and bottom row, respectively. Atlas regions with fewer than 4 electrodes were excluded from analysis and are shown in gray.
Figure 5. Non–seizure onset zone (SOZ) high-frequency oscillation (HFO) amplitudes across the Desikan-Killiany (D-K) atlas.
Map of mean HFO amplitude in microvolts of HFOs in non-SOZ channels in DK atlas brain regions shown from right (A) and left (D) lateral, anterior (B), right (C) and left (F) mesial, and posterior (E) perspectives. Hippocampus (HC) and amygdala (AMG) amplitudes in right and left hemisphere are shown by the circles in the top and bottom row, respectively. Atlas regions with fewer than 4 electrodes were excluded from analysis and are shown in gray.
Discussion
The results presented in this study support the hypothesis that different brain regions and tissue types generate different baseline rates and amplitudes of HFOs. The non-SOZ HFO maps in figures 4 and 5 illustrate the hemispheric laterality effect on baseline HFO rates as well. In particular the precuneus, orbitofrontal, mesial temporal, and inferior occipital regions stand out as having large differences between homologous contralateral structures. The results also show a low positive correlation between detected HFOs and spikes, which would seem to support the HFO detector's ability to reject spikes.
Also evident in figure 4 is the elevation of baseline HFO rates in occipital cortex. One might assume this is related to the visual processing functions associated with occipital cortex, but the use of iEEG segments between 1 and 3 am make it more likely the patients had eyes closed and were asleep during recording. There are reports describing visual cortex activation during REM sleep,33 but without concurrent scalp EEG recording it is not possible to assess this. In our cohort, these regions were moderately sampled (29 contacts in right occipital cortex and 16 contacts on the left, 14 patients in total), so it is possible that the mean HFO activity in these regions might have been elevated by a few patients who were sleepless or in REM sleep. However, these data are also consistent with the possibility that the normal baseline rate of HFOs in occipital cortex is higher than other brain regions. Further investigation with concurrent intracranial and scalp EEG is needed to evaluate this.
Of particular interest in this study is the variability of HFO rates and amplitudes, with large differences in SOZ and non-SOZ in some brain lobes and regions, but not in others. Previous reports describing HFOs as biomarkers of epileptogenic brain do not distinguish between brain regions, and employ a simple count of HFOs regardless of implanted structure to guide surgical resection of epileptogenic tissue.34–36 The present study combined with others exploring spatial and temporal variations in HFO rates37,38 contribute to a more complicated model of HFO generation in the brain, and suggest that under some conditions HFO rates and amplitudes in pathologic and normal tissue may be indistinguishable. The present study also raises the possibility that an elevated rate of HFOs could be observed in channels over normal tissue solely due to spatial differences in baseline rates. These results suggest that HFO rate and amplitude thresholds could be normalized to a set of baseline rates and amplitudes for different brain regions to improve the accuracy of epileptogenic tissue identification for surgical resection.
These results also highlight the need for further research to clarify the differences in characteristics between HFOs generated by normal brain activity and HFOs generated by pathologic ictogenic tissue. In the analyses of non-SOZ HFOs, HFO rates and amplitudes measured outside clinically designated SOZ areas primarily describe oscillations arising from nonpathologic brain tissue. This is confirmed in cases where the entire group of SOZ electrodes was resected, and the patient subsequently achieved seizure freedom. However, for patients who did not undergo resection, or patients who had resective surgery but did not achieve seizure freedom, it is possible that some channels in the non-SOZ group may have recorded from pathologic tissue overlooked by conventional clinical analysis. While we acknowledge this is a weakness in the study, limiting the non-SOZ analysis to only patients with seizure-free outcomes postresection would have reduced the number of patients and electrodes to less than half the cohort, and would have precluded analysis of sparsely sampled regions. Furthermore, very few unidentified pathologic channels would be expected in each of the 39 patients with poor outcomes or without resective surgery, and the spatial distribution of these channels among brain regions in the cohort should be random, minimizing the effect on the analysis. The primary effect anticipated would be to slightly elevate non-SOZ HFO rates overall and artificially reduce the significance of SOZ to non-SOZ comparisons presented.
It should also be noted that the placement of subdural and depth electrodes was determined entirely by the patient's clinical indication, inevitably leading to an undersampling of nonpathologic brain tissue, as well as uneven sampling of anatomic regions. It is possible that in the 39 patients without resection or with poor outcomes that some brain regions reported as non-SOZ could in reality represent distant seizure foci not observed during the patient's intracranial monitoring.39 To assess these issues, we repeated the statistical tests shown in figures 2 and 3 for the 31 patients with seizure-free outcomes. Results of statistical testing for HFO count rates were identical (aggregate p < 0.001; mesial temporal p < 0.05, neocortical p < 0.05, parahippocampus p < 0.05, occipital p < 0.001, parietal p < 0.01) to those presented in figure 2. For HFO amplitudes, differences between SOZ and non-SOZ channels in the 31 seizure-free patients were not significant for any comparison. These results suggest the HFO amplitude results are quite robust and not significantly influenced by potential inclusion of pathologic channels in non-SOZ statistics. The implications of the HFO amplitude result are less clear, as the loss of significance could be due to the reduction of sample size and statistical power, or could suggest that the significant results reported above are less robust and possibly influenced by uncontrolled confounds in our data.
This study demonstrates significant differences in rates and amplitudes of HFOs in SOZ and non-SOZ spanning the 38 anatomic regions defined by the D-K brain atlas, and between homologous regions in the left and right hemispheres. Significant SOZ vs non-SOZ differences in HFO counts were found in parahippocampal, occipital, and parietal regions, and differences in SOZ vs non-SOZ amplitudes were found in parahippocampal and frontal regions. However, significant differences between SOZ and non-SOZ counts and amplitudes were not observed in some lobes and structures (e.g., temporal neocortex). Further, differences in baseline, non-SOZ HFO rates and amplitudes were demonstrated among brain lobes. This analysis highlights the importance of considering measured HFO counts and amplitudes in the context of their anatomic locations in order to accurately differentiate between normal and pathologic, seizure-generating brain tissue.
Acknowledgment
The authors thank Karla Crocket, Cindy Nelson, Mark Bower, PhD, Tal Pal-Attia, and Dan Crepeau for assistance with data recording and management.
Glossary
- D-K
Desikan-Killiany
- HFO
high-frequency oscillation
- iEEG
intracranial EEG
- MPRAGE
magnetization-prepared rapid gradient echo
- SOZ
seizure onset zone
Footnotes
Editorial, page 347
Author contributions
Dr. Guragain: methodology design, data analysis, figure creation, writing the manuscript. Dr. Cimbalnik: data processing, analysis, and interpretation. Dr. Stead: data processing, analysis, and interpretation, critical revision of manuscript. Dr. Groppe: data processing and analysis, critical revision of manuscript. Dr. Berry: data analysis and interpretation, critical revision of manuscript for intellectual content. Dr. Kremen: data analysis, critical revision of manuscript. Dr. Kenney: data analysis, critical revision of manuscript. Dr. Britton: study concept and design, critical revision of manuscript. Dr. Worrell: data acquisition, analysis, and interpretation, methodology design, critical revision of manuscript, study supervision. Dr. Brinkmann: study concept and design, editing the manuscript, study supervision.
Study funding
This study was supported by a gift from Mr. and Mrs. David Hawk, The NIH (NINDS-R01- NS63039, NINDS-R01-NS78136), and the Mayo Clinic. V.K. is also supported by institutional resources for research by Czech Technical University in Prague, Czech Republic, and the Czech Science Foundation: grant 17-20480S. J.C. is supported by the European Regional Development Fund–Project FNUSA-ICRC (CZ.1.05/1.1.00/02.0123) and MEYS CR (LH15047, KONTAKT II).
Disclosure
H. Guragain and J. Cimbalnik report no disclosures relevant to the manuscript. M. Stead discloses research relationships with Medtronic Inc. and NeuroOne Inc. D. Groppe, B. Berry, V. Kremen, D. Kenney-Jung, and J. Britton report no disclosures relevant to the manuscript. G. Worrell discloses research relationships with Medtronic Inc. and NeuroOne Inc. B. Brinkmann discloses research relationships with Medtronic Inc. and NeuroOne Inc. Go to Neurology.org/N for full disclosures.
References
- 1.Van Gompel JJ, Worrell GA, Bell ML, et al. Intracranial electroencephalography with subdural grid electrodes: techniques, complications, and outcomes. Neurosurgery 2008;63:498–505; discussion 505–506. [DOI] [PubMed] [Google Scholar]
- 2.Berg AT, Vickrey BG, Langfitt JT, et al. The multicenter study of epilepsy surgery: recruitment and selection for surgery. Epilepsia 2003;44:1425–1433. [DOI] [PubMed] [Google Scholar]
- 3.Tellez-Zenteno JF, Dhar R, Wiebe S. Long-term seizure outcomes following epilepsy surgery: a systematic review and meta-analysis. Brain 2005;128:1188–1198. [DOI] [PubMed] [Google Scholar]
- 4.Bell ML, Rao S, So EL, et al. Epilepsy surgery outcomes in temporal lobe epilepsy with a normal MRI. Epilepsia 2009;50:2053–2060. [DOI] [PMC free article] [PubMed] [Google Scholar]
- 5.Noe K, Sulc V, Wong-Kisiel L, et al. Long-term outcomes after nonlesional extratemporal lobe epilepsy surgery. JAMA Neurol 2013;70:1003–1008. [DOI] [PMC free article] [PubMed] [Google Scholar]
- 6.Najm I, Jehi L, Palmini A, Gonzalez-Martinez J, Paglioli E, Bingaman W. Temporal patterns and mechanisms of epilepsy surgery failure. Epilepsia 2013;54:772–782. [DOI] [PubMed] [Google Scholar]
- 7.Bragin A, Wilson CL, Staba RJ, Reddick M, Fried I, Engel J. Interictal high-frequency oscillations (80–500 Hz) in the human epileptic brain: entorhinal cortex. Ann Neurol 2002;52:407–415. [DOI] [PubMed] [Google Scholar]
- 8.Jefferys JG, de La Prida LM, Wendling F, et al. Mechanisms of physiological and epileptic HFO generation. Prog Neurobiol 2012;98:250–264. [DOI] [PMC free article] [PubMed] [Google Scholar]
- 9.Worrell GA, Gardner AB, Stead SM, et al. High-frequency oscillations in human temporal lobe: simultaneous microwire and clinical macroelectrode recordings. Brain 2008;131:928–937. [DOI] [PMC free article] [PubMed] [Google Scholar]
- 10.Bragin A, Wilson CL, Almajano J, Mody I, Engel J Jr. High-frequency oscillations after status epilepticus: epileptogenesis and seizure genesis. Epilepsia 2004;45:1017–1023. [DOI] [PubMed] [Google Scholar]
- 11.Blanco JA, Stead M, Krieger A, et al. Unsupervised classification of high-frequency oscillations in human neocortical epilepsy and control patients. J Neurophysiol 2010;104:2900–2912. [DOI] [PMC free article] [PubMed] [Google Scholar]
- 12.Engel J, Bragin A, Staba R, Mody I. High-frequency oscillations: what is normal and what is not? Epilepsia 2009;50:598–604. [DOI] [PubMed] [Google Scholar]
- 13.Jacobs J, LeVan P, Chander R, Hall J, Dubeau F, Gotman J. Interictal high-frequency oscillations (80–500 Hz) are an indicator of seizure onset areas independent of spikes in the human epileptic brain. Epilepsia 2008;49:1893–1907. [DOI] [PMC free article] [PubMed] [Google Scholar]
- 14.van't Klooster MA, van Klink NE, Leijten FS, et al. Residual fast ripples in the intraoperative corticogram predict epilepsy surgery outcome. Neurology 2015;85:120–128. [DOI] [PubMed] [Google Scholar]
- 15.Jacobs J, Zijlmans M, Zelmann R, et al. High-frequency electroencephalographic oscillations correlate with outcome of epilepsy surgery. Ann Neurol 2010;67:209–220. [DOI] [PMC free article] [PubMed] [Google Scholar]
- 16.Zijlmans M, Jiruska P, Zelmann R, Leijten FSS, Jefferys JGR, Gotman J. High-frequency oscillations as a new biomarker in epilepsy. Ann Neurol 2012;71:169–178. [DOI] [PMC free article] [PubMed] [Google Scholar]
- 17.Kucewicz MT, Cimbalnik J, Matsumoto JY, et al. High frequency oscillations are associated with cognitive processing in human recognition memory. Brain 2014;137:2231–2244. [DOI] [PMC free article] [PubMed] [Google Scholar]
- 18.Sakura Y, Terada K, Usui K, et al. Very high-frequency oscillations (over 1000 Hz) of somatosensory-evoked potentials directly recorded from the human brain. J Clin Neurophysiol 2009;26:414–421. [DOI] [PubMed] [Google Scholar]
- 19.Matsumoto A, Brinkmann BH, Stead SM, et al. Pathological and physiological high-frequency oscillations in focal human epilepsy. J Neurophysiol 2013;110:1958–1964. [DOI] [PMC free article] [PubMed] [Google Scholar]
- 20.Marder E, Goaillard J-M. Variability, compensation and homeostasis in neuron and network function. Nat Rev Neurosci 2006;7:563. [DOI] [PubMed] [Google Scholar]
- 21.Brinkmann BH, Bower MR, Stengel KA, Worrell GA, Stead M. Large-scale electrophysiology: acquisition, compression, encryption, and storage of big data. J Neurosci Methods 2009;180:185–192. [DOI] [PMC free article] [PubMed] [Google Scholar]
- 22.Desikan RS, Ségonne F, Fischl B, et al. An automated labeling system for subdividing the human cerebral cortex on MRI scans into gyral based regions of interest. Neuroimage 2006;31:968–980. [DOI] [PubMed] [Google Scholar]
- 23.Hastreiter P, Rezk-Salama C, Soza G, et al. Strategies for brain shift evaluation. Med image Anal 2004;8:447–464. [DOI] [PubMed] [Google Scholar]
- 24.Hill DL, Castellano Smith AD, Simmons A, et al. Sources of error in comparing functional magnetic resonance imaging and invasive electrophysiological recordings. J Neurosurg 2000;93:214–223. [DOI] [PubMed] [Google Scholar]
- 25.Jenkinson M, Bannister P, Brady M, Smith S. Improved optimization for the robust and accurate linear registration and motion correction of brain images. Neuroimage 2002;17:825–841. [DOI] [PubMed] [Google Scholar]
- 26.Jenkinson M, Smith S. A global optimisation method for robust affine registration of brain images. Med Image Anal 2001;5:143–156. [DOI] [PubMed] [Google Scholar]
- 27.Yang AI, Wang X, Doyle WK, et al. Localization of dense intracranial electrode arrays using magnetic resonance imaging. Neuroimage 2012;63:157–165. [DOI] [PMC free article] [PubMed] [Google Scholar]
- 28.Groppe DM, Bickel S, Dykstra AR, et al. iELVis: an open source MATLAB toolbox for localizing and visualizing human intracranial electrode data. J Neurosci Methods 2017;281:40–48. [DOI] [PubMed] [Google Scholar]
- 29.Cimbalnik J, Hewitt A, Worrell G, Stead M. The CS algorithm: a novel method for high frequency oscillation detection in EEG. J Neurosci Methods 2017;293:6–16. [DOI] [PMC free article] [PubMed] [Google Scholar]
- 30.Worrell GA, Jerbi K, Kobayashi K, Lina JM, Zelmann R, Le Van Quyen M. Recording and analysis techniques for high-frequency oscillations. Prog Neurobiol 2012;98:265–278. [DOI] [PMC free article] [PubMed] [Google Scholar]
- 31.Barkmeier DT, Shah AK, Flanagan D, et al. High inter-reviewer variability of spike detection on intracranial EEG addressed by an automated multi-channel algorithm. Clin Neurophysiol 2012;123:1088–1095. [DOI] [PMC free article] [PubMed] [Google Scholar]
- 32.Benjamini Y, Hochberg Y. Controlling the false discovery rate: a practical and powerful approach to multiple testing. J R Stat Soc Ser B (Methodological) 1995:289–300. [Google Scholar]
- 33.Igawa M, Atsumi Y, Takahashi K, et al. Activation of visual cortex in REM sleep measured by 24-channel NIRS imaging. Psychiatry Clin Neurosci 2001;55:187–188. [DOI] [PubMed] [Google Scholar]
- 34.Fedele T, van 't Klooster M, Burnos S, et al. Automatic detection of high frequency oscillations during epilepsy surgery predicts seizure outcome. Clin Neurophysiol 2016;127:3066–3074. [DOI] [PubMed] [Google Scholar]
- 35.Zijlmans M, Jacobs J, Zelmann R, Dubeau F, Gotman J. High frequency oscillations and seizure frequency in patients with focal epilepsy. Epilepsy Res 2009;85:287–292. [DOI] [PMC free article] [PubMed] [Google Scholar]
- 36.Gliske SV, Irwin ZT, Davis KA, Sahaya K, Chestek C, Stacey WC. Universal automated high frequency oscillation detector for real-time, long term EEG. Clin Neurophysiol 2016;127:1057–1066. [DOI] [PMC free article] [PubMed] [Google Scholar]
- 37.Alkawadri R, Gaspard N, Goncharova II, et al. The spatial and signal characteristics of physiologic high frequency oscillations. Epilepsia 2014;55:1986–1995. [DOI] [PMC free article] [PubMed] [Google Scholar]
- 38.Pearce A, Wulsin D, Blanco JA, Krieger A, Litt B, Stacey WC. Temporal changes of neocortical high-frequency oscillations in epilepsy. J Neurophysiol 2013;110:1167–1179. [DOI] [PMC free article] [PubMed] [Google Scholar]
- 39.Devinsky O, Romanelli P, Orbach D, Pacia S, Doyle W. Surgical treatment of multifocal epilepsy involving eloquent cortex. Epilepsia 2003;44:718–723. [DOI] [PubMed] [Google Scholar]


