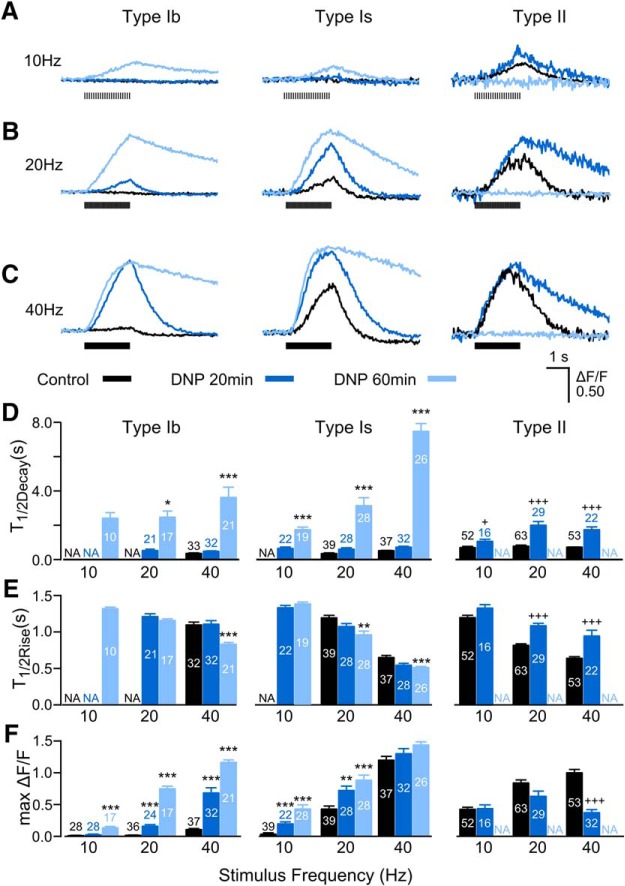
Figure 14.
Drastic effects of prolonged DNP treatment on Ca2+ dynamics in all three types of synapses. A–C, Overlaid representative GCaMP Ca2+ signal ΔF/F traces under 10-, 20-, and 40-Hz stimulation, after 0-, 20-, and 60-min exposure to DNP (black, blue, and light blue, respectively). Note that type II synapses (right column) completely lost responses after a 60-min exposure (light blue), and within a 20-min exposure, about half of type II synapses had already lost responses (data not shown). D–F, Summary bar charts for the half-decay time, half-rise time, and maximum ΔF/F of GCaMP Ca2+ signal under 10, 20, and 40 Hz of repetitive stimulation. N.A., not applicable because the corresponding GCaMP ΔF/F traces were too small or simply nonresponsive to stimulation, thus excluded from kinetic determination (e.g., type II after a 60-min DNP treatment, and type Ib and Is at low stimulation frequencies). Number of boutons (sampled from six different larvae) are indicated. KW tests with Bonferroni corrections were performed among each frequency group; * and +p < 0.05, **p < 0.01, *** and +++p < 0.001. For type II synapses after a 20-min DNP treatment, + and +++ denote statistical differences with the dwindling sample sizes due to loss of responses in some type II NMJs after DNP treatment.

