

Abstract
Telomere length (TL) measurement is central to many biomedical research, population, and epidemiology studies, with promising potential as a clinical tool. Various assays are used to determine TL, depending on the type and size of the sample. We describe the detailed optimization of a monochromatic multiplex real-time quantitative PCR (MMqPCR) assay for relative TL using the LightCycler 480. MMqPCR was initially developed using a different instrument with many separate reagents. Differences in instrument performance, reagents, and workflow required substantial optimization for the assay to be compatible with the LightCycler 480. We optimized the chemistry of the assay using a purchased one-component reaction mix and herein describe sources of variability and quality control relevant to the MMqPCR TL assay on any instrument. Finally, the assay was validated against other TL assays, such as terminal restriction fragment, Southern blot, and flow fluorescent in situ hybridization. The correlations obtained between data from MMqPCR and these assays (R2 = 0.88 and 0.81) were comparable to those seen with the monoplex version (R2 = 0.85 and 0.82) when the same samples were assayed. The intrarun and interrun CV ranged from 4.2% to 6.2% and 3.2% to 4.9%, respectively. We describe a protocol for measuring TL on the LightCycler platform that provides a robust high-throughput method applicable to clinical diagnostics or large-scale studies of archived specimens.
Telomeres are nucleoprotein complexes at the ends of eukaryotic chromosomes. In humans, telomeres are noncoding double-stranded nucleotide repeats (TTAGGG)n, approximately 9 to 15 kb in length, that preserve chromosome stability and integrity.1 In somatic cells, telomeres shorten with each cell division. The progressive shortening of telomeres to a critical length ultimately leads to cell senescence, affecting health and lifespan.2 Telomere length (TL) is therefore a marker of cellular aging, and TL shortening is associated with increased risk for many age-related diseases and conditions.3 In particular, shorter leukocyte TL (LTL) is associated with increased risk of atherosclerosis and cardiovascular disease.4 Consequently, there is great interest in reliably measuring TL in different biomedical research applications. However, the concept of measuring TL beyond the research arena, as part of routine clinical care or commercial tests, remains controversial. This controversy is partly because inherent interindividual variability and a lack of standardization in its measurement limit the usefulness of TL and hinder its possible addition as a useful diagnostic tool. Despite this, some contend that clinical relevance of TL will improve as more data are collected and may in the future have a role in a multifactorial health assessment.5 For example, there are consistent data supporting the association between short LTL and cardiovascular health. Data from the Framingham Heart Study reveal associations between shorter LTL and systemic oxidative stress, increased carotid intimal medial thickness in obese men, higher renin to aldosterone ratio, and lower left ventricular mass.6, 7, 8, 9 Similarly, LTL is negatively associated with a cardiovascular risk score developed by the Scottish Intercollegiate Guidelines Network (SIGN) known as ASSIGN (Assessing cardiovascular risk using SIGN),10 whereas the Framingham risk score is associated with the proportion of leukocytes with telomeres shorter than 5 kb.11 The implementation of TL measurements in the standard of care will necessitate the development of high-throughput techniques with low variability and cost.
Several techniques are currently used to measure TL. Among them, terminal restriction fragment (TRF) measurement by traditional Southern blot is widely used. However, TRFs include subtelomeric DNA that can vary in length among individuals, depending on the particular restriction enzyme used, introducing interindividual variation independent of true TL. TRF measurements require large amounts of DNA (0.5 to 5 μg per individual) and is a lengthy assay with a lack of standardization, hindering interlaboratory comparisons.12 Flow fluorescence in situ hybridization (FISH) is another widely used assay capable of measuring TL in subsets of cells.13 Although this capability presents some advantage, flow FISH assays require a minimum of approximately 1 to 2 mL of fresh blood and cannot be used on solid tissues or archived samples.12, 14 Furthermore, both TRF and flow FISH methods are labor intensive,15 restricting their feasibility in large-scale studies.
In 2002, Cawthon16 established a high-throughput real-time quantitative PCR (qPCR)–based method using partially mismatched primers to amplify the tandem repeats of telomeric DNA. In this monoplex assay, the telomere fluorescent signals (T) of experimental DNA are quantified in one plate and normalized to the signal of a single-copy nuclear gene (S) in another plate to generate a T/S ratio proportional to the mean TL. This assay can measure relative TL in a small amount of DNA (10 ng) and in archived specimens. In 2009, a monochrome multiplex qPCR (MMqPCR) strategy was developed that determines the relative quantity of two amplicons with greatly different copy numbers and melting temperatures in a single tube. The threshold cycle (CT) values for the first and more abundant target (T) are collected at earlier cycles, when the signal for the less abundant target signal (S) is still at baseline.17
Considering the increasing interest in measuring TL in biomedical research, clinical diagnostics, and commercial applications, accurate and high-throughput methods are in demand. As of November 2015, 516 and 147 publications in the PubMed Central archive have cited Cawthon's 200216 and 200917 publications, respectively. The advent of the MMqPCR would have been expected to end the use of the monoplex qPCR method because MMqPCR is categorically superior. It features lower variability,12 costs less, has improved concordance with alternate techniques,17 and requires lower amounts of sample material. Measured T/S ratios are virtually independent from pipetting volume, thereby reducing operator-induced variability. Despite these theoretical advantages, studies continue to be published using monoplex qPCR.
On the basis of personal experience and communications, we believe that an impediment to the broader adoption of the MMqPCR method is rooted in the challenges encountered by many laboratories that tried to implement this assay with their instruments and reagents. Other confounders, such as different qPCR instruments, standard calibration, single-copy gene used, and assay variability, may also exacerbate this problem.
The initial MMqPCR assay published used the Bio-Rad MyiQ Single Color Real-Time PCR Detection System.17 We initially used the same conditions on the LightCycler 480 (F. Hoffmann-La Roche AG, Basel, Switzerland), another qPCR platform widely used in both research and clinical settings. However, dissimilarities in instrument performance, commercial reagents, and workflow required substantial optimization. In this article, this process is described in detail because it may fulfill a need in the laboratory and research community and promote the adoption of the MMqPCR TL assay. In doing so, we discuss general sources of variability and quality control (QC) criteria that should apply to MMqPCR users irrespective of their platform.
Materials and Methods
Ethics Statement
This study was approved by the University of British Columbia Research Ethics Board. All study participants and volunteer blood donors provided written informed consent.
Study Specimens
Human cord blood (n = 33), placenta (n = 25), and dried blood spot (DBS) (n = 58) specimens were randomly selected from previously published studies.18, 19 In addition, cultured human colorectal adenocarcinoma cells HT-29 (HTB-38; ATCC, Manassas, VA) treated with HIV antiretrovirals (n = 36) from a previous study were used.20
DNA Extraction and Storage
Whole-blood (WB) total genomic DNA were extracted using the QIAcube and QIAamp DNA Mini Kit (Qiagen, Hilden, Germany) according to the manufacturer's blood and body fluid protocol with the following modifications: 100 μL of WB was diluted in 100 μL of 1× phosphate-buffered saline, and DNA was eluted in 100 μL of Buffer AE (Qiagen), consisting of 10 mmol/L Tris-Cl, 0.5 mmol/L EDTA, pH 9.0. Extracted DNA from blood was stored in Buffer AE at −80°C until used. Genomic DNA from harvested HT-29 cells was extracted using the QIAamp DNA Blood Mini Kit (Qiagen) and resuspended in 200 μL of elution buffer (Qiagen). DNA from HT-29 cells were stored in elution buffer (Qiagen) at −20°C until used.
DBS total DNA was extracted using the Qiagen Dried Blood Spot protocol with the following modifications: DNA was extracted from six 3-mm-diameter paper punch disks obtained from a single blood spot for each DBS. In the automated QIACube extraction protocol, 350 μL of Buffer ATL (Qiagen), 20 μL of proteinase K solution, 300 μL of Buffer AL, and 150 μL of 95% ethanol were used. DBS DNA was eluted in 50 μL of Buffer AE at stored at −80°C until used.
qPCR
Relative TL was expressed as a ratio of the quantity of telomeric DNA (T) normalized to the copy number of a single-copy nuclear gene (S), yielding the T/S ratio. Two qPCR assays were used: a monochrome monoplex two-tube method and a monochrome multiplex one-tube method, referred to hereafter as MMqPCR. The monoplex qPCR was performed as previously described16 with previously established modifications.21 Polymerase (DNA-directed), γ2, accessory subunit (POLG2) and albumin (ALB) were used as the single-copy nuclear gene in the monoplex qPCR and MMqPCR assays, respectively. All primers were purified by the manufacturer using high-performance liquid chromatography. Their sequences are presented in Table 1.
Table 1.
Primer Sequences
| Primer | Assay type | Nucleotide sequence |
|---|---|---|
| ASPG3F | Monoplex qPCR | 5′-GAGCTGTTGACGGAAAGGAG-3′ |
| ASPG4R | Monoplex qPCR | 5′-CAGAAGAGAATCCCGGCTAAG-3′ |
| Tel1b | Monoplex qPCR | 5′-CGGTTTGTTTGGGTTTGGGTTTGGGTTTGGGTTTGGGTT-3′ |
| Tel2b | Monoplex qPCR | 5′-GGCTTGCCTTACCCTTACCCTTACCCTTACCCTTACCCT-3′ |
| AlbuF | MMqPCR | 5′-CGGCGGCGGGCGGCGCGGGCTGGGCGGAAATGCTGCACAGAATCCTTG-3′ |
| AlbdR | MMqPCR | 5′-GCCCGGCCCGCCGCGCCCGTCCCGCCGGAAAAGCATGGTCGCCTGTT-3′ |
| TelgF | MMqPCR | 5′-ACACTAAGGTTTGGGTTTGGGTTTGGGTTTGGGTTAGTGT-3′ |
| TelcR | MMqPCR | 5′-TGTTAGGTATCCCTATCCCTATCCCTATCCCTATCCCTAACA-3′ |
Bold nucleotides represent noncomplementary GC clamps, and roman nucleotides represent genome complementary regions.
MMqPCR, monochromatic multiplex real-time quantitative PCR; qPCR, real-time quantitative PCR.
MMqPCR
The multiplex assay was performed using a modified existing assay.17, 21 For each MMqPCR PCR reaction, 8 μL of master mix and 2 μL of DNA (approximately 20 ng/μL) were added to wells of a 96-well plate (F. Hoffmann-La Roche AG) in duplicate. The final concentrations of reagents in the master mix were 1X LightCycler SYBR Green I Master (F. Hoffmann-La Roche AG), 1.2 mmol/L EDTA (Sigma-Aldrich Corporation, St. Louis, MO), and 0.9 μmol/L of each of the four MMqPCR primers (Table 1). Before PCR, the plates were centrifuged at 1500 × g for 2 minutes at room temperature. The qPCR was performed on a LightCycler 480 using the following thermal cycling profile and ramping temperature rates (Figure 1).
Figure 1.

PCR cycling profile. Schematic of the monochromatic multiplex real-time quantitative PCR cycling profile, describing each stage. Program and segment markers as referenced on LightCycler 480 raw output are shown. The circles represent fluorescence signal acquisitions.
The thermal cycling profile was initiated with a 95°C enzyme activation (hot-start) incubation for 15 minutes. This was followed by two cycles of 94°C for 15 seconds (2.2°C/s) and 49°C for 15 seconds (2.2°C/s) and then 40 cycles of 94°C for 15 seconds, 62°C for 10 seconds (2.2°C/s), 74°C for 15 seconds, 84°C for 10 seconds, and 88°C for 15 seconds, with signal acquisitions at the end of the 74°C and 88°C stages. After cycling, a melting curve program was run starting with a 95°C incubation for 1 minute, followed by continuous acquisitions every 0.2°C for 45°C to 95°C (ramping at 0.11°C/s). All temperature ramping rates were set at 4.4°C/s or 2.2°C/s where indicated, except the melting curve, which was ramping at 0.11°C/s. Data were acquired using the LightCycler 480 software version 1.5.1.62 SP2 (F. Hoffmann-La Roche AG). Each run included a single standard curve, a negative control, and two positive internal controls (ICs).
A standard curve was generated by serial dilution (1:2) of WB pooled from 24 healthy individuals, ranging from approximately 21 to 0.16 ng/μL of DNA across eight standards, resulting in a 128-fold linear range (R2 > 0.99). Standard curves were included in a center column of each plate to avoid plate edge effects. The T/S ratios were calibrated using a coefficient based on samples (n = 35) that were assayed using both MMqPCR and flow FISH,18 such that the leukocyte T/S ratio obtained with MMqPCR approximated the mean lymphocyte TL in kilobases determined by flow FISH. Measurements were performed in duplicates for both samples and ICs, allowing a total of 40 samples per run.
Because the LightCycler instrument software does not currently permit dual signal acquisition processing, data were exported in text format then imported into Microsoft Excel to separate the 74°C acquisition data from 88°C acquisition data by sorting the Program and Segment markers in the LightCycler 480 software output (Figure 1). The 74°C acquisition was defined as program 3 segment 3, and the 88°C acquisition was program 3 segment 5. Acquisition-delineated data were then converted to grid format in LC480 Conversion version 2.0, a free software from the Heart Failure Research Center in Amsterdam, Netherlands, and available online (Heart Failure Research Center, http://www.hartfaalcentrum.nl/index.php?main=files&fileName=LC480Conversion.zip&description=LC480Conversion:%20conversion%20of%20raw%20data%20from%20LC480&sub=LC480Conversion, last accessed December 21, 2015). Baseline corrections and CT calculations were obtained using LinRegPCR version 2012.1 (Heart Failure Research Center) as previously described.22 The software establishes a baseline and aligns the exponential phase of the fluorescence curve for all samples to produce a common window of linearity. The CT is then defined as one cycle below the upper bound of the window of linearity to ensure that the fluorescence threshold is reached during exponential amplification. Individual sample efficiencies generated by LinRegPCR were not used here. Instead, the PCR efficiency for each acquisition was calculated from the standard curve included on each plate.
Alternate TL Assays (TRF and Flow FISH)
Mean TRF lengths from human placentae and cultured HT-29 cells were measured as previously described.20, 23 Median TL from cord blood lymphocytes and granulocytes were determined using flow FISH13 as previously described. Placenta, HT-29 cells, and cord blood were used as a matter of convenience because the TRF and flow FISH assays had already been performed on these specimens.
MMqPCR QC
In each run, a long telomere IC (LT-IC), a short telomere IC (ST-IC), and a no template negative control that consisted of Buffer AE were included. The LT-IC consisted of pooled WB DNA extracts, and the ST-IC was DNA extracted from cultured cells (K562). The IC T/S ratios, PCR efficiencies, and percentage differences among duplicates were logged for each run. Apart from the requirement that the negative control must be negative or extremely low (>3 CT below the lowest standard) and the fact that all collected data must lie within the bounds of the standard curve, QC for this assay was established around five criteria: i) the T/S ratio of the LT-IC must be within means ± 2 SDs of logged values from previous runs performed under the same conditions; ii) the T/S ratio of the ST-IC must be within means ± 2 SDs of logged values from previous runs performed under the same conditions; iii) based on the standard curve, the PCR efficiencies for both the 74°C and the 88°C acquisitions must individually lie between 90% and 100% (between 1.80- and 2.00-fold amplification per cycle); iv) the difference between the two PCR efficiencies must be <2.5% (or <0.05-fold amplification per cycle); and v) the mean of the absolute difference in T/S ratio among duplicates, [=abs(value 1 − value 2) × 100/(mean of values 1 and 2)], for all 40 samples in a run must be <10%.
Informally, if one of the ICs moved in the same direction for >7 consecutive runs, the assay was halted for investigation of the instrument. To avoid rejecting an excessive percentage of runs, a run was accepted if it met at least four of the five QC criteria. Within an accepted run, individual samples for which duplicate T/S values varied by >15% among them (as per the equation described in the fifth QC criterion) were repeated in duplicate. If the repeat duplicates still differed by >15%, these were averaged with data from the first set of duplicates, and their value accepted if the four replicates revealed a CV (SD × 100%/mean) <10%. Any sample that failed all these conditions was rejected permanently and excluded from further analyses.
Statistical Analysis
Pearson's correlations and one-sample t-tests were performed using XLSTAT 2013 version 1.01 (Addinsoft, Paris, France). P ≤ 0.05 was considered statistically significant. Assay CVs were calculated as SD × 100%/mean of T/S ratios. Intra-assay variability was derived from the CV among individual wells, and interassay variability was the CV calculated from the mean value of duplicate measurements of LT-IC from multiple plates.
Results
Our group transitioned from the monoplex qPCR to the MMqPCR assay for TL measurements after the publication of the latter. Although a strong correlation was initially obtained between MMqPCR and monoplex qPCR,21 we noticed over time an unacceptably high variability and several other issues that are described in detail below. This investigation was also partly prompted by changes in qPCR reaction mix products by manufacturers and reaction mix variations among manufacturers.
MgCl2 and EDTA Titration
We noticed the presence of nonspecific peaks in the melting curve of MMqPCR reactions prepared with the described primers and thermal cycling profile, using the LightCycler SYBR Green I Master reaction mix as is, with no added MgCl2 or EDTA (Figure 2A and Figure 3A). The intensity of these nonspecific peaks was greater at lower DNA concentrations. This was accompanied by a PCR efficiency >100% in the 88°C acquisition (Figure 4, A and B). The addition of MgCl2 increased the prominence of the nonspecific peaks (Figure 2, B–D) and further inflated the apparent 88°C acquisition PCR efficiency (Figure 4, A and B). Because the MgCl2 concentration of the reaction mix was not disclosed by the manufacturer, an EDTA titration was performed to increase primer specificity by chelating free MgCl2 present in the purchased reaction mix. The addition of EDTA decreased nonspecific product peak (Figure 3) and normalized the 88°C PCR efficiency to the desired range (Figure 4B). Furthermore, we found that MgCl2 impeded amplicon peak fluorescence, whereas EDTA increased it (Figure 4, C and D). The addition of EDTA to a final concentration of 1.2 mmol/L gave optimal results for this specific reaction mix.
Figure 2.

MgCl2 titration melting curves. Melting curves were derived using change in relative fluorescence units (ΔRFU) per 0.2°C on various amounts of pooled human whole-blood DNA. Melting curves for the following conditions are shown: 0 (A), 1 (B), 2 (C), and 3 (D) mmol/L added MgCl2. The arrow indicates the dissociation peak of a nonspecific peak present in all conditions.
Figure 3.

EDTA titration melting curves. Melting curves were derived using change in relative fluorescence units (ΔRFU) per 0.2°C on various amounts of pooled human whole-blood DNA. Melting curves for the following conditions are shown: 0 (A), 0.4 (B), 0.8 (C), 1.2 (D), and 1.6 (E) mmol/L added EDTA. The arrow indicates the dissociation peak of a nonspecific peak present in A through C.
Figure 4.

PCR efficiency and peak fluorescence for MgCl2 and EDTA titrations. PCR efficiencies for both acquisitions were calculated using a single 8-point standard curve (R2 > 0.99). PCR efficiencies for MgCl2 (A) and EDTA (B) titrations. Peak fluorescence was defined by the relative fluorescence unit (RFU) at the 40th cycle for both acquisitions and both internal controls (ICs). Peak fluorescence values for MgCl2 (C) and EDTA (D) titrations. Each data point represents a single DNA sample. LT, long telomere; ST, short telomere.
Validating Amplicon Specificity
The specificity of the products was verified by gel electrophoresis (Figure 5) and melting curve analysis (Figure 6). In the agarose gel, amplicon band sizes reflect theoretical amplicon sizes and are further verified through comparison with products obtained with individual telomere or ALB primer pairs (Figure 5). Primer dimers are visible only in the negative controls, with a CT far higher (approximately 33) than the established limit of quantification (approximately 27.5). Reducing multiplex amplification to 30 cycles eliminates the band in the negative control while preserving the desired products, indicating that primer dimers do not interfere with quantification of unknown DNA samples above the limit of quantification (Figure 5). Melting curve analysis after the full 40 cycles yielded only a single peak representative of ALB amplicon dissociation. It is thus necessary to stop the program at 25 cycles to observe melting peaks of both telomere and ALB amplicons (Figure 6).
Figure 5.

Visualization of amplicons on 3% agarose gel. Lanes 1 and 9 were loaded with a 100-bp ladder. Lanes 2 through 6 are PCR products after the standard 40-cycle profile. Lane 2 is the long telomere internal control (LT-IC) with all primers, lane 3 is the short telomere internal control (ST-IC) with all primers, and lane 4 is negative control (using DNA elution buffer) with all primers. Lane 5 is the LT-IC with only ALB primers, and lane 6 is the LT-IC with only telomere primers. Lanes 7 and 8 are PCR products after only 30 cycles, with the rest of the program kept the same. Lane 7 is the LT-IC with all primers, and lane 8 is negative control (DNA elution buffer) with all primers. All PCR products were diluted 1:10 before loading onto the agarose gel.
Figure 6.
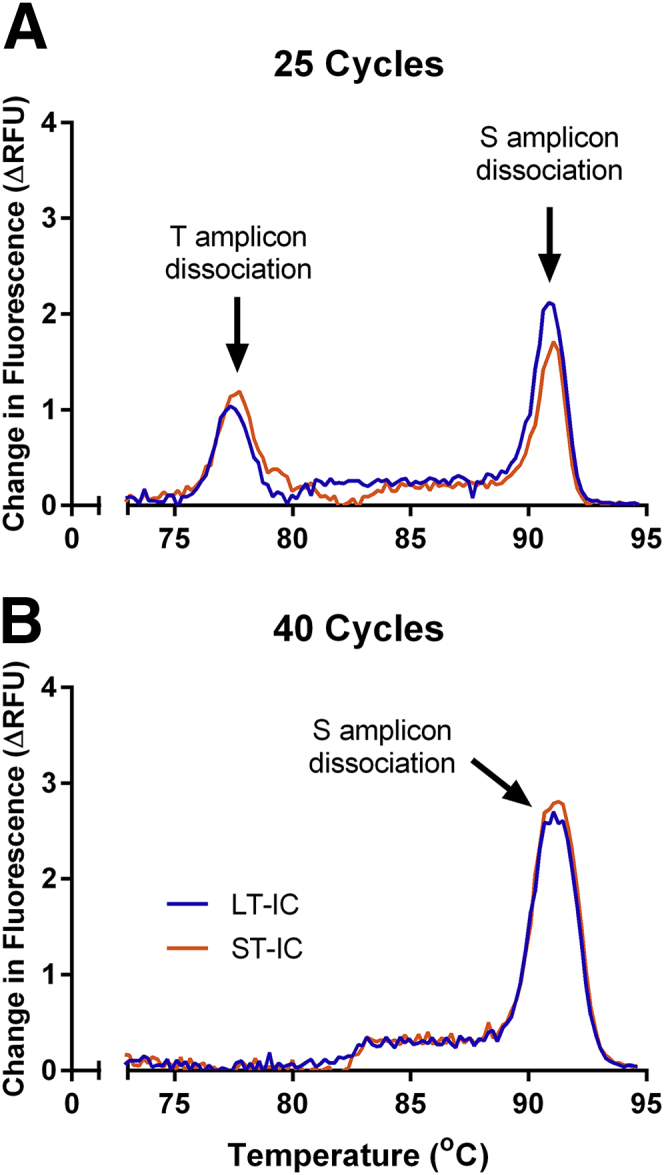
Telomere and ALB product melting curves after 25 and 40 cycles. Melting curves were derived using change in relative fluorescence units (ΔRFU) per 0.2°C on long telomere internal control (LT-IC) and short telomere internal control (ST-IC) after 25 (A) and 40 (B) cycles.
Difference in CT among Acquisitions
The T signal is derived from the 74°C acquisition that is composed of the additive fluorescence from both the telomere and the ALB amplicons present in the reaction at that stage. The assay relies on quantifying the T signal before the ALB signal rises above baseline. Thus, a sufficiently large T/S ratio in the sample (ensuring an adequate ΔCT between the 74°C and 88°C acquisitions) is essential to minimize the infringement of S in the T signal. In a DNA sample with critically short TL, the 88°C acquisition is nonnegligible when the 74°C signal reaches CT, thereby confounding the measured T/S (Supplemental Figure S1).
To determine the minimum T/S that can be accurately measured with this protocol, we measured T/S ratio of the LT-IC and ST-IC using a series of standard curves built with varying T/S ratios. The standard curves were created with DNA extracted from placenta, which has naturally long telomeres, spiked with varying amounts of a plasmid that contains the ALB gene. It was found that LT-IC T/S ratios calculated based on standard curves with low T/S ratios are underestimated (Figure 7A). The sizable amount of ALB amplicon fluorescence in the 74°C acquisitions of a low T/S standard curve could not serve as an accurate reference for the relatively high T/S LT-IC, in which the presence of ALB amplicon fluorescence in the 74°C acquisitions is negligible. The LT-IC T/S ratio stabilized when the standard curve's T/S ratio was approximately >6 (Figure 7A), indicating that ALB fluorescence signal in the 74°C acquisition became negligible beyond this point and that a sufficient ΔCT had been reached. These results were reproduced using ST-IC revealing the same minimum T/S threshold (unpublished data generated by A.Y.Y.H.). Therefore, this minimum T/S ratio must be present in the standard curve and in all samples to ensure a valid output with this assay.
Figure 7.
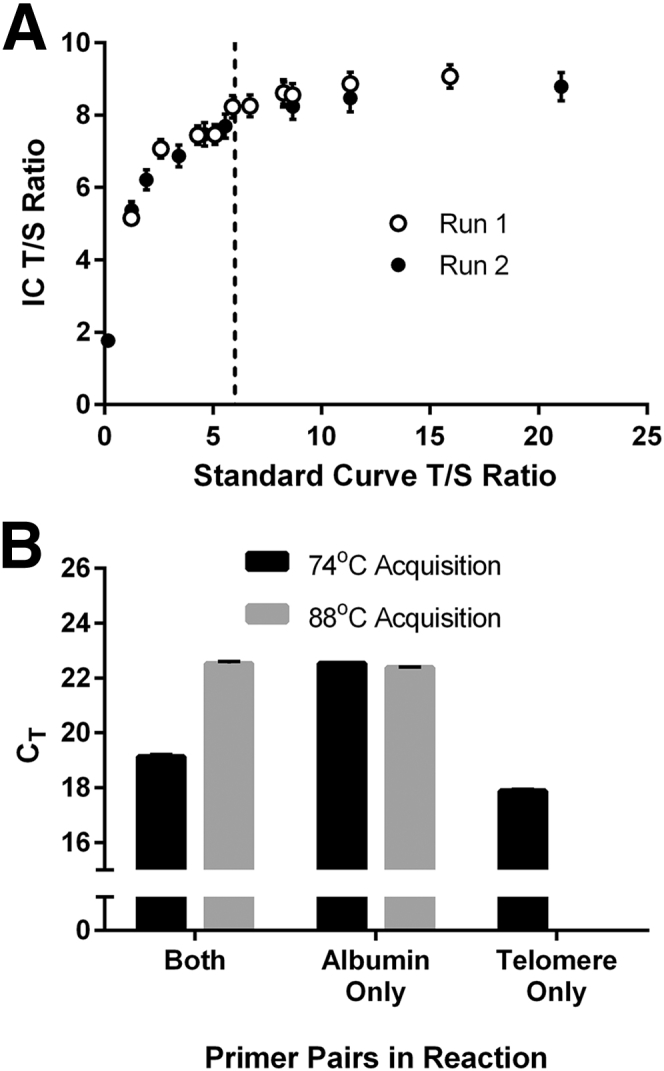
Minimum quantifiable telomere/single-copy nuclear gene (T/S) ratio and amplification with individual primer pairs. A: T/S ratios of long telomere internal control (LT-IC) were calculated using standard curves prepared from placenta DNA, a tissue with LTs, spiked with varying quantities of a plasmid containing the ALB amplicon (without GC clamps). Theoretical standard curve T/S ratios are shown on the x axis and IC T/S ratios on the y axis. IC T/S ratios were from two runs, each containing six technical replicates. The vertical dotted line marks the minimum quantifiable T/S ratio, which is 6. B: Threshold cycle (CT) values of both acquisitions are shown when the reaction contained the following primer combinations: albu+albd+telg+telc, albu+albd only and telg+telc only. Data points are derived from six to eight technical replicates. Error bars indicate SDs.
To directly quantify the ALB fluorescence signal in the 74°C acquisition, ALB primers were removed from the MMqPCR reaction (Figure 7B). This resulted in a lower telomere CT, revealing that telomere amplification may be partially inhibited by the presence of ALB primers. Consequently, ALB amplicon fluorescence in the 74°C acquisition could not be directly quantified. The assay was also performed in the absence of telomere primers from the reaction to verify that telomere amplicons are completely dissociated before the 88°C acquisition (Figure 7B). The CT of ALB was unchanged, indicating that no telomere amplicon is present during the 88°C acquisition.
Variability and Limit of Quantification
Although the linear range of this assay extends past the lowest point on the standard curve, increased variability was observed below this point (Figure 8). This is likely due to stochastic sampling effects such that sampling becomes governed by Poisson distributions. In addition, rejection due to QC failure is high at these low DNA concentrations. This effect is driven by variability in the amplification of ALB, which is present at lower abundance. To avoid these sampling errors, the limit of quantification for our assay was thus defined at the concentration of the last standard: 160 pg/uL. This is equivalent to a CT of 27.5 in the 88°C acquisition. As such, the defined standard curve serves a dual purpose by ensuring that data are being collected both in the linear range of this assay for each gene and above the limit of reliable quantification. Of note, because CT determination does not take into account the first two cycles of amplification at 49°C, the 27.5 CT underestimates the true number of doublings that have occurred in the entire reaction.
Figure 8.
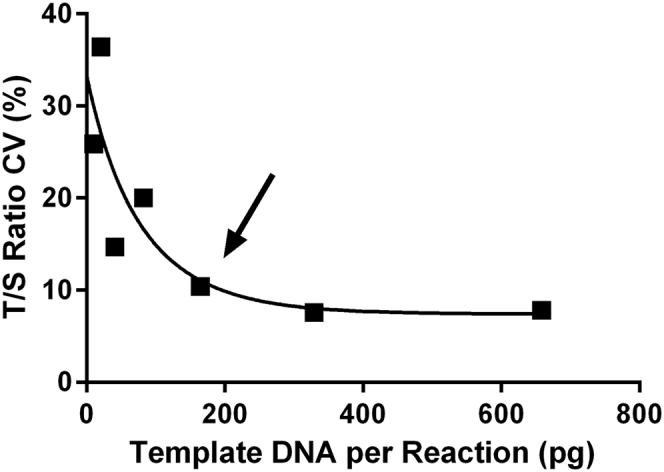
Limit of quantification. The telomere/single-copy nuclear gene (T/S) ratios of various amounts of pooled human whole-blood DNA were measured. Each data point represents the CV calculated from the T/S ratio of 10 technical replicates. The arrow indicates the concentration of the limit of quantification: approximately 160 pg of DNA per reaction.
We calculated the mean percent difference among T/S ratio duplicates for all samples in each run and used these data to detect any random or transient plate-wide sources of variability. If this mean exceeded 10%, the run is rejected if it violated any of the other four QC criteria. In our experience, this resulted in a 7% rejection rate (7 of 100 total runs). Similar transient and unsystematic errors that might only affect individual random wells were addressed by rejecting samples with T/S ratios that differed by >15% among duplicates. In two of our recent studies (both with n ≥ 1000) with two different operators, these errors resulted in the initial rejection of approximately 4% of all samples. However, as per our QC protocol, these samples were repeated in duplicate, and ultimately all yielded usable data.
The fluctuation and linearity of T/S across a range of DNA concentrations were investigated using the standard curve because this could represent another source of variability. To monitor this and determine the range over which the T/S ratio is stable, both the standard curves and the T/S versus S linear regression were plotted for each run. Standard curves that appear seemingly linear (R2 > 0.99) may still exhibit T/S ratios that fluctuate in a DNA concentration–dependent manner (Supplemental Figure S2). This error is presumably sourced from dissimilarities in PCR efficiencies of the two amplicons. On the basis of a large number of runs, it was determined that as part of the QC criteria, the difference between the two PCR efficiencies should not exceed 2.5% or 0.05-fold amplification per cycle. In our experience, the mean T/S ratio CV across the eight standards included in each run was approximately 7% after 64 runs by three different operators.
Reproducibility of the MMqPCR Assay
To examine the intra-assay and interassay reproducibility of T/S measurements by MMqPCR, T/S ratios of the LT-IC were used. LT-IC assayed in 91 wells of a single run was used to establish an intra-assay CV of 6.2%. In a separate run with a different operator and using just 14 wells to avoid the edge of the plate, an intra-assay CV of 4.2% was observed. To examine interassay reproducibility, we determined the CV of LT-IC T/S ratios of three different studies by three different operators during 2 years. Interassay CVs were measured at 3.2% (n = 27 runs), 4.3% (n = 38 runs), and 4.9% (n = 9 runs). Plate position effects were quantified by column, row, and individual wells (Supplemental Figure S3).
Concordance between Relative TL Measured Using MMqPCR versus Other Methods
Flow FISH was performed on the lymphocyte and granulocyte subsets in cord blood specimens (n = 33) covering a twofold range of T/S ratios. A strong correlation was observed between lymphocyte and granulocyte TL measured by flow FISH and LTL by MMqPCR (R2 = 0.81 and 0.71, P < 0.0001) (Figure 9A). We previously collected LTL data on a subset of these cord blood specimens (n = 24) using monoplex qPCR.18 Similar correlations were observed between lymphocyte and granulocyte TL measured by monoplex qPCR and flow FISH (R2 = 0.82 and 0.70, P < 0.0001) (Figure 9B). TRF was used to determine the absolute TL (in kilobases) in placenta specimens (n = 21) and cultured HT-29 cells treated with HIV antiretrovirals (n = 36). Placenta is a tissue with long TL, and the HT-29 cells have artificially reduced TL after exposure to the antiretrovirals. Together, they represent a fourfold range of T/S. A strong correlation was observed between relative TL measured by MMqPCR and the absolute TRF values (R2 = 0.88, P < 0.0001) (Figure 10A), and a similar correlation was seen between the monoplex qPCR and TRF values (R2 = 0.85, P < 0.0001) (Figure 10B).
Figure 9.
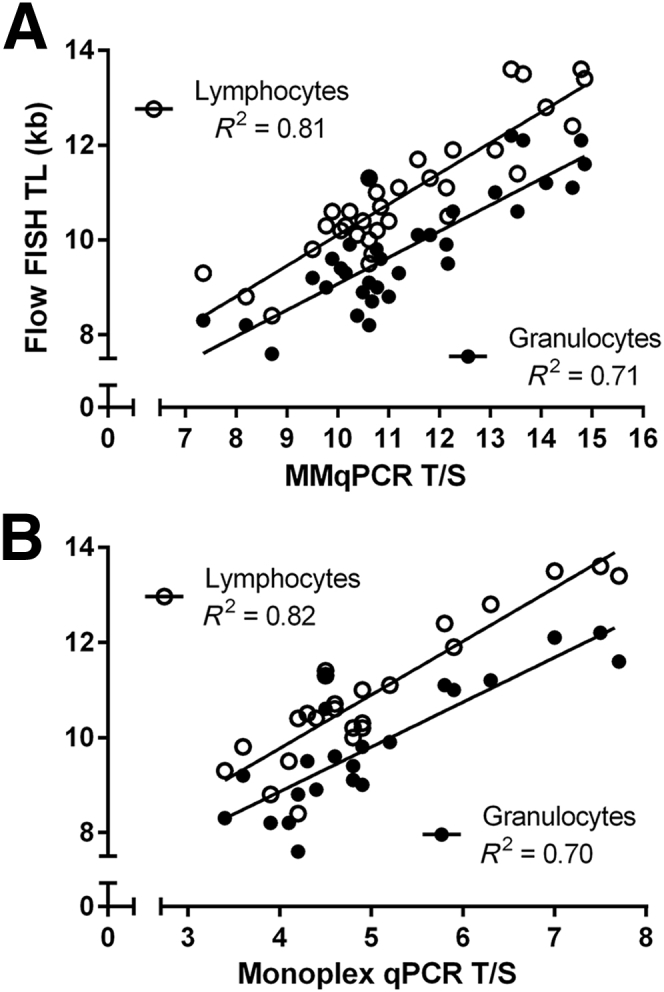
Pearson's correlation between flow fluorescence in situ hybridization (FISH) and monochromatic multiplex real-time quantitative PCR (MMqPCR). Telomere length (TL) in cord blood samples (n = 33) were measured by flow FISH, MMqPCR, and monoplex qPCR. A: Correlations between mean MMqPCR shorter leukocyte TL (LTL) and median flow FISH lymphocyte and granulocyte TL. B: Correlations between monoplex qPCR LTL and flow FISH lymphocyte and granulocyte TL. Pearson's R2 is shown. P < 0.0001 for all.
Figure 10.
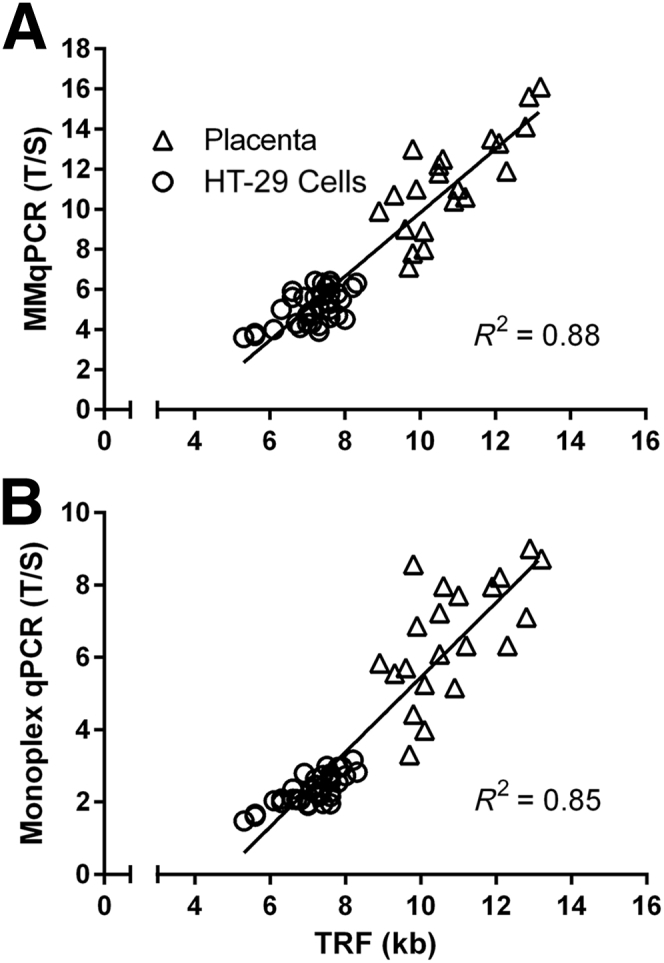
Pearson's Correlation between terminal restriction fragment (TRF) and real-time quantitative PCR (qPCR). Telomere length (TL) in placenta (n = 21) and HT-29 cell culture (n = 36) were measured by TRF Southern blot and qPCR. TRF data were compared with monochromatic multiplex qPCR (MMqPCR) (A) and monoplex (B) qPCR. Pearson's R2 is shown. P < 0.0001 for all.
Concordance between Relative TL Measured Using MMqPCR versus Monoplex qPCR
Monoplex qPCR and MMqPCR were performed on DBS (n = 58) and cord blood (n = 26), spanning a threefold range of T/S ratios. A strong correlation was observed for each gene (S, R2 = 0.78, P < 0.0001; T, R2 = 0.66, P < 0.0001), as well as between the T/S ratios (R2 = 0.67, P < 0.0001) as measured by the two qPCR methods (Figure 11). Similar correlations were observed in each subset of DBS and cord blood samples (Supplemental Figure S4).
Figure 11.

Pearson's correlation between monoplex real-time quantitative PCR (qPCR) and monochromatic multiplex qPCR (MMqPCR). TL in dried blood spot samples (n = 58) and cord blood samples (n = 26) were measured by monoplex qPCR and MMqPCR. Two techniques were correlated on telomere/single-copy nuclear gene (T/S) (A), T (B), and S (C), using both sample sets combined (n = 84). Pearson's R2 is shown. P < 0.0001 for all.
Discussion
Although qPCR-based TL assays offer many substantial advantages for high-throughput studies, commercial applications, and potentially routine health diagnostics, they have often been described as less precise than other established methods, such as Southern blot, flow FISH, Q-FISH, and single-telomere length analysis (STELA).12, 24, 25 As such, there is a qualified demand in the literature for increased robustness and more rigorous QC and calibration when using TL assays based on qPCR.12, 26 Therefore, improvements to reduce variability and increase reproducibility were a leading priority during our optimization of this assay.
The primary impetus behind this report was to share our experience in implementing this assay and perhaps aid others in the adoption of the MMqPCR method to measure TL. A substantial contribution toward this goal is the use of a purchased one-component reaction mix, which decreases the number of reagents while facilitating high-throughput implementation. Purchased reaction mixes benefit from industry-standard QC, which contributes to lowering interassay variability, especially within a given lot. They may also decrease interoperator variability owing to the lower complexity of the reaction mix preparation. In contrast, the publication of the original MMqPCR technique describes a method that involves eight separate reagents,17 excluding primers and sample DNA. Six years later, numerous studies continue to use convoluted multireagent versions of MMqPCR. Few studies describe the use of commercial purchased reaction mixes with MMqPCR, and those that do may not include the level of methodologic detail that would facilitate a wider adoption of the assay. We provide detailed methods for an MMqPCR TL assay on the LightCycler 480, using the same primers as those originally described, in a reaction mix that involves only two components apart from primers and template DNA.
In our experience, it was necessary to add EDTA to Roche reaction mix to bolster primer specificity and eliminate nonspecific products. Conversely, the addition of surplus MgCl2 worsened nonspecific peaks (Figure 2) in the melting curve. These effects were not initially expected because manufacturers often recommend that users determine experimentally how much MgCl2, rather than a chelator such as EDTA, should be added to their reaction. Because this effect is likely reaction mix dependent, melting curve titration analyses may help determine optimal cation concentration.
Adhering to certain limitations on sample DNA was found to reduce assay variability and improve reproducibility. One such restriction is the lower limit of DNA concentration, below which a substantial increase in variability is observed due to stochastic sampling error. This occurrence may be resolved by increasing the number of technical replicates and using more rigorous QC, although variability seems to increase rapidly with decreasing DNA concentration. Others have reported required DNA sample quantity for MMqPCR to be in the range of nanograms,12, 27 and studies within the past few years describe protocols performed on 5 to 40 ng of cellular DNA.28, 29, 30, 31, 32, 33 We report the lower limit of DNA for robust quantification by MMqPCR to be severalfold lower, at 160 pg of cellular DNA. This finding may enable TL studies on very small specimens, such as blood droplets or microdissection material.
On the basis of our data, it is clear that assaying samples with very low mean TL will result in an overestimated T/S ratio because of ALB signal present in the 74°C acquisition. Under our assay conditions, this finding occurs when T/S ratios are approximately ≥6, as defined by our standards. Because of the lack of universal ICs or standard curves, measured T/S ratios are not directly comparable among laboratories, and as such, it may be beneficial for others wishing to adopt this assay to set a minimum acceptable ΔCT between the 74°C and 88°C acquisitions. Here, the lower limit in ΔCT between the two acquisitions was approximately 3.6. Optimally, we suggest that users wishing to adopt this assay conduct a standard curve T/S ratio titration to determine the lower T/S ratio limit under which the assay loses robustness.
Efforts to subtract the undesired ALB signal from that of the 74°C acquisition signal in silico to obtain a pure telomere signal have yielded data with an equivalent or weaker association to reference monoplex qPCR and flow FISH assays (unpublished data generated by A.Y.Y.H.). However, to measure DNA samples with extremely low mean TL, it may be possible to adjust for the logarithmic pattern reported here (Figure 7A) to arithmetically remove the systematic bias caused by ALB signal in the 74°C acquisition. Otherwise, it may be necessary to revert to the monoplex qPCR method for measuring samples with very short mean telomeres. Previous efforts in our laboratory to optimize the MMqPCR using unbalanced primer concentrations (3:1 ratio of telomere to ALB primer) yielded larger ΔCT among acquisitions (unpublished data generated by A.Y.Y.H.). However, we found that those conditions resulted in higher variability and lower correlation with flow FISH compared with balanced primer concentrations (unpublished data generated by A.Y.Y.H.). Nevertheless, such concessions could be made for the purpose of measuring mean telomere lengths that are shorter than the assay's T/S ratio limit of stability using MMqPCR.
The LightCycler 480 software is incapable of performing analyses on multiple acquisitions per cycle, as needed for MMqPCR. This therefore requires the use of external software, such as LinRegPCR, to process data, introducing a potential source of operator error; however, this LightCycler disadvantage can be mitigated by tools such as a Microsoft Excel macro.
The Minimum Information for Publication of Quantitative Real-Time PCR Experiments published in 2009 is a useful and comprehensive reference for qPCR considerations.34 However, the nature of MMqPCR necessitates considerations beyond those relevant to conventional qPCR. A key example is the determination of the lower T/S ratio limit mentioned earlier. Another potential concern is dissimilarity between efficiencies of the 74°C and 88°C acquisitions. Uneven efficiencies between T and S can introduce variability in T/S ratios, especially near the edges of the expected linear range of quantification. Apart from determining PCR efficiencies, the standard curve can be used to monitor the T/S ratio's dependence on DNA concentration. Despite highly linear regression of individual acquisitions of the standard curves, the actual T/S ratio may still deviate among standards (Supplemental Figure S2). Such an effect may be missed if ICs have T and S measures that fall in the middle of the standard curves. Therefore, in addition to recording the difference in PCR efficiencies between the two acquisitions, it may be necessary to incorporate more than one IC to cover the range where this effect might be more prominent. We aimed for a T/S ratio CV of <10% across the eight standards of the standard curve included in each run. If this variability increases over time, it may indicate inadequate storage conditions of the standards. Other potential causes for further deviation include extension past the linear range, amplification of nonspecific products, or, as mentioned above, noncollinear 74°C and 88°C standard curves.
As in all intercalator dye-based qPCR assays, the specificity of the primers for the desired MMqPCR amplicons is crucial and was verified here through agarose gel electrophoresis. As shown in the original publication, shortening the cycling program from 40 to 25 cycles is necessary to visualize the dissociation of both amplicons on the melting curve.17 Indeed, in melting curve analyses performed after the full 40 cycle program (Figure 6B), only the ALB product dissociation is visible. It is presumed that after 40 cycles, the two amplicons become sufficiently abundant to saturate the dye. Thus, when temperature rises above T product dissociation, released SYBR Green binds to free double stranded ALB amplicon, thereby stifling the T amplicon's dissociation peak in the melting curve.
Comparison of TL measurements across different techniques is required to validate the MMqPCR. The original publication previously revealed a strong correlation (R2 = 0.84) between relative TL in WB DNA samples (n = 95) measured by MMqPCR and the mean TRF lengths by the traditional Southern blot approach.17 This correlation is higher than the correlation for relative TL in the same samples determined by monoplex qPCR versus their mean TRF lengths (R2 = 0.68).17 In our study, we found similarly strong correlations comparing TRF against both qPCR techniques (R2 = 0.88 and R2 = 0.85) when considering DNA samples with a wide range of TL. Robust correlations were also seen for both monoplex qPCR and MMqPCR versus flow FISH data in cord blood, irrespective of the subset of the cells (lymphocytes versus granulocytes, R2 = 0.70 to 0.82). Our data suggest that concordance between MMqPCR and alternative techniques is not greatly improved compared with monoplex qPCR, when examined using a several tissues with varying TL. However, MMqPCR is considerably more time and labor efficient.
We previously reported a strong correlation for relative TL (n = 32) determined by monoplex qPCR and MMqPCR assays (R2 = 0.65).21 Here, MMqPCR and monoplex qPCR assays across a wide range of samples (n = 84) were compared once again and revealed similar concordance (R2 = 0.67).
The range of intra-assay and interassay variability reported for qPCR has been broad compared with other techniques,24, 25 and its reporting in the literature is inconsistent. However, a previous study reported no statistically significant difference in intra-assay or interassay variability among qPCR, Southern Blot, or STELA in aggregate data across 10 laboratories.25 It further revealed that although the absolute relative TL values from different laboratories differed widely, their rankings highly correlated (correlation coefficients of 0.63 to 0.99).25 We suggest that better understanding of sources of variability and addressing them with appropriate optimization and QC should lower MMqPCR variability to the range reported for other techniques. We also strongly believe that intra-assay and interassay variability should be included in all publications that involved MMqPCR TL assays.
Although MMqPCR is quickly becoming the most attractive method for TL measurement, it is limited by the fact that it only measures mean TL. Unlike methods such as flow FISH or STELA, it cannot deduce TL of individual cells or single molecules. Consequently, it is limited in its detection of TL heterogeneity, a physiologically relevant marker. Moreover, qPCR-based TL data are inherently relative and are not directly comparable among laboratories. Although others have advocated the use of either universal or synthetic oligonucleotide standards to address this,25, 35 neither solution has reached widespread implementation as of yet. The incompatibility of data among laboratories remains an unsolved issue. Furthermore, adoption of MMqPCR by research groups has proven difficult because of the ambiguity of both its procedure and sources of variability. This report should contribute to mitigating such ambiguity and aid in the broad adoption of this assay. It still remains the most cost-effective method for measuring mean TL, the best suited method for large-scale studies, with arguably the greatest potential for broad adoption as a routine clinical tool. A more comprehensive consensus on how to report the use of MMqPCR and the distribution of universal calibration standards would help further this effort. We expect shared knowledge and experience with MMqPCR to deepen over time, enabling it to become the staple method for precise mean TL measurements.
Acknowledgments
We thank all study participants and volunteers, Dr. Peter Lansdorp for the use of flow FISH data, Dr. Judy Wong for the use of TRF data, and Drs. Grant Edmonds and Sarah Hampson for the use of qPCR data collected as part of past studies cited in the text.
A.Y.Y.H. and S.S. are both guarantors of this work and, as such, had full access to all of the data in the study and both take responsibility for the integrity of the data and the accuracy of the data analysis.
Footnotes
Partially supported by Canadian Institutes of Health Research Emerging Team grant TCO-125269 on Cellular Aging and HIV Comorbidities in Women and Children (H.C.F.C.) and Center for Blood Research Internal Collaborative Training Awards for 2012-2013 (S.S.) and 2013-2014 (A.Y.Y.H.). qPCR data collected by Drs. Grant Edmonds and Sarah Hampson as part of past studies cited in the text were supported by NIH grant R21AG045015.
A.Y.Y.H. and S.S. contributed equally to this work.
Disclosures: None declared.
Supplemental material for this article can be found at http://dx.doi.org/10.1016/j.jmoldx.2016.01.004.
Supplemental Data
Supplemental Figure S1.

Fluorescence curves of long and short telomere specimens. Fluorescence curves of both acquisitions of a long telomere placenta (A) and a short telomere cord blood (B) specimen. The circles represent the threshold cycle of the 74°C acquisition.T/S, telomere/single-copy nuclear gene.
Supplemental Figure S2.

Impact of small fluctuations in standard curves. A and B: Both acquisitions of two very linear standard curves are given as examples. Log [S] on the x axis is derived from the logarithm of albumin copy numbers of each standard. Pearson's R2 and PCR efficiencies (Eff) are given. C: Telomere/single-copy nuclear gene (T/S) ratios from the DNA-independent standard curve in A. D: Small fluctuations in the standard curve of drive DNA dependence in the T/S ratio (B). Differences in PCR efficiency between the two acquisitions are given. CT, threshold cycle.
Supplemental Figure S3.

Plate position effects. A long telomere internal control was measured in every well on 96-well plates, except well D7, which was used as a negative template control. A: The absolute difference in CV between the telomere/single-copy nuclear gene (T/S) ratio of each well and the plate mean is shown. This difference represents a roughly normal distribution, with approximately half of the wells deviating above the plate mean. The mean of the data from each column and row are given. Variability across columns (B) and rows (C) are shown. Error bars represent SDs calculated from the number of replicates in each column (n = 12) or each row (n = 8). Columns or rows significantly different from plate mean (using one-sample t-test) are marked, with P values and effect sizes shown. Mean effect sizes are given as the percentage difference of each row or column compared with the mean of the plate. These data are derived from the mean of three runs.
Supplemental Figure S4.

Pearson's correlation between monoplex and monochromatic multiplex real-time quantitative PCR (MMqPCR). Telomere length in cord blood (n = 26) and dried blood spot (n = 58) samples were measured by monoplex and MMqPCR. Correlations between the two techniques were determined using cord blood on telomere/single-copy nuclear gene (T/S) (A), T (B), and S (C) and using dried blood spots on T/S (D), T (E), and S (F). Pearson's R2 is shown. P < 0.0001 for all.
References
- 1.Moyzis R.K., Buckingham J.M., Cram L.S., Dani M., Deaven L.L., Jones M.D., Meyne J., Ratliff R.L., Wu J.R. A highly conserved repetitive DNA sequence, (TTAGGG)n, present at the telomeres of human chromosomes. Proc Natl Acad Sci U S A. 1988;85:6622–6626. doi: 10.1073/pnas.85.18.6622. [DOI] [PMC free article] [PubMed] [Google Scholar]
- 2.Nilsson P.M., Tufvesson H., Leosdottir M., Melander O. Telomeres and cardiovascular disease risk: an update 2013. Transl Res. 2013;162:371–380. doi: 10.1016/j.trsl.2013.05.004. [DOI] [PubMed] [Google Scholar]
- 3.Zhu H., Belcher M., van der Harst P. Healthy aging and disease: role for telomere biology? Clin Sci (Lond) 2011;120:427–440. doi: 10.1042/CS20100385. [DOI] [PMC free article] [PubMed] [Google Scholar]
- 4.Farzaneh-Far R., Cawthon R.M., Na B., Browner W.S., Schiller N.B., Whooley M.A. Prognostic value of leukocyte telomere length in patients with stable coronary artery disease data from the heart and soul study. Arterioscler Thromb Vasc Biol. 2008;28:1379–1384. doi: 10.1161/ATVBAHA.108.167049. [DOI] [PMC free article] [PubMed] [Google Scholar]
- 5.Wolinsky H. Testing time for telomeres: telomere length can tell us something about disease susceptibility and ageing, but are commercial tests ready for prime time? EMBO Rep. 2011;12:897–900. doi: 10.1038/embor.2011.166. [DOI] [PMC free article] [PubMed] [Google Scholar]
- 6.Demissie S., Levy D., Benjamin E.J., Cupples L.A., Gardner J.P., Herbert A., Kimura M., Larson M.G., Meigs J.B., Keaney J.F., Aviv A. Insulin resistance, oxidative stress, hypertension, and leukocyte telomere length in men from the Framingham Heart Study. Aging Cell. 2006;5:325–330. doi: 10.1111/j.1474-9726.2006.00224.x. [DOI] [PubMed] [Google Scholar]
- 7.O'Donnell C.J., Demissie S., Kimura M., Levy D., Gardner J.P., White C., D'Agostino R.B., Wolf P.A., Polak J., Cupples L.A., Aviv A. Leukocyte telomere length and carotid artery intimal medial thickness R the Framingham Heart Study. Arterioscler Thromb Vasc Biol. 2008;28:1165–1171. doi: 10.1161/ATVBAHA.107.154849. [DOI] [PMC free article] [PubMed] [Google Scholar]
- 8.Vasan R.S., Demissie S., Kimura M., Cupples L.A., Rifai N., White C., Wang T.J., Gardner J.P., Cao X., Benjamin E.J., Levy D., Aviv A. Association of leukocyte telomere length with circulating biomarkers of the renin-angiotensin-aldosterone system: the Framingham Heart Study. Circulation. 2008;117:1138–1144. doi: 10.1161/CIRCULATIONAHA.107.731794. [DOI] [PMC free article] [PubMed] [Google Scholar]
- 9.Vasan R.S., Demissie S., Kimura M., Cupples L.A., White C., Gardner J.P., Cao X., Levy D., Benjamin E.J., Aviv A. Association of leukocyte telomere length with echocardiographic left ventricular mass: the Framingham Heart Study. Circulation. 2009;120:1195–1202. doi: 10.1161/CIRCULATIONAHA.109.853895. [DOI] [PMC free article] [PubMed] [Google Scholar]
- 10.Lu L., Johnman C., McGlynn L., Mackay D.F., Shields P., Pell J.P. Association between telomere length, inflammation and cardiovascular risk. Eur J Public Health. 2014;24:2014. [Google Scholar]
- 11.Fyhrquist F., Silventoinen K., Saijonmaa O., Kontula K., Devereux R.B., de Faire U., Os I., Dahlöf B. Telomere length and cardiovascular risk in hypertensive patients with left ventricular hypertrophy: the LIFE study. J Hum Hypertens. 2011;25:711–718. doi: 10.1038/jhh.2011.57. [DOI] [PubMed] [Google Scholar]
- 12.Aubert G., Hills M., Lansdorp P.M. Telomere length measurement—caveats and a critical assessment of the available technologies and tools. Mutat Res. 2012;730:59–67. doi: 10.1016/j.mrfmmm.2011.04.003. [DOI] [PMC free article] [PubMed] [Google Scholar]
- 13.Baerlocher G.M., Vulto I., de Jong G., Lansdorp P.M. Flow cytometry and FISH to measure the average length of telomeres (flow FISH) Nat Protoc. 2006;1:2365–2376. doi: 10.1038/nprot.2006.263. [DOI] [PubMed] [Google Scholar]
- 14.Wieser M., Stadler G., Böhm E., Borth N., Katinger H., Grillari J., Voglauer R. Nuclear flow FISH: isolation of cell nuclei improves the determination of telomere lengths. Exp Gerontol. 2006;41:230–235. doi: 10.1016/j.exger.2005.09.013. [DOI] [PubMed] [Google Scholar]
- 15.Lauzon W., Dardon J.S., Cameron D.W., Badley A.D. Flow cytometric measurement of telomere length. Cytometry. 2000;42:159–164. doi: 10.1002/1097-0320(20000615)42:3<159::aid-cyto1>3.0.co;2-9. [DOI] [PubMed] [Google Scholar]
- 16.Cawthon R.M. Telomere measurement by quantitative PCR. Nucleic Acids Res. 2002;30:e47. doi: 10.1093/nar/30.10.e47. [DOI] [PMC free article] [PubMed] [Google Scholar]
- 17.Cawthon R.M. Telomere length measurement by a novel monochrome multiplex quantitative PCR method. Nucleic Acids Res. 2009;37:1–7. doi: 10.1093/nar/gkn1027. [DOI] [PMC free article] [PubMed] [Google Scholar]
- 18.Imam T., Jitratkosol M.H., Soudeyns H., Sattha B., Gadawski I., Maan E., Forbes J.C., Alimenti A., Lapointe N., Lamarre V. Leukocyte telomere length in HIV-infected pregnant women treated with antiretroviral drugs during pregnancy and their uninfected infants. J Acquir Immune Defic Syndr. 2012;60:495–502. doi: 10.1097/QAI.0b013e31825aa89c. [DOI] [PubMed] [Google Scholar]
- 19.Edmonds G.W., Côté H.C., Hampson S.E. Childhood conscientiousness and leukocyte telomere length 40 years later in adult women—preliminary findings of a prospective association. PLoS One. 2015;10:e0134077. doi: 10.1371/journal.pone.0134077. [DOI] [PMC free article] [PubMed] [Google Scholar]
- 20.Hukezalie K.R., Thumati N.R., Côté H.C., Wong J.M. In vitro and ex vivo inhibition of human telomerase by anti-HIV nucleoside reverse transcriptase inhibitors (NRTIs) but not by non-NRTIs. PLoS One. 2012;7:e47505. doi: 10.1371/journal.pone.0047505. [DOI] [PMC free article] [PubMed] [Google Scholar]
- 21.Zanet D.L., Saberi S., Oliveira L., Sattha B., Gadawski I., Côté H.C. Blood and dried blood spot telomere length measurement by qPCR: assay considerations. PLoS One. 2013;8:e57787. doi: 10.1371/journal.pone.0057787. [DOI] [PMC free article] [PubMed] [Google Scholar]
- 22.Ruijter J.M., Ramakers C., Hoogaars W.M., Karlen Y., Bakker O., Van Det alen Hoff M.J., Moorman A.F. Amplification efficiency: linking baseline and bias in the analysis of quantitative PCR data. Nucleic Acids Res. 2009;37:e45. doi: 10.1093/nar/gkp045. [DOI] [PMC free article] [PubMed] [Google Scholar]
- 23.Wong J.M., Collins K. Telomerase RNA level limits telomere maintenance in X-linked dyskeratosis congenita. Genes Dev. 2006;20:2848–2858. doi: 10.1101/gad.1476206. [DOI] [PMC free article] [PubMed] [Google Scholar]
- 24.Aviv A., Hunt S.C., Lin J., Cao X., Kimura M., Blackburn E. Impartial comparative analysis of measurement of leukocyte telomere length/DNA content by Southern blots and qPCR. Nucleic Acids Res. 2011;39:1–5. doi: 10.1093/nar/gkr634. [DOI] [PMC free article] [PubMed] [Google Scholar]
- 25.Martin-Ruiz C.M., Baird D., Roger L., Boukamp P., Krunic D., Cawthon R., Dokter M.M., van der Harst P., Bekaert S., de Meyer T., Roos G., Svenson U., Codd V., Samani N.J., McGlynn L., Shiels P.G., Pooley K.A., Dunning A.M., Cooper R., Wong A., Kingston A., von Zglinicki T. Reproducibility of telomere length assessment: an international collaborative study. Int J Epidemiol. 2015;44:1673–1683. doi: 10.1093/ije/dyu191. [DOI] [PMC free article] [PubMed] [Google Scholar]
- 26.Nussey D.H., Baird D., Barrett E., Boner W., Fairlie J., Gemmell N., Hartmann N., Horn T., Haussmann M., Olsson M., Turbill C., Verhulst S., Zahn S., Monaghan P. Measuring telomere length and telomere dynamics in evolutionary biology and ecology. Methods Ecol Evol. 2014;5:299–310. doi: 10.1111/2041-210X.12161. [DOI] [PMC free article] [PubMed] [Google Scholar]
- 27.Montpetit A.J., Alhareeri A.A., Montpetit M., Starkweather A.R., Elmore L.W., Filler K., Mohanraj L., Burton C.W., Menzies V.S., Lyon D.E. Telomere length: a review of methods for measurement. Nurs Res. 2014;63:289–299. doi: 10.1097/NNR.0000000000000037. [DOI] [PMC free article] [PubMed] [Google Scholar]
- 28.Blackburn N., Charlesworth J., Marthick J., Tegg E., Marsden K., Srikanth V., Blangero J., Lowenthal R., Foote S., Dickinson J. A retrospective examination of mean relative telomere length in the Tasmanian Familial Hematological Malignancies Study. Oncol Rep. 2015;33:25–32. doi: 10.3892/or.2014.3568. [DOI] [PMC free article] [PubMed] [Google Scholar]
- 29.Buxton J.L., Walters R.G., Visvikis-Siest S., Meyre D., Froguel P., Blakemore A.I. Childhood obesity is associated with shorter leukocyte telomere length. J Clin Endocrinol Metab. 2011;96:1500–1505. doi: 10.1210/jc.2010-2924. [DOI] [PMC free article] [PubMed] [Google Scholar]
- 30.Concetti F., Carpi F.M., Nabissi M., Picciolini M., Santoni G., Napolioni V. The functional polymorphism rs73598374: G> A (p. Asp8Asn) of the ADA gene is associated with telomerase activity and leukocyte telomere length. Eur J Hum Genet. 2015;23:267–270. doi: 10.1038/ejhg.2014.102. [DOI] [PMC free article] [PubMed] [Google Scholar]
- 31.Lan Q., Cawthon R., Gao Y., Hu W., Hosgood H.D., Barone-Adesi F., Ji B.T., Bassig B., Chow W.H., Shu X., Cai Q., Xiang Y., Berndt S., Kim C., Chanock S., Zheng W., Rothman N. Longer telomere length in peripheral white blood cells is associated with risk of lung cancer and the rs2736100 (CLPTM1L-TERT) polymorphism in a prospective cohort study among women in China. PLoS One. 2013;8:1–6. doi: 10.1371/journal.pone.0059230. [DOI] [PMC free article] [PubMed] [Google Scholar]
- 32.Ramunas J., Yakubov E., Brady J.J., Corbel S.Y., Holbrook C., Brandt M., Stein J., Santiago J.G., Cooke J.P., Blau H.M. Transient delivery of modified mRNA encoding TERT rapidly extends telomeres in human cells. FASEB J. 2015;15:1930–1939. doi: 10.1096/fj.14-259531. [DOI] [PMC free article] [PubMed] [Google Scholar]
- 33.Weischer M., Bojesen S.E., Nordestgaard B.G. Telomere shortening unrelated to smoking, body weight, physical activity, and alcohol intake: 4,576 general population individuals with repeat measurements 10 years apart. PLoS Genet. 2014;10:e1004191. doi: 10.1371/journal.pgen.1004191. [DOI] [PMC free article] [PubMed] [Google Scholar]
- 34.Bustin S.A., Benes V., Garson J.A., Hellemans J., Huggett J., Kubista M., Mueller R., Nolan T., Pfaffl M.W., Shipley G.L., Vandesompele J., Wittwer C.T. The MIQE guidelines:Minimum Information for publication of quantitative real-time PCR experiments. Clin Chem. 2009;55:611–622. doi: 10.1373/clinchem.2008.112797. [DOI] [PubMed] [Google Scholar]
- 35.O'Callaghan N.J., Fenech M. A quantitative PCR method for measuring absolute telomere length. Biol Proced Online. 2011;13:3. doi: 10.1186/1480-9222-13-3. [DOI] [PMC free article] [PubMed] [Google Scholar]