

Abstract
Pulmonary inhalation chemotherapeutic drug delivery offers many advantages for lung cancer patients in comparison to conventional systemic chemotherapy. Inhalable particles are advantageous in their ability to deliver drug deep in the lung by utilizing optimally sized particles and higher local drug dose delivery. In this work, spray-dried and co-spray dried inhalable lung surfactant-mimic PEGylated lipopolymers as microparticulate/nanoparticulate dry powders containing paclitaxel were rationally designed via organic solution advanced spray drying (no water) in closed-mode from dilute concentration feed solution. Dipalmitoylphosphatidylcholine (DPPC) and dipalmitoylphosphatidylethanolamine poly(ethylene glycol) (DPPE-PEG) with varying PEG chain length were mixed with varying amounts of paclitaxel in methanol to produce co-spray dried microparticles and nanoparticles. Scanning electron microscopy showed the spherical particle morphology of the inhalable particles. Thermal analysis and X-ray powder diffraction confirmed the retention of the phospholipid bilayer structure in the solid-state following spray drying, the degree of solid-state molecular order, and solid-state phase transition behavior. The residual water content of the particles was very low as quantified analytically Karl Fisher titration. The amount of paclitaxel loaded into the particles was quantified which indicated high encapsulation efficiencies (43–99%). Dry powder aerosol dispersion performance was measure in vitro using the Next Generation Impactor™ (NGI™) coupled with the Handihaler® dry powder inhaler device and showed mass median aerodynamic diameters in the range of 3.4–7µm. These results demonstrate that this novel microparticulate/nanoparticulate chemotherapeutic PEGylated phospholipid dry powder inhalation aerosol platform has great potential in lung cancer drug delivery.
Keywords: Dry Powder Inhaler (DPI), Respiratory Drug Delivery, Biocompatible Biodegradable Lipopolymers, Nanotechnology, Nanomedicine, Lung Surfactant, Self-assemblies, Paclitaxel, anticancer, DPPC/DPPE-PEG, Particle Engineering, Organic Solution Advanced Spray Drying
GRAPHICAL ABSTRACT
1.1 INTRODUCTION
Inhalation aerosol delivery dates back to ancient times (Hickey and Mansour, 2009; Patton and Byron, 2007) and aerosol formulations have been investigated for many pulmonary diseases including lung infections, cystic fibrosis, chronic obstructive pulmonary disease (COPD), and lung cancer (Arnold et al., 2007; Cartiera et al., 2010; Meenach et al., 2012; Meenach et al., 2013; Watts et al., 2008; Yang et al., 2009). Nebulizers, pressurized metered dose inhalers (pMDIs), soft-mist inhalers (SMIs), and dry powder inhalers (DPIs) are the various types of commercially available pulmonary drug delivery systems currently used in the treatment of human pulmonary diseases and have been described in detail (Hickey and Mansour, 2009). Nebulizers, pMDIs, and SMIs are liquid-based pulmonary inhalation aerosol delivery systems. Of the liquid-based aerosol systems, pMDIs require the use of a propellant whereas nebulizers and SMIs do not contain propellants. The lung is an ideal target for drug delivery owing to the potential to avoid first-pass metabolism, enable a more rapid onset of therapeutic action, high local drug concentrations within the lung, and minimization of systemic absorption of the drug allowing for decreased side effects (Carvalho et al., 2011; Gill et al., 2007; Hickey and Mansour, 2008; Hickey and Mansour, 2009; Sharma et al., 2001; Vaughn et al., 2006). Additionally, for many drugs delivery via intravenous or oral administration routes often result in high systemic drug concentrations while a relatively low amount of the drug actually reaches the lung (Carvalho et al., 2011; Vaughn et al., 2006). Specifically for lung cancer, it has been shown that drug concentrations in lung tumors are often low after systemic administration of chemotherapeutics which could be a cause of treatment failure and in some cases, the initiation of chemotherapeutic resistance (Gagnadoux et al., 2008).
In addition to the general advantages of aerosolized chemotherapy formulations, inhalable dry powder formulations offer the great potential in further improvements in the treatment of lung cancer. This includes the ability to design the particle size and amount of drug loaded into the system, improved chemical stability relative to liquid aerosols, and improved long-term stability during pharmaceutical storage timescales (Hickey and Mansour, 2008; Mansour et al., 2009; Sung et al., 2007). In this study, dry powder nanoparticle/microparticle formulations were designed via organic solution advanced spray drying in closed-mode which has been optimized by our group for the delivery of therapeutics to treat various lung diseases (Li et al., 2011; Li and Mansour, 2011; Meenach et al., 2013; Wu et al., 2013a; Wu et al., 2013b). Spray drying is an advanced high-throughput pharmaceutical manufacturing particle engineering process which can design and efficiently produce respirable particles in the solid-state (Hickey and Mansour, 2008; Kikuchi et al., 1991; Mansour et al., 2009; Mansour et al., 2011). One of the advantages of using spray drying is that it can enable controlled production and tailoring of particles in terms of particle size, particle shape, and surface morphology which all influence aerosol performance characteristics. Particle engineering is particularly important for pulmonary delivery (Tong and Chow, 2006)(Chow et al., 2007). Several particle properties influence the aerosol performance including the aerodynamic diameter (dae), particle size distribution, dispersibility, particle morphology, surface roughness, and interfacial interparticulate interactions (Chow et al., 2007; Dunbar et al., 1998; Hickey et al., 2007). Aerosol particles with dae values of 1–5 µm tend to deposit predominantly in the smaller bronchiolar (lower) airways down to the bronchioalveolar region, whereas those aerosol particles with dae values in the range 5–10 µm deposit in the middle and larger bronchial (upper) airways (Suarez and Hickey, 2000) (Vehring et al., 2007).
While aerosol dry powder formulations utilizing polymers such as poly(lactic-co-glycolic) (PLGA) (Tomoda et al., 2009) and poly(ethylene glycol)-co-poly(sebacic acid) (PEG-PSA) (Tang et al., 2010) have been developed for lung cancer treatment applications, the introduction of foreign matter to the lung has the potential to induce complications. In this work, a first-line lung cancer chemotherapeutic drug, paclitaxel (PTX), was encapsulated in a PEGylated phospholipid microparticle/nanoparticle system comprised of dipalmitoylphosphatidylcholine (DPPC) and dipalmitoylphosphatidylethanolamine-methoxy(polyethylene glycol) (DPPE-PEG). DPPC was chosen as the main excipient because it is the primary phospholipid component in lung surfactant (Mansour et al., 2011). In addition to offering a natural excipient component to the formulated particles, the use of phospholipids as biocompatible biodegradable excipients can aid in the delivery of drugs to the lungs as they have been shown to improve particle migration to the lung periphery due to the reduction in surface tension provided by the surfactant (Ganguly et al., 2008; Mansour et al., 2001; Mansour and Zografi, 2007a, b). The use of PEGylated phospholipids, such as DPPE-PEG, can result in a formulation that could evade recognition and uptake of the immune system allowing for prolonged residence time in the lung (Ishihara et al., 1998; Labiris and Dolovich, 2003a, b; Mansour et al., 2011; Mansour et al., 2010), have mucopenetrating properties (Lai et al., 2009a; Lai et al., 2009b), and are used in marketed intravenous (IV) nanopharmaceutical products (Mansour et al., 2011; Mansour et al., 2010; Rhee and Mansour, 2011; Wu and Mansour, 2011). Also, for certain formulations, the relatively low clearance rate in the bronchioalveolar region may also allow for longer residence times (Carvalho et al., 2011). We have recently reported on the successful design and optimization of the novel DPI nanomedicine carrier platform consisting of DPPC/DPPE-PEG with varying PEG chain length and excellent aerosol dispersion performance as aerosolized dry powders (Meenach et al., 2013).
Paclitaxel was chosen for this study since it is one of the most widely used drugs to treat lung cancer and is a first-line drug in the treatment of lung cancer (Carvalho et al., 2011; Eldar-Boock et al., 2011). Taxol®, the intravenous formulation of paclitaxel contains water-insoluble paclitaxel along with a mixture of Cremophor EL and dehydrated ethanol, and has been shown to cause adverse reactions such as hypersensitivity, muscle pain, and neurologic and cardiac toxicities (Marupudi et al., 2007). Paclitaxel is lipophilic, with high protein affinity, and also exhibits a volume of distribution much higher than the total water volume in the body, which causes it to have a low therapeutic index (Carvalho et al., 2011). The low solubility of paclitaxel in water (0.7 to 30 µg/ml) (Liggins et al., 1997) can be overcome via encapsulation into a solid-state particle system helping to overcome this major hurdle.
The objective of this systematic study was to rationally develop and comprehensively characterize an inhalable PEGylated phospholipid microparticulate/nanoparticulate dry powder aerosol platform containing paclitaxel with varying PEG chain lengths and paclitaxel content for the treatment of lung cancer. The organic solution advanced co-spray dried (co-SD) paclitaxel/PEGylated phospholipid dry powder inhalation aerosol microparticulate/nanoparticulate formulations were compared to one-component systems of spray dried paclitaxel. The formulated particles contained a fixed amount of DPPC to DPPE-PEG with varying PEG chain lengths of 2k, 3k, and 5k and with varying paclitaxel ratios (5, 25, 50, and 75 mole % of paclitaxel overall). To the authors’ knowledge, this is the first time to report on a comprehensive and systematic study on this novel anticancer lipopolymeric dry powder inhalation aerosol formulation platform engineered from organic solution advanced spray drying (i.e. no water) in closed mode consisting of microparticles and nanoparticles of DPPC and DPPE-PEG with varying PEG chain lengths with various combinations of PTX for pulmonary chemotherapeutic delivery in lung cancer.
2.1 MATERIALS AND METHODS
2.1.1 Materials
Synthetic dipalmitoylphosphatidylcholine (DPPC, Molecular Weight: 734.039 g/mol; >99% purity) and dipalmitoylphosphatidylethanolamine-methoxy(polyethylene glycol) (DPPE-PEG, Molecular Weights: 2749.391 g/mol, 3716.304 g/mol, and 5741.510 g/mol which correspond to 2000, 3000 and 5000 molecular weight poly(ethylene glycol) lengths per compound; >99% purity) were obtained from Avanti Polar Lipids (Alabaster, AL, USA). Paclitaxel was obtained from LC Labs (Woburn, MA, USA; 99.5% purity; C47H51NO14·H2O). Methanol (HPLC grade, ACS certified) and chloroform (HPLC grade, ACS certified) were obtained from Fisher Scientific (Pittsburg, PA, USA). HYDRANAL@-Coulomat AD was from Sigma-Aldrich (St. Louis, MO, USA). Ultra-high purity (UHP) dry nitrogen gas was from Scott-Gross (Lexington, KY, USA). All materials were used as received and stored at −20°C.
2.1.2 Organic Solution Advanced Spray-Drying and Co-Spray Drying from Dilute Drug Feed Solution
Advanced spray-drying of co-spray dried (co-SD) paclitaxel-loaded PEGylated phospholipid particles was performed using a B-290 Büchi Mini Spray Dryer coupled with a B-295 Inert Loop and high performance cyclone (all from Büchi Labortechnik AG, Switzerland) in closed-mode using UHP dry nitrogen as the atomizing gas. The nozzle diameter (composed of stainless steel) was 0.7 mm and the spray-drying (SD) particles were separated from the drying gas (using UHP dry nitrogen) in the high-performance cyclone and collected in a sample collector. The feed solutions were prepared by dissolving DPPC and DPPE-PEG (i.e. 95 mole % DPPC to 5 mole % DPPE-PEG) with different amounts of paclitaxel (PTX) ranging from 5 to 75 mole% paclitaxel to total DPPC/DPPE-PEG in methanol to form dilute concentration feed solutions of 0.1% w/v. Based on our previous work (Li et al., 2011; Li and Mansour, 2011; Meenach et al., 2013; Wu et al., 2013a; Wu et al., 2013b), the following spray-drying conditions were used: atomization gas flow rate of 600 L/h, aspiration rate of 35 m3/h, inlet temperature of 150 °C (which represents the primary drying step), and pump rate of 30 mL/min (High P). Table I shows the various formulated particle systems and their corresponding PTX and DPPC/DPPE-PEG amounts and types and outlet temperatures (which represent the secondary drying process temperatures). For pure spray dried (SD) paclitaxel particles, the same atomization gas flow rate, aspiration rate, and inlet temperatures were used as for the PEGylated phospholipid systems. The pump rate was varied at 3 mL/min (Low P), 15 mL/min (Med P), and 30 mL/min (High P). All SD and co-SD powders were stored in glass vials sealed with parafilm in desiccators over indicated Drierite™ desiccant at −23°C under ambient pressure.
Table I.
List of co-spray dried (co-SD) and single-component spray dried (SD) formulations and their corresponding outlet temperatures during spray drying, size, water content, and paclitaxel encapsulation efficiency (EE) and loading. (n = 3, Ave ± SD)
| System | Outlet T (°C) |
Size (µm) | Water (%) |
PTX EE (%) |
PTX Loading (µg PTX/mg particle) |
|---|---|---|---|---|---|
| 5PTX:95DPPC | 50 | 0.946 ± 0.427 | 3.60 ± 0.37 | 99.0 ± 0.3 | 60.2 ± 1.5 |
| 5PTX:95DPPC/DPPE-PEG2k | 52 | 1.095 ± 0.458 | 4.30 ± 0.20 | 95.0 ± 0.2 | 48.4 ± 0.8 |
| 5PTX:95DPPC/DPPE-PEG3k | 54 | 0.963 ± 0.431 | 2.44 ± 0.78 | 99.6 ± 0.2 | 48.2 ± 0.1 |
| 5PTX:95DPPC/DPPE-PEG5k | 55 | 1.567 ± 0.673 | 2.25 ± 0.44 | 94.7 ± 0.2 | 41.3 ± 0.9 |
| 25PTX:75DPPC | 56 | 1.539 ± 0.661 | 3.73 ± 0.96 | 88.5 ± 0.1 | 191.4 ± 0.3 |
| 25PTX:75DPPC/DPPE-PEG2k | 55 | 3.416 ± 0.808 | 4.58 ± 1.31 | 82.3 ± 0.3 | 209.2 ± 0.9 |
| 25PTX:75DPPC/DPPE-PEG3k | 55 | Not measurable | 2.21 ± 0.18 | 99.5 ± 0.4 | 242.6 ± 1.1 |
| 25PTX:75DPPC/DPPE-PEG5k | 54 | Not measurable | 1.47 ± 0.18 | 95.0 ± 0.4 | 212.9 ± 0.9 |
| 50PTX:50DPPC | 50 | 0.801 ± 0.230 | 3.85 ± 0.68 | 85.0 ± 0.4 | 511.0 ± 2.0 |
| 50PTX:50DPPC/DPPE-PEG2k | 51 | 1.001 ± 0.316 | 6.78 ± 1.18 | 62.7 ± 0.4 | 316.8 ± 1.8 |
| 50PTX:50DPPC/DPPE-PEG3k | 50 | 1.215 ± 0.394 | 3.27 ± 0.27 | 73.0 ± 0.4 | 359.1 ± 1.8 |
| 50PTX:50DPPC/DPPE-PEG5k | 52 | Not measurable | 5.78 ± 0.40 | 71.2 ± 0.4 | 330.8 ± 1.8 |
| 75PTX:25DPPC | 38 | 0.778 ± 0.306 | 3.78 ± 0.89 | 87.5 ± 0.4 | 679.9 ± 2.9 |
| 75PTX:25DPPC/DPPE-PEG2k | 38 | 0.781 ± 0.307 | 5.86 ± 0.38 | 84.6 ± 0.4 | 638.2 ± 3.1 |
| 75PTX:25DPPC/DPPE-PEG3k | 33 | 0.876 ± 0.337 | 1.60 ± 0.62 | 76.8 ± 0.4 | 571.2 ± 3.2 |
| 75PTX:25DPPC/DPPE-PEG5k | 35 | 0.765 ± 0.377 | 4.60 ± 0.21 | 82.4 ± 0.2 | 644.7 ± 1.5 |
| 100PTX (Low P) | 73 | 0.631 ± 0.265 | 2.28 ± 0.11 | n/a | n/a |
| 100PTX (Med P) | 81 | 0.624 ± 0.247 | 1.41 ± 0.38 | n/a | n/a |
| 100PTX (High P) | 41 | 0.672 ± 0.274 | 0.44 ± 0.39 | n/a | n/a |
2.1.3 Scanning Electron Microscopy (SEM) for Morphology and Shape Analysis
The shape and surface morphology of particles was evaluated by SEM, using a Hitachi S-4300 microscope (Tokyo, Japan). Samples were placed on double-sided adhesive carbon tabs and were adhered to aluminum stubs (TedPella, Inc., Redding, CA, USA) which were coated with a gold/palladium alloy thin film using an Emscope SC400 sputter coating system at 20 µA for 1 minute under Argon gas. The electron beam with an accelerating voltage of 5 – 10 kV was used at a working distance of 13.3 – 15.3 mm. Images were captured at several magnifications using similar conditions previously reported by the authors.(Meenach et al., 2013).
2.1.4 Particle Sizing and Size Distribution
The mean size, standard deviation, and size range of the particles were determined digitally using SigmaScan™ 5.0 software (Systat, San Jose, CA, USA), as previously reported by the authors.(Meenach et al., 2013) Representative micrographs for each particle sample at 5,000× magnification were analyzed by measuring the diameter of at least 100 particles per image.
2.1.5 Karl Fisher (KF) Coulometric Titration
The water content of all particle powders was chemically quantified by Karl Fisher (KF) coulometric titration, using similar conditions previously reported by the authors.(Li and Mansour, 2011; Meenach et al., 2013; Wu et al., 2013a; Wu et al., 2013b) The measurements were performed with a 737 KF Coulometer coupled with 703 Ti Stand (Metrohm Ltd., Antwerp, Belgium). Approximately 5 mg of powder was dissolved in a known volume of chloroform. The sample solution was injected into the reaction cell that contained HYDRANAL® KF reagent and the water content was then calculated from the resulting reading.
2.1.6 Differential Scanning Calorimetry (DSC)
Thermal analysis and phase transition measurements were carried out using a TA Q200 DSC system (TA Instruments, New Castle, DE, USA) equipped with T-Zero® technology and an automated computer-controlled RSC-90 cooling accessory. Using similar conditions previously reported by the authors (Li and Mansour, 2011; Meenach et al., 2013; Wu et al., 2013a; Wu et al., 2013b), 1 – 3 mg of powder was weighed into hermetic anodized aluminum T-Zero® DSC pans and were sealed hermetically sealed with the T-Zero® hermetic sealer. UHP dry nitrogen gas was used as the purging gas at 50 mL/min. The heating range was 0 – 250 °C at a heating scan rate of 5.00 °C/min.
2.1.7 Powder X-ray Diffraction (XRPD)
XRPD patterns of powder samples were measured by a Rigaku Multiflex X-ray diffractometer (The Woodlands, TX, USA) with a slit-detector Cu Kα radiation source (40 kV, 44 mA, and λ = 1.5406 Å). The scan range was 5 – 50° in 2θ with a scan rate of 2°/min at ambient temperature. The sample was placed on a horizontal quartz glass sample holder plate. These are similar conditions, as previously reported by the authors. (Li and Mansour, 2011; Meenach et al., 2013; Wu et al., 2013a; Wu et al., 2013b).
2.1.8 Attenuated Total Reflectance-Fourier Transform Infrared Spectroscopy (ATR-FTIR)
ATR-FTIR was performed using a Varian Inc. 7000e step-scan spectrometer (Agilent Technologies, Santa Clara, CA, USA). The particle powder was placed on the diamond ATR crystal, covered with a glass cover slip, and held in place with a specialized clamp. ATR crystal and IR spectra were obtained at an 8 cm−1 spectral resolution between 700 and 4000 cm−1. The data was collected and analyzed using Varian Resolutions software.
2.1.9 Hot-Stage Microscopy (HSM)
HSM studies were completed using an Olympus BX51 polarized microscope (Olympus, Japan) equipped with an Instec STC200 heating unit and S302 hot stage (Boulder, CO, USA). The polarized light was filtered by a γ 530 nm U-TP530 filter lens. Powder samples were mounted on a cover glass and heated from 25 °C to 250 °C at a heating rate of 5 °C/min. The heating program was controlled by WinTemp software and images were digitally captured via a SPOT Insight digital camera (Diagnostic Instruments, Inc., Sterling Heights, MI, USA). These are similar conditions, as previously reported by the authors. (Li and Mansour, 2011; Meenach et al., 2013; Wu et al., 2013a; Wu et al., 2013b).
2.1.10 Paclitaxel Loading Analysis via UV-Vis Spectroscopy
UV-Vis was used to determine the amount of paclitaxel loaded into the formulated particle systems. The particles were dissolved in known quantities of methanol prior to analysis. The absorbance intensity was measured at 227 nm using a UV-1800 UV-Vis Shimadzu spectrophotometer and a calibration curve of paclitaxel in methanol was used. The paclitaxel encapsulation efficiency (EE) and loading was calculated as follows:
2.1.11 In Vitro Aerosol Dispersion Performance via Next Generation Impactor™ (NGI™)
In accordance with United States Pharmacopeia (USP) Chapter <601> specifications on aerosols (2006), and as previously reported (Meenach et al., 2013; Wu et al., 2013b), the in vitro aerosol dispersion properties of the dry powder particles were determined using the Next Generation Impactor™ (NGI™) with a stainless steel induction port (i.e. USP throat) attachment (NGI™ Model 170, MSP Corporation, Shoreview, MN, USA), equipped with specialized stainless steel NGI™ gravimetric insert cups (MSP Corporation, Shoreview, MN, USA). The NGI™ was coupled with a Copley TPK 2000 critical flow controller, which was connected to a Copley HCP5 vacuum pump (Copley Scientific, United Kingdom). The airflow rate, Q, was measured and adjusted prior to each experiment using a Copley DFM 2000 flow meter (Copley Scientific, United Kingdom).
The aerosolization studies were experimentally designed by Design Expert™ 8.0.7.1 software (Stat-Ease Corp., MN, USA). Glass fiber filters (55 mm, Type A/E, Pall Life Sciences, Exton, PA, USA) were placed in the stainless steel NGI™ gravimetric insert cups for NGI™ stages 1 through 7 to minimize bounce or re-entrapment (Edwards et al., 1998). Three hydroxypropyl methylcellulose hard capsules (size 3, Quali-V®, Qualicaps® Inc., Whitsett, NC, USA) were each loaded with 10 mg of powder which were then loaded into a high resistance (i.e. high sheer stress) human DPI device, the Handihaler® (Boehringer Ingelheim USA), and tightly inserted into the induction port. The NGI™ was run at a controlled flow rate (Q) at 60 L/minute with a delay time of 10 seconds (NGI™ Flow controller) prior to the capsules being needle-pierced open by the Handihaler® mechanism, where the particles were then drawn into the impactor for 10 seconds. This was done with a total of 3 capsules per sample for a total of 30 mg total per run. For each 30 mg run, the amount of particles deposited onto each stage was determined gravimetrically by measuring the difference in mass of the glass filters after particle deposition. For the NGI™ flow rate of 60 L/minute, the effective cutoff diameters for each impaction stage were calibrated by the manufacturer and stated as: Stage 1 (8.06 µm); Stage 2 (4.46 µm); Stage 3 (2.82 µm); Stage 4 (1.66 µm); Stage 5 (0.94 µm); Stage 6 (0.55 µm); and Stage 7 (0.34 µm). The fine particle dose (FPD), fine particle fraction (FPF), respirable fraction (RF), and emitted dose (ED) were calculated as follows:
The mass mean aerodynamic diameter (MMAD) and geometric standard deviation (GSD) were determined using a Mathematic program written by Dr. Warren Finlay (Finlay, 2008). All experiments were triplicated (n = 3).
2.1.12 Statistical Analysis
All experiments were performed in at least triplicate. The aerosolization studies were experimentally designed by Design Expert™ 8.0.7.1 software (Stat-Ease Corp., MN, USA). MYSTAT 12 for Windows (12.01.00) was used for t-tests (paired t-test with unequal variances) to determine any significance in observed data. A p-value of < 0.05 was considered statistically significant.
3.1 RESULTS AND DISCUSSION
3.1.1 SEM, Particle Sizing, and Size Distribution
Formulated particle and surface morphologies were visualized and analyzed via SEM micrographs as seen in Figures 1 through 5. Their corresponding diameters are exhibited in Table I as determined via SigmaScan™ software. 5PTX:95DPPC, 5PTX:95DPPC/DPPE-PEG2k, and 5PTX:95DPPC/DPPE-PEG3k particles were smooth and spherical whereas 5PTX:95DPPC:DPPE-PEG5k demonstrated characteristics of sintering between the particles. 25PTX:75DPPC and 25PTX:75DPPC/DPPE-PEG2k were also smooth and spherical whereas 25PTX:75DPPC/DPPE-PEG3k and 25PTX:75DPPC/DPPE-PEG5k demonstrated characteristics of sintering between the particles. The 50PTX and 75PTX systems (Figures 3 and 4, respectively) demonstrated an increase in corrugation as seen in Figure 5. This phenomenon was seen in our previous systems comprised of pure SD PTX(Meenach et al., 2013). As the amount of PTX in the particle systems increased, the degree of sintering and corrugation of the particles also increased. The sintering for the particles with high PEG content is likely due to the low glass transition temperature for PEG, which is around −60°C (Törmälä, 1974). The diameter of all formulated dry powder systems ranged from 0.624 to 3.416 µm in diameter and there was a slight decrease in size with increasing amounts of paclitaxel, although this was not significant. There were no changes in the diameter due to the degree of PEGylation from DPPE-PEG. Overall, the particles were within the ideal size range necessary for inhalation into the deep lung for both adults and children (Bosquillon et al., 2001; Coates and O'Callaghan, 2006) which is necessary for effective pulmonary delivery for treating lung cancer.
Figure 1.

SEM micrographs of co-spray dried (co-SD) PEGylated phospholipid particles with varying PEG chain length containing 5% paclitaxel (PTX): (a) co-SD 5PTX:95DPPC; (b) co-SD 5PTX:95DPPC/DPPE-PEG2k; (c) co-SD 5PTX:95DPPC/DPPE-PEG3k; and (d) co-SD 5PTX:95DPPC:DPPE-PEG5k. Magnification for all samples was 10,000×.
Figure 5.

SEM micrographs of spray-dried (SD) 100% paclitaxel particles (100PTX) following spray drying at three pump rates (Low P, Med P, and High P) for: (a) Raw paclitaxel (PTX); (b) SD 100PTX (Low P); (c) SD 100PTX (Med P); and (d) SD 100PTX (High P). Magnification for all samples was 10,000×.
Figure 3.

SEM micrographs of co-spray dried (co-SD) PEGylated phospholipid particles with varying PEG chain length containing 50% paclitaxel (PTX): (a) co-SD 50PTX:50DPPC; (b) co-SD 50PTX:50DPPC/DPPE-PEG2k; (c) co-SD 50PTX:50DPPC/DPPE-PEG3k; and (d) co-SD 50PTX:50DPPC/DPPE-PEG5k. Magnification for all samples was 10,000×.
Figure 4.

SEM micrographs of co-spray dried (co-SD) PEGylated phospholipid particles with varying PEG chain length containing 75% paclitaxel (PTX): (a) co-SD 75PTX:25DPPC; (b) co-SD 75PTX:25DPPC/DPPE-PEG2k; (c) co-SD 75PTX:25DPPC/DPPE-PEG3k; and (d) co-SD 75PTX:25DPPC/DPPE-PEG5k. Magnification for all samples was 10,000×.
3.1.2 Karl Fisher (KF) Coulometric Titration
The residual water content of the formulated particles in the solid-state are shown in Table I. The water content for the co-SD formulated particles ranged from 1.47 % to 6.78 % (w/w) with no trends corresponding to excipient formulation or amount of paclitaxel present in the system. The pure SD PTX particles exhibited the lowest water content ranging from 0.44 % to 2.47 % (w/w). These values were slightly higher than those reported for the raw components (Meenach et al., 2013), however, all of the values were low and well within the range previously reported by our group in other inhalable dry powder formulations (Li and Mansour, 2011) (Meenach et al., 2013; Wu et al., 2013a; Wu et al., 2013b). Low water content is a requirement for efficient dry powder aerosolization and effective particle delivery since water can significantly decrease the dispersion properties of dry powders during aerosolization due to the interparticulate capillary forces acting at the solid-solid interface between particles (Hickey et al., 2007).
3.1.3 Differential Scanning Calorimetry (DSC)
As seen in Figure 6a for the 5PTX particles, an endothermic main phase transition peak (Tm) was observed between 63°C and 65°C for all samples which corresponds to the bilayer main phase transition temperature i.e. gel-to-liquid crystalline phase transition of raw DPPC which, by definition the hydrophobic acyl chain core melts, indicating the presence of the phospholipid bilayer self-assembly structure (Mansour and Zografi, 2007a, b; Pappalardo et al., 2005). The co-SD 5PTX samples with PEG3k and PEG5k also exhibited endothermic peaks at 41.5°C and 47.2°C, respectively, which corresponds to the presence of DPPE-PEG. These two endothermic peaks are also present in raw DPPC and DPPE-PEG as we have shown previously (Meenach et al., 2013). The enthalpy values for the 5PTX particles ranged from 22.1 J/g to 25.7 J/g but there was no correlation due to the excipient used. 25PTX samples (Figure 6b) also exhibited strong transition peaks between 63°C and 66°C and 25PTX:DPPC/DPPE-PEG5k particles showed peaks near 45°C and 47°C. The enthalpy values (delta H) for the 25PTX particles ranged from 13.1 J/g to 20.7 J/g, but there was no correlation due to the excipient used. Both 5PTX and 25PTX systems exhibit an exothermic peak around 145°C which indicates a disorder-to-order phase transition during reorganization of the molecules. For the 50PTX formulated particles (Figure 6c) there were no measurable transition peaks with the exception of 50PTX:50DPPC/DPPE-PEG5k, which exhibited small peaks at 49.2°C and 65.54°C with corresponding enthalpies of 3.045 and 0.938 J/g. These correspond to the DPPC and DPPE-PEG bilayer phase transitions, respectively. In Figure 6d, the 75PTX samples indicate no measurable transition peaks in the phospholipid region (40°C to 70°C) but did exhibit a large exothermic peak around 212°C which corresponds to the degradation of the sample (also seen in panel e for raw PTX. The size of these peaks, and corresponding enthalpies, decrease with increasing PEG content at 88.4 J/g, 71.4 J/g, 59.0 J/g, and 15.9 J/g for DPPC, PEG2k, PEG3k, and PEG5k samples, respectively. Furthermore, the 75PTX formulations exhibited a glass transition temperature (Tg) near 146°C, which is a second-order phase transition for the amorphous glass-to-rubbery state as seen in Figure 6f. Raw PTX exhibited a small endothermic peak around 204°C which corresponds to the melting temperature (Tm) of paclitaxel, which is a first-order phase transition whereas no measurable melting peaks were seen prior to degradation for SD samples. Both the Tg and Tm values were similar to those demonstrated by the spray dried and raw paclitaxel formulations as seen in Figure 6e and compares to what has previously been shown for raw paclitaxel (Lee et al., 2001; Liggins et al., 1997). Overall, the limited presence of transition peaks from 40 to 70°C for both 50PTX and 75PTX particles indicate limited multilamellar formation of the phospholipids within the particle matrix.
Figure 6.

DSC thermograms of spray-dried (SD) and co-spray-dried (co-SD) particles with varying PTX content and PEG chain lengths for: (a) co-SD 5PTX:95 DPPC vs. co-SD 5PTX:95 DPPC/DPPE-PEG; (b) co-SD 25 PTX:75 DPPC vs. co-SD 25 PTX:75 DPPC/DPPE-PEG; (c) co-SD 50PTX:50 DPPC vs. co-SD 50 PTX:50 DPPC/DPPE-PEG; (d) co-SD 75PTX:25 DPPC vs. co-SD 75PTX:25DPPC/DPPE-PEG; (e) SD 100PTX from three pump rates vs. raw PTX; and (f) insert of co-SD 75PTX:25 DPPC vs. co-SD 75PTX:25DPPC/DPPE-PEG for Tg transition visualization.
3.1.4 X-ray Powder Diffraction (XRPD)
X-ray powder diffractograms (Figure 7) showed a strong peak at 21° 2Θ for all SD 5PTX and SD 25PTX formulated particles which corresponds to the presence of the solid-state phospholipid bilayer structure (Alves and Santana, 2004) indicating that the bilayer structure is preserved in the solid-state following organic solution advanced spray drying in closed-mode. These samples also exhibited strong peaks at 19 and 23° 2Θ which designate the metastable phase of PEG as seen in previous results for PEG powders (Kang et al., 2007). The intensity of the 19 and 23° 2Θ peaks increased with increasing PEG chain length for the SD 5PTX and SD 25PTX systems. The intensities of the 19 and 23° 2Θ peaks for the co-SD systems are lower overall in comparison to that seen for raw DPPC or DPPE-PEG(Meenach et al., 2013). For the SD 50PTX and SD 75PTX formulated particles, no strong peaks were present (i.e. no long-range molecular order), indicating that PTX is non-crystalline (confirmed by DSC thermal analysis to be amorphous) within the particle matrix, likely with bilayer self-assembly multilamellar structures (i.e. multiple stacked bilayers)(Mansour and Zografi, 2007a) within the particles. The lack of characteristic peaks likely indicates that there is no detectable phospholipid bilayer structure for these powder systems within the detection limit of XRPD. The intensities of the peak corresponding to 21°C 2Θ decreased with increasing paclitaxel content. Raw paclitaxel showed peaks throughout its diffractograms indicating its crystallinity prior to spray drying.
Figure 7.

X-ray powder diffractograms of spray-dried (SD) and co-spray-dried (co-SD) particles with varying PTX content and PEG chain lengths for: (a) co-SD 5PTX:95 DPPC vs. co-SD 5PTX:95 DPPC/DPPE-PEG; (b) co-SD 25 PTX:75 DPPC vs. co-SD 25 PTX:75 DPPC/DPPE-PEG; (c) co-SD 50PTX:50 DPPC vs. co-SD 50 PTX:50 DPPC/DPPE-PEG; (d) co-SD 75PTX:25 DPPC vs. co-SD 75PTX:25DPPC/DPPE-PEG; and (e) SD 100PTX at three pump rates vs. raw PTX.
3.1.5 Attenuated Total Reflectance Fourier Transform Infrared Spectroscopy (ATR-FTIR)
Formulated particles and their raw counterparts underwent ATR-FTIR analysis to determine the functional groups present in the systems (Figure 8). For both the raw DPPC and raw DPPE-PEG powders, the spectra indicated the same characteristic peaks as previously reported in literature for DPPC and PEG, respectively (Lee et al., 2001; Meenach et al., 2013). The formulated co-SD PTX:DPPC/DPPE-PEG3k particles exhibited sharp peaks at 2916 cm−1 (-CH2- antisymmetrical stretching), 2870 cm−1 (-CH2- symmetrical stretching), 1724 cm−1 (C=O ester stretching), 1465 cm−1 (-CH2- deformation), 1060 cm−1 (-C-C-), and 965 cm−1 ((-N+(CH3)3 antisymmetrical stretching) which all increased with increasing paclitaxel content. These peaks were present in both raw DPPC and DPPE-PEG3k but not raw or formulated paclitaxel. For the peak at 1724 cm−1, it was split for the raw PTX but not for the spray dried particles. Overall, ATR-FTIR analysis of the solid-state particles confirmed the presence of DPPC and DPPE-PEG where appropriate through the signature peaks of each component and the difference between SD paclitaxel and raw paclitaxel was confirmed by differing spectra between the two systems.
Figure 8.

Representative ATR-FTIR spectra of co-spray-dried (co-SD) PTX:DPPC/DPPE-PEG3k particles in comparison to raw DPPC and raw paclitaxel.
3.1.6 Cross-Polarizing Light Hot-Stage Microscopy (HSM)
Representative micrographs of co-SD 5PTX:95DPPC/DPPE-PEG3k and co-SD 50PTX:50DPPC/DPPE-PEG3k are shown in Figure 9. The co-SD 5PTX:95DPPC/DPPE-PEG3k formulated particles showed dark agglomerates that lack birefringency between 25°C and 60°C, which indicated a non-ordered, amorphous material. An endothermic phase transition was visualized near 65°C, which likely corresponds to the gel-to-liquid crystalline bilayer main phase transition, as shown in the DSC thermogram at 65°C in Figure 6a. Melting was visualized starting at 120°C with the formation of liquid droplets with decomposition occurring at 250°C. The micrographs for co-SD 50PTX:50DPPC/DPPE-PEG3k showed large agglomerates lacking birefringency between 25°C and 80°C and a visible phase transition began starting around 90°C as shown by deformation of the particles. Melting started around 150°C and was complete by 155°C and decomposition occurred by 225°C. Pure SD paclitaxel (100PTX) showed dark agglomerates that lack birefringency between 25°C and 170°C. The particles began melting around 180°C as seen in Figure 10a. Raw paclitaxel had dark agglomerates lacking birefringency from 25°C to 180°C. Once the paclitaxel began melting at 190°C, it exhibited birefringency until decomposition around 240°C. Overall, HSM confirmed the amorphous nature of the formulated co-SD PTX:DPPC/DPPE-PEG systems as well as for SD 100PTX particles as no birefringency was observed. It also demonstrated the stability of the particles at room and physiological temperatures.
Figure 9.

Representative HSM micrographs of co-spray dried (co-SD) for: (a) co-SD 5PTX:95DPPC/DPPE-PEG3k; and (b) co-SD 50PTX:50DPPC/DPPE-PEG3k particles (scale bar = 3 mm).
Figure 10.

Representative HSM micrographs of spray-dried (SD): (a) SD 100PTX (High P) particles; and (b) raw paclitaxel. (Scale bar = 3 mm).
3.1.7 Paclitaxel Loading
Paclitaxel loading into the PEGylated phospholipid dry powder particles was determined by dissolving them in methanol and measuring the concentration of drug via UV-Vis spectroscopy. As shown in Table I, the PTX encapsulation efficiencies for 5PTX systems was the highest (ranging from 94.7% to 99.0%) and decreased with increasing PTX content. As expected, the paclitaxel loading increased with increasing PTX content where the SD 5PTX, 25PTX, 50PTX and 75PTX systems exhibited values in the range of 41.3 – 60.2 µg/mg, 191.4 – 242.6 µg/mg, 316.8 – 511.0 µg/mg, and 571.2 – 679.9 µg/mg, respectively. Furthermore, the encapsulation values for the 25 – 75% PTX-loaded particles is high enough for the dose necessary for animal treatment. In particular, systems containing 100 – 500 µg/mg PTX contain enough paclitaxel to result in a dose to rats ranging from 2 – 4 mg/kg at 2 – 5 mg particles/rat, which has been demonstrated as an effective dose range in the treatment of an orthotopic lung cancer model (Gill et al., 2011; Yang et al., 2007).
3.1.8 In Vitro Aerosol Dispersion Performance via Next Generation Impactor™
The aerosol dispersion properties of the co-SD particles and pure PTX SD particles were evaluated using the Next Generation Impactor™ (NGI™) coupled with a Handihaler® (Boehringer Ingelheim, USA) DPI device. As seen in Table II, the MMAD values for co-SD systems (regardless of PTX loading) increased with increasing PEG chain length and decreased with increasing PTX loading. The corresponding GSD also increased with increasing PEG chain length. Furthermore, for 100PTX particles, the MMAD values were approximately the same (ranging from 3.2 µm to 3.4 µm) whereas the GSD values were 2.3 µm to 2.6 µm. In general, fine particle fractions (FPF) and respirable fractions (RF) decreased with increasing PEG content, while the emitted dose (ED) increased (Table II). There was no discernible difference for FPF, RF, and ED with respect to the PTX loading.
Table II.
Next Generation Impactor™ results for co-spray dried (co-SD) and one-component spray dried (SD) aerosol systems including mass median aerodynamic diameter (MMAD), geometric standard deviation (GSD), fine particle fraction (FPF) below 4.46 µm, respirable fraction (RF) below 4.46 µm, and emitted dose (ED). (n = 3, Ave ± SD)
| System | MMAD (µm) |
GSD (µm) |
Fine Particle Fraction (%) |
Respirable Fraction (%) |
Emitted Dose (%) |
|---|---|---|---|---|---|
| 5PTX:95DPPC | 3.4 | 2.4 | 77.9 ± 7.0 | 50.3 ± 0.5 | 80.0 ± 4.0 |
| 5PTX:95DPPC/DPPE-PEG2k | 4.7 | 2.4 | 60.1 ± 8.0 | 49.2 ± 2.6 | 89.8 ± 1.7 |
| 5PTX:95DPPC/DPPE-PEG3k | 4.9 | 2.9 | 64.1 ± 6.8 | 47.5 ± 6.7 | 90.8 ± 0.1 |
| 5PTX:95DPPC/DPPE-PEG5k | 7.5 | 3.8 | 43.3 ± 2.2 | 44.0 ± 0.5 | 94.5 ± 1.0 |
| 25PTX:75DPPC | 3.3 | 2.3 | 75.4 ± 4.0 | 52.4 ± 2.1 | 88.6 ± 6.1 |
| 25PTX:75DPPC/DPPE-PEG2k | 4.0 | 2.6 | 64.5 ± 2.0 | 51.7 ± 4.5 | 95.2 ± 2.5 |
| 25PTX:75DPPC/DPPE-PEG3k | 4.5 | 2.4 | 58.1 ± 8.0 | 49.1 ± 6.4 | 91.1 ± 3.4 |
| 25PTX:75DPPC/DPPE-PEG5k | 6.8 | 3.1 | 55.4 ± 1.0 | 48.8 ± 7.1 | 92.2 ± 6.1 |
| 50PTX:50DPPC | 3.1 | 2.5 | 65.8 ± 2.4 | 53.4 ± 1.3 | 90.1 ± 4.1 |
| 50PTX:50DPPC/DPPE-PEG2k | 3.8 | 2.4 | 67.5 ± 2.7 | 54.4 ± 6.2 | 91.1 ± 4.1 |
| 50PTX:50DPPC/DPPE-PEG3k | 4.2 | 2.8 | 62.7 ± 3.6 | 51.9 ± 2.5 | 94.5 ± 5.2 |
| 50PTX:50DPPC/DPPE-PEG5k | 5.3 | 3.1 | 62.8 ± 7.2 | 49.9 ± 4.2 | 97.9 ± 3.2 |
| 75PTX:25DPPC | 2.7 | 2.0 | 73.2 ± 6.3 | 52.5 ± 6.1 | 89.8 ± 3.3 |
| 75PTX:25DPPC/DPPE-PEG2k | 3.9 | 2.3 | 72.3 ± 4.7 | 53.1 ± 1.1 | 91.5 ± 3.9 |
| 75PTX:25DPPC/DPPE-PEG3k | 4.0 | 2.8 | 69.9 ± 2.9 | 54.5 ± 2.2 | 96.7 ± 7.1 |
| 75PTX:25DPPC/DPPE-PEG5k | 4.8 | 3.4 | 63.2 ± 4.4 | 54.1 ± 2.0 | 94.3 ± 5.2 |
| 100PTX (Low) | 3.2 | 2.3 | 70.6 ± 2.1 | 59.9 ± 0.8 | 90.2 ± 4.7 |
| 100PTX (Med) | 3.3 | 2.5 | 64.6 ± 1.3 | 66.6 ± 3.1 | 85.1 ± 9.0 |
| 100PTX (High) | 3.4 | 2.6 | 68.3 ± 1.1 | 65.7 ± 0.2 | 89.3 ± 3.2 |
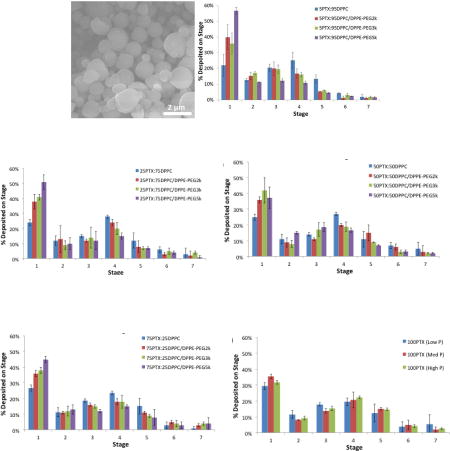
Figure 11 shows the aerosol dispersion performance of the dry powders as the % deposition on each NGI™ stage for both the co-SD and pure PTX systems. Aerosol deposition on each NGI™ stage is measurable and in particular, deposition on the lower stages of stage 2 all the way to stage 7 (the lowest stage) is observed. In general, the % deposition on stage 1 increased with increasing PEG chain length. The exception to this was seen for the SD 50PTX dry powder aerosols where no difference was seen due to PEG chain length. This trend was opposite for stage 4 where the amount of powder deposited on this stage decreased with increasing PEG content for co-SD particles. For 100PTX SD dry powder aerosol, there was no difference between the amounts of powder deposited on each stage. In the context of paclitaxel loading, the amount of powder deposited on each stage decreased slightly with increasing PTX content. Since there was significant particle deposition on Stages 5 – 7 (where the dae values for these particular particles would be less than significantly less than 1 µm), the particles on these stages would be predicted to deposit in the deep lung alveolar region due to diffusion (i.e. Brownian motion) mechanism of deposition (Suarez and Hickey, 2000). For the particles deposited on Stages 1–4, they would be predicted to deposit predominantly in the middle-to-deep lung regions by sedimentation due to gravitational settling (Carvalho et al., 2011; Edwards, 1995; Hickey and Mansour, 2008; Hickey and Mansour, 2009; Suarez and Hickey, 2000). Overall, the dry powder inhalation aerosols exhibited dispersion characteristics that will allow them to deposit in nearly all regions of the lung allowing for treatment throughout the entirety of the tissue.
Figure 11.

Aerosol dispersion performance as % deposited on each stage of the Next Generation Impactor™ (NGI™) for spray-dried (SD) and co-spray-dried (co-SD) particles with varying PTX content and PEG chain lengths for: a) co-SD 5PTX:95 DPPC vs. co-SD 5PTX:95 DPPC/DPPE-PEG; b) co-SD 25 PTX:75 DPPC vs. co-SD 25 PTX:75 DPPC/DPPE-PEG; c) co-SD 50PTX:50 DPPC vs. co-SD 50 PTX:50 DPPC/DPPE-PEG; d) co-SD 75PTX:25 DPPC vs. co-SD 75PTX:25DPPC/DPPE-PEG; and e) SD 100PTX particles spray-dried at three pump rates (Low P, Med P, and High P). For Q= 60 L/minute, the effective cutoff diameters for each NGI™ impaction stage are as follows: Stage 1 (8.06 µm); Stage 2 (4.46 µm); Stage 3 (2.82 µm); Stage 4 (1.66 µm); Stage 5 (0.94 µm); Stage 6 (0.55 µm); and Stage 7 (0.34 µm). (n = 3, Ave ± SD)
Furthermore, the high ED values of co-SD particles remained approximately the same compared to systems without PTX (Meenach et al., 2013). The RF values for the co-SD systems are lower than their corresponding drug-free PEGylated lipopolymeric DPI systems reported by our group (i.e. 45–50% compared to 60–70%) (Meenach et al., 2013). While the RF values of the co-SD powders were lower than their respective values at a given PEG chain length for the PTX-free powders, their respective FPF values increased significantly (43–79% compared to 20–30%)(Meenach et al., 2013). The FPF values for all of our DPI systems are much higher than "conventional DPIs" currently on the market which provide an FPF in the range of 10–20% (Suarez and Hickey, 2000).
4.1 CONCLUSIONS
This systematic and comprehensive study demonstrated for the first time that organic solution advanced spray drying and co-spray drying in closed-mode of a dilute concentration feed solution can be successfully employed to formulate high performing DPI aerosols consisting of co-spray dried paclitaxel (a first-line chemotherapeutic lung cancer drug) into a biocompatible and biodegradable lipopolymeric system (DPPE-PEG) with varying PEG chain length and containing the essential lung surfactant phospholipid, DPPC. The physicochemical characterization and excellent aerosol dispersion performance of these particles indicates that they would be suitable to deliver PTX to the middle and deep regions of the lungs in a targeted fashion. For multilamellar particles, a lower paclitaxel loading will likely be optimal along with a medium PEGylation (using DPPE-PEG3k). The incorporation of DPPE-PEG lipopolymer of varying PEG chain length can potentially offer enhanced mucus penetration by phospholipid spreading and PEG penetration, controlled drug release, and “stealth” property of evasion of phagocytosis by immune cells.
Figure 2.

SEM micrographs of co-spray dried (co-SD) PEGylated phospholipid particles with varying PEG chain length containing 25% paclitaxel (PTX): (a) co-SD 25PTX:75DPPC; (b) co-SD 25PTX:75DPPC/DPPE-PEG2k; (c) co-SD 25PTX:75DPPC/DPPE-PEG3k; and (d) co-SD 25PTX:75DPPC/DPPE-PEG5k. Magnification for all samples was 10,000×.
Acknowledgments
The authors gratefully acknowledge financial support from the National Cancer Institute (NCI) Grant Number R25CA153954 and a National Cancer Institute Cancer Nanotechnology Training Center (NCI-CNTC) Postdoctoral Traineeship awarded to SAM. The content is solely the responsibility of the authors and does not necessarily represent the official views of the National Cancer Institute or the National Institutes of Health. The authors thank Dr. Tonglei Li for XRPD and HSM access and Dr. J. Zach Hilt for ATR-FTIR access.
Footnotes
Publisher's Disclaimer: This is a PDF file of an unedited manuscript that has been accepted for publication. As a service to our customers we are providing this early version of the manuscript. The manuscript will undergo copyediting, typesetting, and review of the resulting proof before it is published in its final citable form. Please note that during the production process errors may be discovered which could affect the content, and all legal disclaimers that apply to the journal pertain.
AUTHOR DISCLOSURE STATEMENT
No conflicts of interest exist.
References
- <601>Aerosols, Nasal Sprays, Metered-Dose Inhalers, and Dry Powder Inhalers Monograph, USP 29-NF 24 The United States Pharmacopoeia and The National Formulary: The Official Compendia of Standards. The United States Pharmacopeial Convention, Inc.; Rockville, MD: 2006. pp. 2617–2636. [Google Scholar]
- Alves GP, Santana MHA. Phospholipid dry powders produced by spray drying processing: structural, thermodynamic and physical properties. Powder Technology. 2004;145:139–148. [Google Scholar]
- Arnold MM, Gonnan EM, Schieber LJ, Munson EJ, Berkland C. NanoCipro encapsulation in monodisperse large porous PLGA microparticles. Journal of Controlled Release. 2007;121:100–109. doi: 10.1016/j.jconrel.2007.05.039. [DOI] [PMC free article] [PubMed] [Google Scholar]
- Bosquillon C, Lombry C, Preat V, Vanbever R. Influence of formulation excipients and physical characterisitcs of inhalation dry powders on their aerosolization performance. Journal of Controlled Release. 2001;70:329–339. doi: 10.1016/s0168-3659(00)00362-x. [DOI] [PubMed] [Google Scholar]
- Cartiera MS, Ferreira EC, Caputo C, Egan ME, Caplan MJ, Saltzman WM. Partial Correction of Cystic Fibrosis Defects with PLGA Nanoparticles Encapsulating Curcumin. Molecular pharmaceutics. 2010;7:86–93. doi: 10.1021/mp900138a. [DOI] [PMC free article] [PubMed] [Google Scholar]
- Carvalho TC, Carbalho SR, McConville JT. Formulations for pulmonary administration of anticancer agents to treat lung malignancies. Journal of Aerosol Medicine and Pulmonary Drug Delivery. 2011;24:61–80. doi: 10.1089/jamp.2009.0794. [DOI] [PubMed] [Google Scholar]
- Chow AHL, Tong HHY, Chattopadhyay P, Shekunov BY. Particle engineering for pulmonary drug delivery. Pharmaceutical Research. 2007;24:411–437. doi: 10.1007/s11095-006-9174-3. [DOI] [PubMed] [Google Scholar]
- Coates AL, O'Callaghan C. Drug administration by aerosol in children. Saunders-Elsevier; Philadelphia, PA: 2006. [Google Scholar]
- Dunbar CA, Hickey AJ, Holzner P. Dispersion and Characterization of Pharmaceutical Dry Powder Aerosols. KONA Powder and Particle Journal. 1998;16:7–45. [Google Scholar]
- Edwards DA. The macrotransport of aerosol particles in the lung: Aerosol deposition phenomena. Journal of Aerosol Science. 1995;26:293–317. [Google Scholar]
- Edwards DA, Ben-Jebria A, Langer R. Recent advances in pulmonary drug delivery using large, porous inhaled particles. Journal of Applied Physiology. 1998;85:379–385. doi: 10.1152/jappl.1998.85.2.379. [DOI] [PubMed] [Google Scholar]
- Eldar-Boock A, Miller K, Sanchis J, Lupu R, Vicent MJ, Satchi-Fainaro R. Integrin-assisted drug delivery of nano-scaled polymer therapeutics bearing paclitaxel. Biomaterials. 2011;32:3862–3874. doi: 10.1016/j.biomaterials.2011.01.073. [DOI] [PMC free article] [PubMed] [Google Scholar]
- Finlay W. The ARLA Respiratory Deposition Calculator 2008 [Google Scholar]
- Gagnadoux F, Hureaux J, Vecellio L, Urban T, Le Pape A, Valo I, Montharu J, Leblond V, Boisdron-Celle M, Lerondel S, Majoral C, Diot P, Racineux JL, Lemarie E. Aerosolized chemotherapy. Journal of Aerosol Medicine and Pulmonary Drug Delivery. 2008;21:61–69. doi: 10.1089/jamp.2007.0656. [DOI] [PubMed] [Google Scholar]
- Ganguly S, Moolchandani V, Roche JA, Shapiro PS, Somaraju S, Eddington ND, Dalby RN. Phospholipid-induced in vivo particle migration to enhance pulmonary deposition. Journal of Aerosol Medicine Pulmonary Drug Delivery. 2008;23:181–187. doi: 10.1089/jamp.2007.0675. [DOI] [PubMed] [Google Scholar]
- Gill KK, Nazzal S, Kaddoumi A. Paclitaxel-loaded PEG5000-DSPE micelles as pulmonary delivery platform: Formulation characterizaton, tissue distribution, plasma pharmacokinetics and toxicological evaluation. European Journal of Pharmaceutics and Biopharmaceutics. 2011;79:276–284. doi: 10.1016/j.ejpb.2011.04.017. [DOI] [PubMed] [Google Scholar]
- Gill S, Lobenberg R, Ku T, Azarmi S, Roa WH, Prenner EJ. Nanoparticles: characteristics, mechanisms of action, and toxicity in pulmonary drug delivery - a review. Journal of Biomedical Nanotechnology. 2007;3:107–119. [Google Scholar]
- Hickey AJ, Mansour HM. In: Formulation Challenges of Powders for the Delivery of Small Molecular Weight Molecules as Aerosoles. Rathbone MJ, Roberts MS, Lane ME, editors. Modified-Release Drug Delivery Technology Informa Healthcare; New York: 2008. pp. 573–602. [Google Scholar]
- Hickey AJ, Mansour HM. Delivery of drugs by the pulmonary route. In: Florence AT, Siepmann J, editors. Modern Pharmaceutics. 5. Taylor and Francis; New York: 2009. pp. 191–219. [Google Scholar]
- Hickey AJ, Mansour HM, Martin JT, Xu Z, Smyth HDC, Mulder T, McLean R, Langridge J, Papadopoulos D. Physical Characterization of Component Particles Included in Dry Powder Inhalers. I. Strategy Review and Static Characteristics. Journal of Pharmaceutical Sciences. 2007;96:1282–1301. doi: 10.1002/jps.20916. [DOI] [PubMed] [Google Scholar]
- Ishihara K, Nomura H, Mihara T, Kurita K, Iwasaki Y, Nakabayashi N. Why do phospholipid polymers reduce protein adsorption? Journal of Biomedical Materials Research. 1998;39:323–330. doi: 10.1002/(sici)1097-4636(199802)39:2<323::aid-jbm21>3.0.co;2-c. [DOI] [PubMed] [Google Scholar]
- Kang E, Robinson J, Park K, Cheng J-X. Paclitaxel distribution in poly(ethylene glycol)/poly(lactide-co-glycolic acid) blends and its release visualized by coherent anti-Stokes Raman scattering microscopy. Journal of Controlled Release. 2007;122:261–268. doi: 10.1016/j.jconrel.2007.05.007. [DOI] [PMC free article] [PubMed] [Google Scholar]
- Kikuchi H, Yamauchi H, Hirota S. A spray-drying method for mass production of liposomes. Chemical & Pharmaceutical Bulletin. 1991;36:1522–1527. [Google Scholar]
- Labiris NR, Dolovich MB. Pulmonary drug delivery. Part I: Physiological factors affecting therapeutic effectiveness of aerosolized medications. Journal of Clinical Pharmacology. 2003a;56:588–599. doi: 10.1046/j.1365-2125.2003.01892.x. [DOI] [PMC free article] [PubMed] [Google Scholar]
- Labiris NR, Dolovich MB. Pulmonary drug delivery. Part II: The role of inhalant delivery devices and drug formulation in therapeutic effectiveness of aerosolized medications. British Journal of Clinical Pharmacology. 2003b;56:600–612. doi: 10.1046/j.1365-2125.2003.01893.x. [DOI] [PMC free article] [PubMed] [Google Scholar]
- Lai SK, Wang Y-Y, Hanes J. Mucus-penetrating nanoparticles for drug and gene delivery to mucosal tissues. Advanced Drug Delivery Reviews. 2009a;61:158–171. doi: 10.1016/j.addr.2008.11.002. [DOI] [PMC free article] [PubMed] [Google Scholar]
- Lai SK, Wang Y-Y, Wirtz D, Hanes J. Micro- and macrorheology of mucus. Advanced Drug Delivery Reviews. 2009b;61:86–100. doi: 10.1016/j.addr.2008.09.012. [DOI] [PMC free article] [PubMed] [Google Scholar]
- Lee JH, Gi U-S, Kim J-H, Kim Y, Kim S-H, Oh H, Min B. Preparation and Characterization of Solvent Induced Dihydrated, Anhydrous, and Amorphous Paclitaxel. Bulletin of the Korean Chemical Society. 2001;22:925–928. [Google Scholar]
- Li X, Hayes D, Mansour HM. Targeted lung delivery by inhalable multifunctional microparticulate/nanoparticulate aerosols for cystic fibrosis combination drug/mucolytic treatment. Pediatric Pulmonology. 2011:346–346. [Google Scholar]
- Li XJ, Mansour HM. Physicochemical Characterization and Water Vapor Sorption of Organic Solution Advanced Spray-Dried Inhalable Trehalose Microparticles and Nanoparticles for Targeted Dry Powder Pulmonary Inhalation Delivery. Aaps Pharmscitech. 2011;12:1420–1430. doi: 10.1208/s12249-011-9704-0. [DOI] [PMC free article] [PubMed] [Google Scholar]
- Liggins RT, Hunter WL, Burt HM. Solid-State Characterization of Paclitaxel. Journal of Pharmaceutical Sciences. 1997;86:1459–1463. doi: 10.1021/js9605226. [DOI] [PubMed] [Google Scholar]
- Mansour H, Wang DS, Chen CS, Zografi G. Comparison of bilayer and monolayer properties of phospholipid systems containing dipalmitoylphosphatidylglycerol and dipalmitoylphosphatidylinositol. Langmuir. 2001;17:6622–6632. [Google Scholar]
- Mansour HM, Rhee Y-S, Wu X. Nanomedicine in pulmonary delivery. International Journal of Nanomedicine. 2009;4:299–319. doi: 10.2147/ijn.s4937. [DOI] [PMC free article] [PubMed] [Google Scholar]
- Mansour HM, Rhee YS, Park CW, DeLuca PP. Lipid Nanoparticulate Drug Delivery and Nanomedicine. In: Moghis A, editor. Lipids in Nanotechnology. American Oil Chemists Society (AOCS) Press; Urbana, Illinois: 2011. pp. 221–268. [Google Scholar]
- Mansour HM, Sohn M, Al-Ghananeem A, DeLuca PP. Materials for Pharmaceutical Dosage Forms: Molecular Pharmaceutics and Controlled Release Drug Delivery Aspects. International Journal of Molecular Sciences. 2010;11:3298–3322. doi: 10.3390/ijms11093298. [DOI] [PMC free article] [PubMed] [Google Scholar]
- Mansour HM, Zografi G. The relationship between water vapor absorption and desorption by phospholipids and bilayer phase transitions. Journal of Pharmaceutical Sciences. 2007a;96:377–396. doi: 10.1002/jps.20810. [DOI] [PubMed] [Google Scholar]
- Mansour HM, Zografi G. Relationships between equilibrium spreading pressure and phase equilibria of phospholipid bilayers and monolayers at the air-water interface. Langmuir. 2007b;23:3809–3819. doi: 10.1021/la063053o. [DOI] [PubMed] [Google Scholar]
- Marupudi NI, Han JE, Li KW, Renard VM, Tyler BM, Brem H. Paclitaxel: a review of adverse toxicities and novel delivery strategies. Expert Opinion on Drug Safety. 2007;6:609–621. doi: 10.1517/14740338.6.5.609. [DOI] [PubMed] [Google Scholar]
- Meenach SA, Kim YJ, Kauffman KJ, Kanthamneni N, Bachelder EM, Ainslie KM. Synthesis, Optimization, and Characterization of Camptothecin-Loaded Acetalated Dextran Porous Microparticles for Pulmonary Delivery. Molecular pharmaceutics. 2012;9:290–298. doi: 10.1021/mp2003785. [DOI] [PubMed] [Google Scholar]
- Meenach SA, Vogt FG, Anderson KW, Hilt JZ, McGarry RC, Mansour HM. Design, physicochemical characterization, and optimization of organic solution advanced spray-dried inhalable dipalmitoylphosphatidylcholine (DPPC) and dipalmitoylphosphatidylethanolamine poly(ethylene glycol) (DPPE-PEG) microparticles and nanoparticles for targeted respiratory nanomedicine delivery as dry powder inhalation aerosols. International Journal of Nanomedicine. 2013;8:275–293. doi: 10.2147/IJN.S30724. [DOI] [PMC free article] [PubMed] [Google Scholar]
- Pappalardo M, Milardi D, Grasso D, La Rosa C. Phase behaviour of polymer-grafted DPPC membranes for drug delivery systems design. Journal of Thermal Analysis and Calorimetry. 2005;80:413–418. [Google Scholar]
- Patton JS, Byron PR. Inhaling medicines: delivering drugs to the body through the lungs. Nature Reviews Drug Discovery. 2007;6:67–74. doi: 10.1038/nrd2153. [DOI] [PubMed] [Google Scholar]
- Rhee YS, Mansour HM. Nanopharmaceuticals I: nanocarrier systems in drug delivery. International Journal of Nanotechnology. 2011;8:84–114. [Google Scholar]
- Sharma S, White D, Imondi A, Placke ME, Vail DM, Kris MG. Development of inhalation agents for oncologic use. Journal of Clinical Oncology. 2001;19:1839–1847. doi: 10.1200/JCO.2001.19.6.1839. [DOI] [PubMed] [Google Scholar]
- Suarez S, Hickey AJ. Drug properties affecting aerosol behavior. Respiratory Care. 2000;45:652–666. [PubMed] [Google Scholar]
- Sung JC, Pulliam BL, Edwards DA. Nanoparticles for drug delivery to the lungs. Trends in Biotechnology. 2007;25:563–570. doi: 10.1016/j.tibtech.2007.09.005. [DOI] [PubMed] [Google Scholar]
- Tang BC, Fu J, Watkins DN, Hanes J. Enhanced efficacy of local etoposide delivery by poly(ether-anhydride) particles against small cell lung cancer in vivo. Biomaterials. 2010;31:339–344. doi: 10.1016/j.biomaterials.2009.09.033. [DOI] [PMC free article] [PubMed] [Google Scholar]
- Tomoda K, Ohkoshi T, Hirota K, Sonavane GS, Nakajima T, Terada H, Komuro M, Kitazato K, Makino K. Preparation and properties of inhalable nanocomposite particles for treatment of lung cancer. Colloids and Surfaces B: Biointerfaces. 2009;71:177–182. doi: 10.1016/j.colsurfb.2009.02.001. [DOI] [PubMed] [Google Scholar]
- Tong HHY, Chow AHL. Control of Physical Forms of Drug Particles for Pulmonary Delivery by Spray Drying and Supercritical Fluid Processing. KONA Powder and Particle Journal. 2006;24:27–40. [Google Scholar]
- Törmälä P. Determination of glass transition temperature of poly(ethylene glycol) by spin probe technique. European Polymer Journal. 1974;10:519–521. [Google Scholar]
- Vaughn JM, McConville JT, Burgess D, Peters JI, Johnston KP, Talbert RL, Williams RO. Sing dose and multiple dose studies of itraconazole nanoparticles. European Journal of Pharmaceutics and Biopharmaceutics. 2006;63:95–102. doi: 10.1016/j.ejpb.2006.01.006. [DOI] [PubMed] [Google Scholar]
- Vehring R, Foss WR, Lechuga-Ballesteros D. Particle formation in spray drying. Journal of Aerosol Science. 2007;38:728–746. [Google Scholar]
- Watts AB, McConville JT, Williams RO. Advancements in dry powder delivery to the lung. Drug Development and Industrial Pharmacy. 2008;34:948–959. doi: 10.1080/03639040802235902. [DOI] [PubMed] [Google Scholar]
- Wu X, Hayes DJ, Zwischenberger JB, Kuhn RJ, Mansour HM. Design and Physicochemical Characterization of Advanced Spray-Dried Tacrolimus Multifunctional Particles for Inhalation. Drug Design, Development, and Therapy. 2013a;7:59–72. doi: 10.2147/DDDT.S40166. [DOI] [PMC free article] [PubMed] [Google Scholar]
- Wu X, Zhang W, Hayes DJ, Mansour HM. Physicochemical Characterization and Aerosol Dispersion Performance of Organic Solution Advanced Spray-Dried Cyclosporine A Multifunctional Particles for Dry Powder Inhalation Aerosol Delivery. International Journal of Nanomedicine. 2013b;8:1269–1283. doi: 10.2147/IJN.S40904. [DOI] [PMC free article] [PubMed] [Google Scholar]
- Wu XA, Mansour HM. Nanopharmaceuticals II: application of nanoparticles and nanocarrier systems in pharmaceutics and nanomedicine. International Journal of Nanotechnology. 2011;8:115–145. [Google Scholar]
- Yang T, Choi M-K, Cui F-D, Kim JS, Suk-Jae C, Shim C-K, Kim D-D. Preparation and evaluation of paclitaxel-loaded PEGylated immunoliposome. Journal of Controlled Release. 2007;120:169–177. doi: 10.1016/j.jconrel.2007.05.011. [DOI] [PubMed] [Google Scholar]
- Yang Y, Bajaj N, Xu P, Ohn K, Tsifansky MD, Yeo Y. Development of highly porous large PLGA microparticles for pulmonary drug delivery. Biomaterials. 2009;30:1947–1953. doi: 10.1016/j.biomaterials.2008.12.044. [DOI] [PubMed] [Google Scholar]