Key Points
Question
How are 5 factors—population growth, population aging, disease prevalence or incidence, service utilization, and service price and intensity—associated with health care spending increases in the United States from 1996 to 2013?
Findings
Health care spending increased by $933.5 billion from 1996 to 2013. Service price and intensity alone accounted for more than 50% of the spending increase, although the association of the 5 factors with spending varied by type of care and health condition.
Meaning
Understanding the factors associated with health care spending increases, and their variability across conditions and types of care, can inform policy efforts to contain health care spending.
Abstract
Importance
Health care spending in the United States increased substantially from 1995 to 2015 and comprised 17.8% of the economy in 2015. Understanding the relationship between known factors and spending increases over time could inform policy efforts to contain future spending growth.
Objective
To quantify changes in spending associated with 5 fundamental factors related to health care spending in the United States: population size, population age structure, disease prevalence or incidence, service utilization, and service price and intensity.
Design and Setting
Data on the 5 factors from 1996 through 2013 were extracted for 155 health conditions, 36 age and sex groups, and 6 types of care from the Global Burden of Disease 2015 study and the Institute for Health Metrics and Evaluation’s US Disease Expenditure 2013 project. Decomposition analysis was performed to estimate the association between changes in these factors and changes in health care spending and to estimate the variability across health conditions and types of care.
Exposures
Change in population size, population aging, disease prevalence or incidence, service utilization, or service price and intensity.
Main Outcomes and Measures
Change in health care spending from 1996 through 2013.
Results
After adjustments for price inflation, annual health care spending on inpatient, ambulatory, retail pharmaceutical, nursing facility, emergency department, and dental care increased by $933.5 billion between 1996 and 2013, from $1.2 trillion to $2.1 trillion. Increases in US population size were associated with a 23.1% (uncertainty interval [UI], 23.1%-23.1%), or $269.5 (UI, $269.0-$270.0) billion, spending increase; aging of the population was associated with an 11.6% (UI, 11.4%-11.8%), or $135.7 (UI, $133.3-$137.7) billion, spending increase. Changes in disease prevalence or incidence were associated with spending reductions of 2.4% (UI, 0.9%-3.8%), or $28.2 (UI, $10.5-$44.4) billion, whereas changes in service utilization were not associated with a statistically significant change in spending. Changes in service price and intensity were associated with a 50.0% (UI, 45.0%-55.0%), or $583.5 (UI, $525.2-$641.4) billion, spending increase. The influence of these 5 factors varied by health condition and type of care. For example, the increase in annual diabetes spending between 1996 and 2013 was $64.4 (UI, $57.9-$70.6) billion; $44.4 (UI, $38.7-$49.6) billion of this increase was pharmaceutical spending.
Conclusions and Relevance
Increases in US health care spending from 1996 through 2013 were largely related to increases in health care service price and intensity but were also positively associated with population growth and aging and negatively associated with disease prevalence or incidence. Understanding these factors and their variability across health conditions and types of care may inform policy efforts to contain health care spending.
This study uses data from the 2013 US Disease Expenditure project and the 2015 Global Burden of Disease study to evaluate associations between population, disease, and service utilization and price variables and changes in health care spending between 1996 and 2013.
Introduction
Spending on health care in the United States is higher than in any other country and is increasing. According to official US records, total health spending in 2015 reached $3.2 trillion and constituted 17.8% of the US economy. Even after adjusting for inflation, the annualized growth rate in US health care spending between 1995 and 2015 was 4.0%. This growth is in excess of the rate of growth of the total US economy, which was 2.4% during this same period.
Although higher spending on health is not inherently bad, policy discussions in the United States often center around “bending the health care cost curve.” When devising policy to evaluate spending efficiency or to contain spending, it is important to know the specific areas in which spending is increasing, as well as the factors contributing to spending increases. Previous research has provided insight into areas of spending growth, but little is known about what specifically is contributing to this growth, especially for specific conditions or types of care. Various factors, including population aging, disease prevalence, cost of care, and technology, have been implicated as factors that can increase health spending. Yet there is little consensus in the existing literature about which of these factors are most responsible for increased health care spending and even less information about how the effect of these factors varies by health condition or type of care.
To evaluate the association of key factors with increases in health care spending for each health condition and type of care, this study combined the most detailed US health care spending database with similarly detailed disease prevalence and incidence data. This data set allowed for an analysis of the association of 5 fundamental factors with growth in health care spending: changes in population size, the aging of the population, and changes in disease prevalence or incidence, service utilization, and service price and intensity.
Methods
This study received review and approval from the University of Washington institutional review board; because data were deidentified, informed consent was waived.
Data Sources
This study relied on 2 main data sources: the US Disease Expenditure 2013 project and the Global Burden of Disease 2015 study.
Disease Expenditure 2013 Project
Estimates of personal health care spending and service volume were extracted from the US Disease Expenditure 2013 project. That study estimated US health care spending and service volume for each year from 1996 to 2013 and synthesized information on health care spending from 183 sources, leveraging the strength of each source to produce modeled estimates of spending and volume disaggregated by 155 health conditions, 38 age and sex groups, and 6 types of care: ambulatory, inpatient, emergency department, dental, retail pharmaceutical, and nursing facility care. Several adjustments, including adjustments for comorbidities and adjustments to account for the difference between charge and payment data, were applied to improve accuracy of the estimates. These adjusted data track spending associated with each disease rather than simply spending associated with the primary diagnosis appearing in the raw data. Spending estimates were also scaled to the official estimate of US health spending contained in the National Health Expenditure Accounts, which ensured that no spending was counted twice. All spending estimates from the project data set were adjusted for inflation and expressed in 2015 dollars. Spending on patients 85 years and older was combined with spending on patients aged 80 to 84 years to create 36 age and sex groups and to match the age and sex categories for our other data sources. More detailed information on the methods used in the Disease Expenditure project is reported in the eMethods in the Supplement and has been published.
Global Burden of Disease Study
Population and epidemiologic data, including prevalence and incidence for each health condition, were extracted from the Global Burden of Disease (GBD) 2015 study. The GBD study estimated prevalence, incidence, deaths, and other epidemiologic metrics by age and sex groups for 315 conditions, for years 1990, 1995, 2000, 2005, 2010, and 2015. To estimate disease incidence and prevalence for each age and sex group in the United States, 1604 data sources were used, including hospital data, claims data, and surveys. A Bayesian meta-regression tool developed specifically for the GBD, DisMod-MR, was used to generate the modeled estimates of prevalence and incidence. GBD health conditions were aggregated to reflect the health conditions used in the Disease Expenditure project, with more details provided in the eMethods in the Supplement. To interpolate disease incidence and prevalence for the years that GBD does not report, log-linear interpolation was used for each age and sex group. Interpolation introduced additional uncertainty that is not included in estimates, although for most conditions included in this study, prevalence and incidence rates remained relatively constant across the study, and substantive short-term variations in the disease prevalence or incidence associated with the most expensive health conditions is unlikely.
Age and Sex Standardization and Case Standardization
The relationship between changes in population size and age structure and spending growth were explored by comparing unadjusted spending growth rates with age- and sex-standardized growth rates. Age and sex standardization is commonly used to compare health outcomes that are dependent on the age structure of a population. To standardize 1996 spending to reflect the 2013 population profile, spending per person was calculated for each of the health conditions and for 36 age and sex groups in 1996, and those fractions were multiplied by the 2013 age- and sex-specific population estimates. The annualized rate of change was then calculated between adjusted 1996 values and the observed 2013 values. This procedure estimated changes in spending that would have occurred even if the 1996 and 2013 population size and age and sex structure were the same.
Case-standardized growth rates were also measured. Spending per prevalent case was calculated for each health condition and for 36 age and sex groups in 1996, and those fractions were multiplied by 2013 age- and sex-specific prevalent case estimates. Using these standardized 1996 estimates, annualized rates of change were estimated to report the change that would have occurred even if the number of prevalent cases in 1996 and 2013 was the same. For injuries and cancers, spending per incident case was calculated, because spending for these conditions is associated more with incidence than with prevalence.
Five-Factor Decomposition
For each of the 155 health conditions, 36 age and sex groups, 6 types of care, and 18 years of the study, 5 variables were constructed: (1) the total US population, (2) the fraction of the population living in each age and sex group, (3) the disease prevalence or incidence, (4) service utilization, and (5) service price and intensity. Disease prevalence was used for all health conditions except injuries and cancers, for which incidence was used. Service utilization and service price and intensity were measured differently for the different types of care (Table). For ambulatory, emergency department, and dental care, service utilization was measured as the mean visits per prevalent or incident case, while service price and intensity was the mean spending per visit. For inpatient and nursing facility care, service utilization was the mean bed-days per prevalent case, while service price and intensity was the mean spending per bed-day. For retail pharmaceuticals, service utilization was the mean number of purchased prescriptions per prevalent case, while service price and intensity was the mean spending per purchased prescription. Changes in service intensity included the use of new technology.
Table. Definition of Utilization and of Price and Intensity, by Type of Care.
| Care Type | Utilization | Price and Intensity |
|---|---|---|
| Ambulatory | Visits per prevalent casea | Spending per visit |
| Inpatient | Bed-days per prevalent casea | Spending per bed-day |
| Prescribed pharmaceuticals acquired in retail settings | Prescriptions filled per prevalent casea | Spending per prescription filled |
| Nursing facility | Bed-days per prevalent casea | Spending per bed-day |
| Emergency department | Visits per prevalent casea | Spending per visit |
| Dental | Visits per prevalent casea | Spending per visit |
Incident cases used for cancers and injuries because health care for these conditions is associated more with incidence than with prevalence.
The final data set included yearly estimates of all 5 factors for 1996 through 2013. Because the data from the Disease Expenditure project and interpolated GBD data are each complete without missing values, no additional data estimation or imputation were needed. Because not all health conditions exist for all age and sex groups and types of care, the 5 factors were measured for 21 713 unique combinations of condition, age and sex, and type of care, for each year. Five conditions (diphtheria, intestinal infectious diseases, measles, vitamin A deficiency, and tetanus) and several outlier cases were excluded because the related prevalence data were too low to allow for accurate estimation.
As defined in this study, health care spending is the product of these 5 fundamental factors, as shown in the equation
where a indicates age; s, sex; c, condition; t, type of care; and y, year. To measure the relative effect of each of the 5 factors, a demographic decomposition described by Das Gupta in 1993 was used. This decomposition relied on the identity above to calculate the additive contributions of each factor to changes in health spending from 1996-2013. The equation is completely additive and does not involve any residual terms.
Quantifying Uncertainty
To estimate uncertainty, 1000 draws of estimates were extracted from both the Disease Expenditure and GBD databases. Each draw represents 1 statistical estimate, and the variation of these draws captures uncertainty associated with these input data. The measurement of rates of change, standardized rates of change, and the decomposition analysis were all completed on each of the 1000 draws independently so that data uncertainty was propagated throughout the entire process, and the reported uncertainty intervals (UIs) reflect all sources of uncertainty in both the input data estimation and the deterministic decomposition calculation. The reported estimates are the mean and the 2.5th and 97.5th percentiles of the 1000 estimates. More details about implementation of the 5-factor decomposition, including code, are reported in the eMethods in the Supplement.
All statistical analyses were completed using Stata version 13.1 (StataCorp) and R versions 3.3.2 and 3.4.0 (R Foundation for Statistical Computing), as well as several user-written R packages.
Results
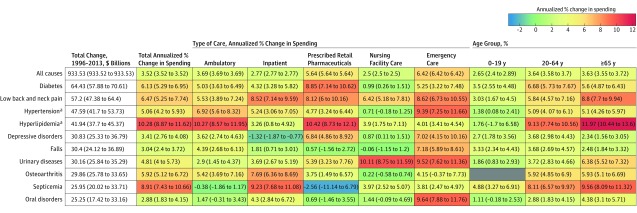
These analyses assessed 155 health conditions and tracked a $933.5 billion increase in annual US personal health care spending. Figure 1 shows health care spending increases and growth rates between 1996 and 2013. During this period, inflation-adjusted spending on inpatient, ambulatory, retail pharmaceutical, nursing facility, emergency department, and dental care increased at an annualized rate of 3.5%, from $1.2 trillion to $2.1 trillion. Across all health conditions, the greatest annualized growth rates were in emergency department care and retail pharmaceutical spending, at 6.4% and 5.6%, respectively. The condition with the greatest absolute increase in spending was diabetes, which increased at an annualized rate of 6.1% (UI, 5.3% to 7.0%), or $64.4 (UI, $57.9 to $70.6) billion. Most of this increase was related to increases in retail pharmaceutical spending. Low back and neck pain had the second-largest increase in health care spending, increasing at an annualized rate of 6.5% (UI, 5.3% to 7.7%), or $57.2 (UI, $47.4 to $64.4) billion between 1996 and 2013. In absolute terms, this increase was concentrated in ambulatory care and inpatient care. Spending increases on the treatment of hypertension ($47.6 [UI, $41.7 to $53.7] billion), the treatment of hyperlipidemia ($41.9 [UI, $37.7 to $45.4] billion), and depressive disorders ($30.8 [UI, $25.3 to $36.8] billion) were also notable.
Figure 1. Changes in Spending and Annualized Percent Changes for the 10 Health Conditions With the Largest Absolute Spending Increases, 1996-2013.
Spending amounts are reported and annualized percent changes in spending calculated using inflation-adjusted 2015 dollars. Values in parentheses indicate uncertainty intervals. Other neurologic disease actually had the fifth-largest increase in health care spending but was omitted from Figures 1 and 2 because it is a composite category made up of disparate neurologic diseases not included in the 6 other categories tracking spending on other neurologic diseases. Gray cell indicates values could not be calculated for that condition in that age group (no prevalence data).
aSpending on treatment of this risk factor, rather than spending on diseases this risk factor causes.
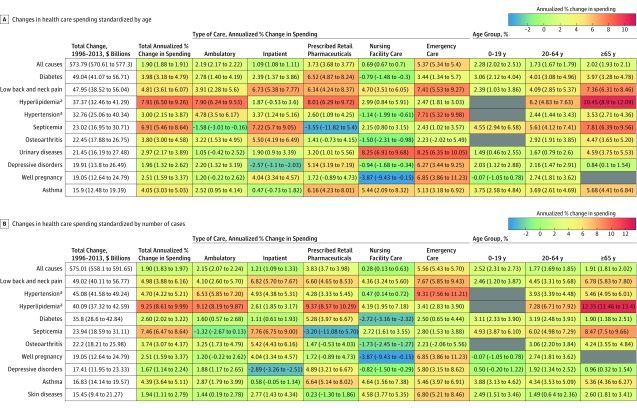
Figure 2 shows age- and sex-standardized health spending increases and growth rates (top panel). This panel shows spending factors not related to demographic changes. After controlling for population size and age structure, the increase in annual spending was $573.8 (UI, $570.6 to $577.3) billion. Even after adjusting for population size and age structure, diabetes and low back and neck pain remained the conditions with the largest increases in annual spending, although the increases and annualized growth rates decreased. Falls, the health condition with the seventh largest increase in annual spending, was no longer among the 10 health conditions with the highest growth after adjustment for age and sex.
Figure 2. Standardized Changes in Spending and Annualized Percent Changes for the 10 Health Conditions With the Largest Absolute Spending Increases, 1996-2013.
Spending amounts are reported and annualized percent changes in spending calculated using inflation-adjusted 2015 dollars. Values in parentheses indicate uncertainty intervals. Top, Spending changes that would have occurred in the presence of a constant population size and structure. Bottom, Spending changes that would have occurred if age-specific disease prevalence rates remained constant. These spending changes exist because of changes in service utilization, price, and intensity. Gray cells indicate values could not be calculated for a condition in that age group (no prevalence data).
aSpending on treatment of this risk factor, rather than spending on diseases this risk factor causes.
Figure 2 also shows case-standardized health spending increases and growth rates (bottom panel). Because differences in prevalence over time are controlled for, this panel reports growth associated with changes in health system service variables such as service utilization, price, and intensity. Diabetes went from showing the biggest change in spending to the fourth biggest change. After controlling for the number of prevalent cases, the health conditions with the largest growth in spending were low back and neck pain, treatment of hypertension, and treatment of hyperlipidemia.
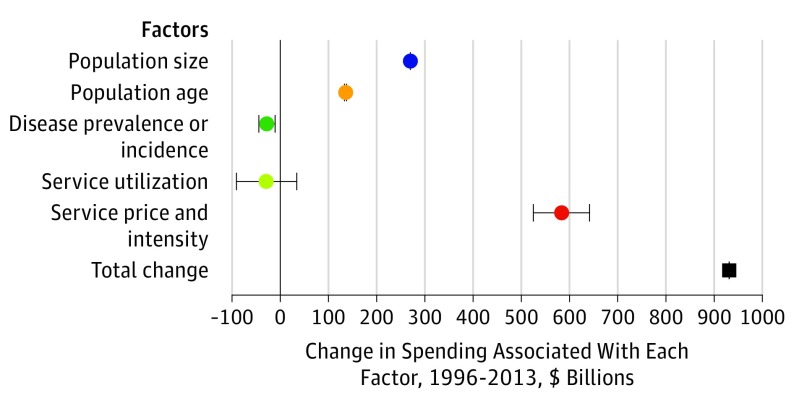
The 5-factor decomposition assessed 150 health conditions and tracked a $931.4 billion increase in US personal health care spending. (Diphtheria, intestinal infectious diseases, measles, vitamin A deficiency, and tetanus were removed because they did not have sufficient amount of prevalent cases to compete the decomposition.) The increase in population size was associated with a 23.1% (UI, 23.1% to 23.1%) increase in spending between 1996 and 2013, while population aging was associated with an 11.6% (UI, 11.4% to 11.8%) increase in spending (Figure 3). Change in disease prevalence or incidence was associated with a reduction in spending overall (2.4% [UI, 0.9% to 3.8%]), as was change in service utilization (2.5% [UI, −7.8% to +2.9%]). However, the relationship varied by condition category. Within cardiovascular diseases, decreases in prevalence were associated with a 20.7% (UI, 16.5% to 26.2%) reduction in spending, while among all other conditions together, decreases in prevalence or incidence were associated with a 1.1% increase (UI, −0.9% to +3.7%). Relationships between changes in utilization and cost growth also differed by type of care. Decreases in bed-days were associated with a 45.9% (UI, 40.7% to 51.9%) reduction in spending in the inpatient setting, whereas utilization increases were associated with a 67.1% (UI, 48.9% to 85.6%) increase in spending on pharmaceuticals. In contrast, increases in service price and intensity were associated with a 50.0% (UI, 45.0% to 55.0%) increase in spending between 1996 and 2013, although this association varied by type of care and health condition. Five-factor decomposition estimates reported in this article can be interactively explored at http://vizhub.healthdata.org/dex/.
Figure 3. Changes in Annual Spending Associated With Each Factor in the 5-Factor Decomposition, 1996-2013.
Data markers to the left of the black vertical line (no change) indicate factors associated with decreased spending; to the right of the line, factors associated with increased spending. Black square data marker indicates the total spending change between 1996 and 2013. Error bars indicate uncertainty intervals.
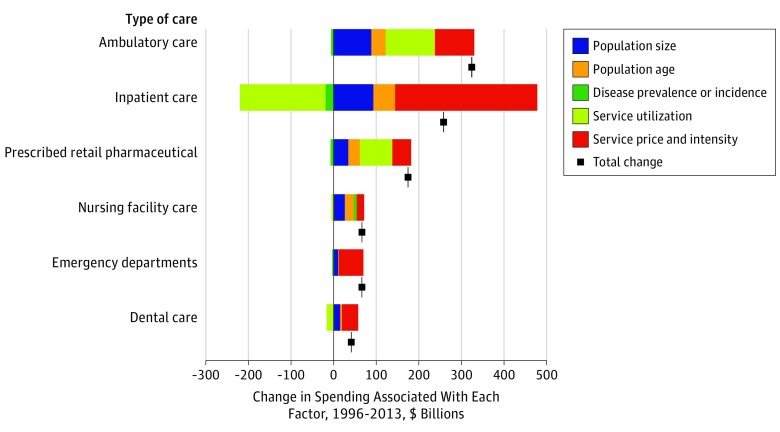
Figure 4 shows that annual spending on ambulatory care increased by $324.3 billion between 1996 and 2013, the most of any of the 6 types of care, from $381.5 billion in 1996 to $706.4 billion in 2013. The colored bars of Figure 4, Figure 5, Figure 6, and Figure 7 show the results of decomposition analyses associating each of the 5 factors with annual spending by type of care between 1996 and 2013. Increases in service utilization (more visits per case) were associated with a $115.5 (UI, $73.8 to $158.9) billion increase in ambulatory care spending. Greater service price and intensity (more spending per visit) was associated with an increase of $92.5 (UI, $53.7 to $130.7) billion in ambulatory care spending. Population size was associated with an $88.6 (UI, $88.4 to $88.8) billion increase in ambulatory care spending and age structure with a $33.7 (UI, $32.1 to $35.0) billion increase. Reductions in the number of prevalent cases between 1996 and 2013 for some expensive health conditions, such as ischemic heart disease and hypertension, were associated with a $6.0 billion reduction (UI, −$15.1 to +$3.1 billion) in ambulatory care spending.
Figure 4. Changes in Annual Spending Associated With Each Factor in the 5-Factor Decomposition by Type of Care, 1996-2013.
Each colored bar corresponds to 1 of 5 factors and reflects the amount of spending change associated with that factor. Bars to the left of the black vertical line (no change) indicate factors associated with decreased spending; to the right of the line, factors associated with increased spending within that type of care. The sum of the 5 bars equals the total spending change, 1996 through 2013, indicated with a black square marker. Error bars indicate uncertainty intervals.
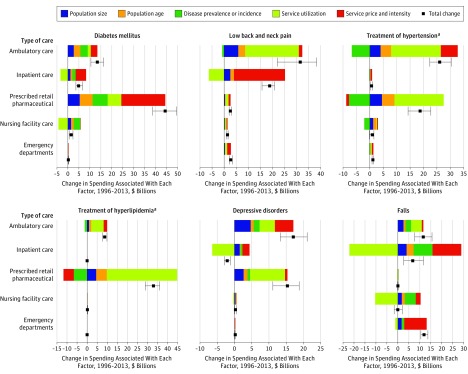
Figure 5. Changes in Annual Spending Associated With Each Factor in the 5-Factor Decomposition by Type of Care for the 6 Conditions With the Largest Absolute Spending Increases, 1996-2013.
Other neurologic diseases actually had the fifth-largest increase in health care spending but was omitted from this figure because it is a composite category made up of disparate neurologic diseases not included in the 6 other categories tracking spending on other neurologic diseases. The dental care category was omitted from the figure because none of the spending on these 6 health conditions is associated with dental care. Each colored bar corresponds to 1 of 5 factors and reflects the amount of spending change associated with that factor. Bars to the left of the black vertical line (no change) indicate factors associated with decreased spending; to the right of the line, factors associated with increased spending within that type of care. The sum of the 5 bars equals the total spending change, 1996 through 2013, indicated with a black square marker. Error bars indicate uncertainty intervals; absence of error bars around a marker indicates zero change. Condition-specific graphs for all health conditions included in this study are included in the eResults in the Supplement.
aSpending on treatment of this risk factor, rather than spending on diseases this risk factor causes.
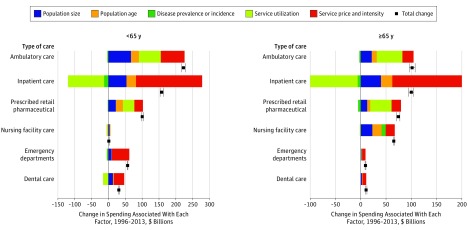
Figure 6. Spending Changes Associated With Each Factor in the 5-Factor Decomposition by Type of Care and Age Category, 1996-2013.
Each colored bar corresponds to 1 of 5 factors and reflects the amount of spending change associated with that factor. Bars to the left of the black vertical line (no change) indicate factors associated with decreased spending; to the right of the line, factors associated with increased spending within that type of care. The sum of the 5 bars equals the total spending change, 1996 through 2013, indicated with a black square marker. Error bars indicate uncertainty intervals.
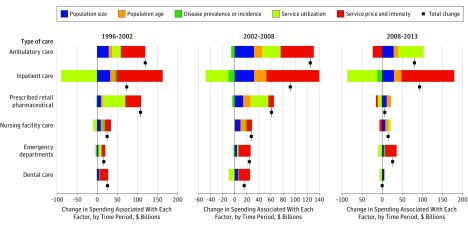
Figure 7. Spending Changes Associated With Each Factor in the 5-Factor Decomposition During 1996-2002, 2002-2008, and 2008-2013.
Each colored bar corresponds to 1 of 5 factors and reflects the amount of spending change associated with that factor. Bars to the left of the black vertical line (no change) indicate factors associated with decreased spending; to the right of the line, factors associated with increased spending within that type of care. The sum of the 5 bars equals the total spending change for each period, indicated with the black square marker. Error bars indicate uncertainty intervals.
Annual spending on inpatient care increased by $258.1 billion between 1996 and 2013 (Figure 4), from $438.0 billion in 1996 to $697.0 billion in 2013. Like ambulatory care, population size and population age structure were associated with increases in inpatient spending, and disease prevalence or incidence with a slight reduction in spending. Service utilization and service price and intensity had opposite relationships with inpatient spending increases during this period. Reductions in inpatient bed-days per prevalent or incident case were associated with a reduction of $201.1 (UI, $178.3 to $227.1) billion in annual spending, whereas increases in spending per bed-day were associated with a $333.7 (UI, $315.2 to $350.9) billion increase in annual inpatient health spending.
Figure 4 shows that across the other types of care, changes in service price and intensity were positively associated with spending increases, in particular for emergency department care ($58.0 [UI, $54.5 to $61.9] billion) and dental care ($38.1 [UI, $16.2 to $57.2] billion). Similarly, increases in population size and age were associated with increases in spending for all types of care. Increases in service utilization (purchased prescriptions per prevalent case) were associated with $76.1 (UI, $55.4 to $97.0) billion in retail pharmaceutical spending increases.
Figure 5 shows that the 5 factors were related to the individual health conditions in distinct ways. Within diabetes, which experienced the largest spending increase, increases were concentrated within retail pharmaceuticals ($44.4 [UI, $38.7 to $49.6] billion). Within retail pharmaceuticals, all 5 factors were associated with spending growth: there were more people, the people were generally older, age-standardized diabetes prevalence increased, there were more retail pharmaceuticals prescribed per prevalent case, and the mean spending per pharmaceutical increased. Across these 5 factors, service price and intensity was associated with the largest increase ($20.0 [UI, $12.1 to $27.5] billion). All 5 factors were also associated with increased diabetes spending in ambulatory care settings.
The health condition with the second largest increase in annual spending was low back and neck pain. Within this condition, the largest increases were for ambulatory care ($31.5 [UI, $22.1 to $38.3] billion) and inpatient care ($18.9 [UI, $15.7 to $20.9] billion). Service utilization increases were associated with spending increase within ambulatory care ($22.2 [UI, $15.8 to $27.3] billion), while service price and intensity was associated with spending increases on inpatient care ($21.1 [UI, $18.0 to $23.4] billion) for low back and neck pain.
The other 4 panels of Figure 5 show a diverse set of factors related to increases in spending on different health conditions. Increases in depressive disorder spending was most strongly associated with increases in spending on ambulatory care and retail pharmaceuticals, and all 5 factors were related to increases in spending for each type of care. Increases in spending on other neurologic disorders were most strongly associated with increases in the utilization of ambulatory care. Despite reductions in prevalence, there were still net increases in spending on retail pharmaceuticals for hyperlipidemia. In addition, increases in utilization were associated with increases in spending on ambulatory care and retail pharmaceuticals for the treatment of hypertension. The relationship of the 5 factors with spending for each type of care for each of the 150 conditions is reported in the eResults in the Supplement.
Figure 6 demonstrates that patterns in spending changes and the factors associated with these changes differed by broad age category. Service utilization was associated with much larger increases in the 65 years and older age group ($42.1 [UI, $33.5 to $51.6] billion of the $74.3 [UI, $70.9 to $77.5] billion increase in pharmaceutical spending), compared with ages younger than 65 years ($33.9 [UI, $20.4 to $47.2] billion of the $100.4 [UI, $97.2 to $103.7] billion increase). Service utilization was also associated with the largest spending increases within ambulatory care among people 65 years and older ($50.6 [UI, $38.1 to $63.0] billion of the $101.6 [UI, $95.9 to $107.6] billion increase in ambulatory spending) compared with the younger age group ($64.8 [UI, $34.8 to $97.7] billion of the $222.7 (UI, $216.9 to $228.4) billion increase). Spending on nursing facility care was more strongly related to overall spending changes for the older age group, whereas emergency care and dental care were more strongly related to overall spending changes for the younger age group.
Figure 7 shows how the 5 factors were associated with spending within each type of care over different periods. From 1996 to 2002 and from 2002 to 2008, spending increases were most associated with growth in service price and intensity ($259.1 [UI, $201.5 to $311.1] billion and $198.9 [UI, $169.6 to $229.7] billion, respectively). The relationships between the 5 factors and spending within different types of care changed somewhat from 2008 to 2013. Service price and intensity was negatively associated with spending on ambulatory care ($23.1 [UI, −$41.2 to +$1.6] billion), nursing facility care ($6.7 [UI, $1.5 to $18.7] billion), and prescribed retail pharmaceuticals ($4.4 [−$15.6 to +$6.6] billion).
Discussion
This study measured how 5 fundamental factors were collectively associated with a $933.5 billion increase in annual US health care spending between 1996 through 2013. Although population size and age were associated with increased spending for most health conditions and types of care, the other 3 factors had varying relationships with spending, depending on the health condition and type of care. Across all types of care and health conditions, increases in service price and intensity had the strongest associations with the total spending increase. Service utilization was associated with increases in spending on ambulatory care and retail pharmaceuticals but with reductions in spending on inpatient care. The association of disease incidence and prevalence with spending growth was minor overall but varied by condition. For example, the increasing prevalence of diabetes was associated with more health care spending on this condition, while reductions in the prevalence of cardiovascular diseases were associated with decreased health care spending.
This study adds to existing literature that has measured factors leading to increases in health care spending. These existing studies, which typically focus on 1 or 2 factors, have reached varying conclusions about which factors are associated with increases in health care spending. Some studies have suggested that spending increases are primarily attributable to changes in the spending per treated case, often pointing to technology changes as a significant contributor to spending increases. The research presented here tests and affirms these findings, demonstrating that service price and intensity have had the strongest association with increasing health care spending between 1996 and 2013 of the factors examined, associated with to a 50.0% (UI, 45.0% to 55.0%) increase overall. This increase was greatest in inpatient care and was an especially large contributor to increases in spending on retail pharmaceuticals for diabetes and on inpatient care for low back and neck, among others. The present study differs from prior studies in its ability to separate increases in service utilization from service price and intensity and to assess these relationships independently for each health condition and type of care.
The relationship between changes in service utilization and spending has been more variable. Service utilization in an inpatient setting has decreased between 1996 and 2013, meaning there were in general fewer inpatient bed-days per prevalent or incident case. This is observed for many health conditions, including cardiovascular conditions, labor and postpartum care, and low back and neck pain. This likely corresponds to encouragement from insurers and other groups to minimize the number of inpatient days associated with each admission. However, concurrent with reductions in inpatient days, there have been increases in inpatient prices and intensity of services. This relationship is somewhat tautological, because for many cases the number of inpatient services may have been compressed into a smaller number of days, thus leading to more spending per day. For most health conditions, however, the increase in inpatient spending associated with increases in price and intensity was greater than the reduction in spending associated with reductions in inpatient utilization, yielding a net increase in inpatient spending. The reduction in inpatient utilization has also occurred simultaneously with increases in ambulatory care and pharmaceutical utilization and in spending in these settings. This substitution may reflect attempts to encourage less costly modalities of care, as has been observed elsewhere.
In addition to increases in cost per case, existing research also has pointed to changes in disease prevalence or changes in demography as underlying factors fueling increases in health care spending. The finding in the present study that changing prevalence and incidence are less strongly associated with spending increases—and in some cases are associated with spending decreases—may be explained by the separation of changes in population size and aging from changes in disease prevalence or incidence. In addition, the protracted associations between disease prevalence and spending is also likely attributable to the fact that this study measured the associations with changes in clinical prevalence, which is measured by the GBD project. Because clinical disease prevalence or incidence is used, increases in spending due to changes in health care use will correspond to increases in service utilization. Previous research has underscored the importance of using clinical prevalence rather than treated prevalence, because an increase in spending attributed to treated prevalence might actually be caused by more people receiving care. Despite disease prevalence or incidence having a relatively small relationship with spending growth across all diseases, changes in prevalence or incidence were associated with sizable increases or decreases for a number of specific health conditions. Diabetes was one health condition for which increases in disease prevalence were associated with increases in health care spending, whereas cardiovascular diseases such as ischemic heart disease and cerebrovascular disease had reductions in disease prevalence between 1996 and 2013.
This study also corroborated existing research that points to demography as a major factor underlying health care spending, although this study differentiated increases in spending related to changes in population size vs changes in population age structure. Although aging was positively associated with spending increases, it was only the third-largest factor at the aggregate level and was associated with only half (50.2%) the spending increase of having a larger population. This suggests either that the relationship between an aging population and spending has yet to be realized or that the relationship is weaker than anticipated, a finding corroborated by previous work.
These findings have a diverse set of policy implications. For example, the finding that service price and intensity are major contributing factors to spending growth may suggest that policy efforts focused on reducing these factors could hold promise for reducing health care spending. Condition-specific analyses may point to particular health conditions to which attention could be turned, such as the rising price of pharmaceuticals for diabetes. In addition, the estimates developed here could also be used for forecasting the potential effect of policies that alter particular factors associated with cost growth, although such analyses were beyond the scope of this project and could be considered only exploratory.
Limitations
This study has several limitations. First, the expenditure estimates from the Disease Expenditure project were not separated by payer. Because public payers often pay lower prices than private or out-of-pocket payers, performing this analysis by payer could yield important insights. Second, data on spending and disease burden were only captured at the national level. Understanding subnational variation in health care spending would provide critical evidence for policymakers acting at state and local levels. Third, the data used for this study did not allow service price and intensity to be disaggregated into the individual components of changing service prices, intensity, and technology. To measure these distinct factors (which were aggregated in the present study), data tracking specific services or treatments—or data tracking relative-value units—would be needed for each health condition, age and sex group, type of care, and year of this study. This warrants further research. Fourth, estimates produced by the Disease Expenditure project only extended to 2013. The health care system is dynamic, and patterns may have changed in the years since. Specifically, pharmaceutical spending increased substantially in 2014 and 2015, and the gradual implementation of the Affordable Care Act may have contributed to other changes during this time. These data did not capture more recent trends, but future updates to the Disease Expenditure project aim to remedy this.
Conclusions
Increases in US health care spending from 1996 through 2013 were largely related to increases in health care service price and intensity but were also positively associated with population growth and aging and negatively associated with disease prevalence or incidence. Understanding these factors and their variability across health conditions and types of care can inform policy efforts to contain health care spending.
eMethods. Data Sources, Merging Data Sources, Decomposition, Code
eResults. eFigures
eReferences
References
- 1.Centers for Medicare & Medicaid Services National health expenditure data. https://www.cms.gov/research-statistics-data-and-systems/statistics-trends-and-reports/nationalhealthexpenddata/nationalhealthaccountshistorical.html. Accessed February 1, 2017.
- 2.Bureau of Economic Analysis National economic accounts. https://www.bea.gov/national/. 2017. Accessed March 8, 2017.
- 3.Emanuel E, Tanden N, Altman S, et al. . A systemic approach to containing health care spending. N Engl J Med. 2012;367(10):949-954. [DOI] [PubMed] [Google Scholar]
- 4.Dieleman JL, Baral R, Birger M, et al. . US spending on personal health care and public health, 1996-2013. JAMA. 2016;316(24):2627-2646. [DOI] [PMC free article] [PubMed] [Google Scholar]
- 5.Starr M, Dominiak L, Aizcorbe A. Decomposing growth in spending finds annual cost of treatment contributed most to spending growth, 1980-2006. Health Aff (Millwood). 2014;33(5):823-831. [DOI] [PubMed] [Google Scholar]
- 6.Smith S, Newhouse JP, Freeland MS. Income, insurance, and technology: why does health spending outpace economic growth? Health Aff (Millwood). 2009;28(5):1276-1284. [DOI] [PubMed] [Google Scholar]
- 7.Dunn A, Liebman E, Shapiro AH Federal Reserve Bank of San Francisco Working Paper Series: decomposing medical-care expenditure growth. http://www.frbsf.org/economic-research/files/wp12-26bk.pdf. 2012. Accessed February 1, 2017.
- 8.Newhouse JP. An iconoclastic view of health cost containment. Health Aff (Millwood). 1993;12(suppl):152-171. [DOI] [PubMed] [Google Scholar]
- 9.Bui AL, Dieleman JL, Hamavid H, et al. . Spending on children’s personal health care in the United States, 1996-2013. JAMA Pediatr. 2017;171(2):181-189. [DOI] [PMC free article] [PubMed] [Google Scholar]
- 10.Hamavid H, Birger M, Bulchis AG, et al. . Assessing the complex and evolving relationship between charges and payments in US hospitals: 1996-2012. PLoS One. 2016;11(7):e0157912. [DOI] [PMC free article] [PubMed] [Google Scholar]
- 11.Dieleman JL, Baral R, Johnson E, et al. . Adjusting health spending for the presence of comorbidities. Health Econ Rev. 2017;7(1):30. [DOI] [PMC free article] [PubMed] [Google Scholar]
- 12.GBD 2015 Disease and Injury Incidence and Prevalence Collaborators Global, regional, and national incidence, prevalence, and years lived with disability for 310 diseases and injuries, 1990-2015. Lancet. 2016;388(10053):1545-1602. [DOI] [PMC free article] [PubMed] [Google Scholar]
- 13.Flaxman AD, Vos T, Murray CJL. An Integrative Metaregression Framework for Descriptive Epidemiology. Seattle: University of Washington Press; 2015. [Google Scholar]
- 14.Preston S, Heuveline P, Guillot M. Demography: Measuring and Modeling Population Processes. London, UK: Blackwell Publishing; 2001. [Google Scholar]
- 15.Das Gupta P. Standardization and Decomposition of Rates: A User’s Manual. Washington, DC: US Bureau of the Census; 1993:23-186. [Google Scholar]
- 16.Dowle M, Srinivasan A Data.table: extension of “data.frame.” https://cran.r-project.org/web/packages/data.table/index.html. 2017. Accessed September 29, 2017.
- 17.Garbuszus JM, Jeworutzki S ReadStata13: import “Stata” data files. https://cran.r-project.org/web/packages/readstata13/index.html. Accessed September 29, 2017.
- 18.Gu Z. GetoptLong: parsing command-line arguments and variable interpolation. https://cran.r-project.org/web/packages/GetoptLong/index.html. Accessed September 29, 2017.
- 19.Wickham H, Francois R Dplyr: a grammar of data manipulation. https://cran.r-project.org/web/packages/dplyr/index.html. Accessed September 29, 2017.
- 20.Wickham H. Reshaping data with the Reshape package. J Stat Softw. November 2007. https://www.jstatsoft.org/article/view/v021i12/v21i12.pdf. Accessed September 29, 2017. [Google Scholar]
- 21.Wickham H. The split-apply-combine strategy for data analysis. https://www.jstatsoft.org/v40/i01/. 2011. Accessed September 29, 2017.
- 22.Wickham H. Scales: scale functions for visualization: R package version 0.4.1. https://cran.r-project.org/web/packages/scales/index.html. 2016. September 29, 2017.
- 23.Ginsburg PB. High and Rising Health Care Costs: Demystifying US Health Care Spending. Princeton, NJ: Robert Wood Johnson Foundation; 2008. [Google Scholar]
- 24.Mehrotra A, Dudley RA, Luft HS. What’s behind the health expenditure trends? Annu Rev Public Health. 2003;24:385-412. [DOI] [PubMed] [Google Scholar]
- 25.Thorpe KE, Florence CS, Howard DH, Joski P. The rising prevalence of treated disease: effects on private health insurance spending. Health Aff (Millwood). 2005;(Suppl Web Exclusives):W5-317–W5-325. [DOI] [PubMed] [Google Scholar]
- 26.Roehrig CS, Rousseau DM. The growth in cost per case explains far more of US health spending increases than rising disease prevalence. Health Aff (Millwood). 2011;30(9):1657-1663. [DOI] [PubMed] [Google Scholar]
- 27.Parsons T. Length of stay: managed care agenda or a measure of clinical efficiency? Psychiatry (Edgmont). 2006;3(6):46-52. [PMC free article] [PubMed] [Google Scholar]
- 28.Grube M, Kaufman K, York R Decline in utilization rates signals a change in the inpatient business model. Health Affairs Blog. http://healthaffairs.org/blog/2013/03/08/decline-in-utilization-rates-signals-a-change-in-the-inpatient-business-model/. March 2013. Accessed July 27, 2017.
- 29.Strunk BC, Ginsburg PB. Aging plays limited role in health care cost trends. Data Bull (Cent Stud Health Syst Change). 2002;(23):1-2. [PubMed] [Google Scholar]
- 30.White C. Health care spending growth: how different is the United States from the rest of the OECD? Health Aff (Millwood). 2007;26(1):154-161. [DOI] [PubMed] [Google Scholar]
- 31.Aitken M, Berndt ER, Cutler D, Kleinrock M, Maini L. Has the era of slow growth for prescription drug spending ended? Health Aff (Millwood). 2016;35(9):1595-1603. [DOI] [PMC free article] [PubMed] [Google Scholar]
Associated Data
This section collects any data citations, data availability statements, or supplementary materials included in this article.
Supplementary Materials
eMethods. Data Sources, Merging Data Sources, Decomposition, Code
eResults. eFigures
eReferences


