

Key Points
Question
Does genotype-guided dosing of warfarin prevent adverse events?
Findings
In this multicenter randomized clinical trial that included 1650 patients undergoing elective hip or knee arthroplasty, genotype-guided warfarin dosing compared with clinically guided warfarin dosing reduced the rate of a composite of major bleeding, international normalized ratio of 4 or greater, venous thromboembolism, or death from 14.7% to 10.8%.
Meaning
Genotype-guided dosing may improve the safety of warfarin initiation among patients undergoing hip or knee arthroplasty.
Abstract
Importance
Warfarin use accounts for more medication-related emergency department visits among older patients than any other drug. Whether genotype-guided warfarin dosing can prevent these adverse events is unknown.
Objective
To determine whether genotype-guided dosing improves the safety of warfarin initiation.
Design, Setting, and Patients
The randomized clinical Genetic Informatics Trial (GIFT) of Warfarin to Prevent Deep Vein Thrombosis included patients aged 65 years or older initiating warfarin for elective hip or knee arthroplasty and was conducted at 6 US medical centers. Enrollment began in April 2011 and follow-up concluded in October 2016.
Interventions
Patients were genotyped for the following polymorphisms: VKORC1-1639G>A, CYP2C9*2, CYP2C9*3, and CYP4F2 V433M. In a 2 × 2 factorial design, patients were randomized to genotype-guided (n = 831) or clinically guided (n = 819) warfarin dosing on days 1 through 11 of therapy and to a target international normalized ratio (INR) of either 1.8 or 2.5. The recommended doses of warfarin were open label, but the patients and clinicians were blinded to study group assignment.
Main Outcomes and Measures
The primary end point was the composite of major bleeding, INR of 4 or greater, venous thromboembolism, or death. Patients underwent a screening lower-extremity duplex ultrasound approximately 1 month after arthroplasty.
Results
Among 1650 randomized patients (mean age, 72.1 years [SD, 5.4 years]; 63.6% women; 91.0% white), 1597 (96.8%) received at least 1 dose of warfarin therapy and completed the trial (n = 808 in genotype-guided group vs n = 789 in clinically guided group). A total of 87 patients (10.8%) in the genotype-guided group vs 116 patients (14.7%) in the clinically guided warfarin dosing group met at least 1 of the end points (absolute difference, 3.9% [95% CI, 0.7%-7.2%], P = .02; relative rate [RR], 0.73 [95% CI, 0.56-0.95]). The numbers of individual events in the genotype-guided group vs the clinically guided group were 2 vs 8 for major bleeding (RR, 0.24; 95% CI, 0.05-1.15), 56 vs 77 for INR of 4 or greater (RR, 0.71; 95% CI, 0.51-0.99), 33 vs 38 for venous thromboembolism (RR, 0.85; 95% CI, 0.54-1.34), and there were no deaths.
Conclusions and Relevance
Among patients undergoing elective hip or knee arthroplasty and treated with perioperative warfarin, genotype-guided warfarin dosing, compared with clinically guided dosing, reduced the combined risk of major bleeding, INR of 4 or greater, venous thromboembolism, or death. Further research is needed to determine the cost-effectiveness of personalized warfarin dosing.
Trial Registration
clinicaltrials.gov Identifier: NCT01006733
This randomized clinical trial compares clinically guided vs genotype-guided dosing to assess whether it improves the safety of warfarin initiation in patients undergoing elective hip or knee arthroplasty.
Introduction
For at least the last 10 years, warfarin use has accounted for more medication-related emergency department visits among older patients than any other drug.1,2 Warfarin dose requirements vary widely among individuals because of common single nucleotide polymorphisms (SNPs).3,4 Because knowledge of a patient’s genotype should lead to more accurate warfarin initiation and a concomitant reduction in adverse events, the product label for warfarin (Coumadin and others)5 has encouraged genotype-guided dosing since 2007.
However, multicenter studies of genotype-guided dosing of oral vitamin K antagonists have had mixed results.6,7,8,9,10,11,12,13,14 The 2 largest trials7,8 found no improvement in the primary end point of international normalized ratio (INR) control. In contrast, the European Pharmacogenetics of Anticoagulant Therapy (EU-PACT) trial of 445 patients found improved INR control with genotype-guided warfarin dosing.9 Thus, it remains unclear whether genotype-guided dosing improves the safety of warfarin initiation.6,7,8,9
The goal of this multicenter randomized clinical trial was to determine whether genotype-guided warfarin dosing reduced adverse events.
Methods
The Genetic Informatics Trial (GIFT) of Warfarin to Prevent Deep Vein Thrombosis was a multicenter randomized clinical trial of patients initiating warfarin at the time of elective hip or knee arthroplasty.15 We used a 2 × 2 factorial design to randomize participants to genotype-guided or clinically guided dosing of warfarin on days 1 through 11 of therapy and to a target INR of 1.8 or 2.5. The results of genotype-guided vs clinically guided dosing of warfarin on days 1 through 11 of therapy are presented in this article (the trial protocol appears in Supplement 1).
Patients were randomized 1:1 using a computerized system that stratified by site, type of arthroplasty (knee or hip), and race (black vs other). Randomization was stratified based on race because the CYP2C9*2 and CYP2C9*3 SNPs are less common among populations with African ancestry compared with other populations.16 Race was self-identified using standard National Institutes of Health categories. The randomization sequence was generated by the WarfarinDosing.org webmaster at IsoDynamic.com.
Participants and study personnel were blind to study group assignment and genotype; however, the warfarin dosing was open label. The study was approved by the institutional review boards at each site, the US Food and Drug Administration (FDA), and the US Centers for Medicare & Medicaid Services. All participants provided written informed consent in accordance with the Declaration of Helsinki.
Patients planning to undergo elective hip or knee arthroplasty who were aged 65 years or older and had a life expectancy of longer than 6 months were recruited for the trial. Exclusion criteria were patients with (1) a genotype or therapeutic warfarin dose known from prior therapy, (2) prior nonadherence, (3) contraindication to warfarin, (4) a treatment plan to receive an anticoagulant other than warfarin, (5) known thrombophilia, (6) a bleeding disorder, (7) a serious bleeding event within past 2 years (unless caused by trauma), (8) a baseline INR of 1.35 or greater, or (9) an additional indication for warfarin (eg, atrial fibrillation).
Trial Procedures
Testing for the INR was performed per standard practice. Warfarin was initiated either the night prior to arthroplasty (standard practice at Washington University in St Louis, St Louis, Missouri; University of Utah, Salt Lake City; and University of Texas Southwestern, Dallas) or the night of arthroplasty (standard practice at Hospital for Special Surgery, New York, New York; Intermountain Healthcare, Salt Lake City, Utah; and Rush University Medical Center, Chicago, Illinois). Except for dose recommendations, each study group was treated identically (with genotypes concealed in both groups).
A dose deviation was defined as a prescribed warfarin dose on days 1 through 11 of therapy that differed from the web application recommendation by 1.0 mg/d or greater (for doses >3 mg/d) or 0.5 mg/d or greater (for doses ≤3.0 mg/d). After day 11 of therapy, clinicians were free to continue the recommended warfarin dose or change it, depending on subsequent INR measures. Study participants underwent diagnostic testing in the event of signs or symptoms of deep vein thrombosis (DVT) or pulmonary embolism.
Participants who did not have a symptomatic venous thromboembolism (VTE) underwent bilateral duplex ultrasound screening approximately 1 month after arthroplasty. Ultrasonography was conducted and the ultrasounds were read by study personnel who were blinded to study group assignment.
Genotype-Guided Dosing of Warfarin
Warfarin dosing during the first 11 days of therapy was guided by a web application (WarfarinDosing.org; FDA investigational device exemption No. G100317) that incorporated clinical variables for all patients and also incorporated SNPs in VKORC1 (GenBank accession number AY587020), CYP2C9 (GenBank accession number AY702706), and CYP4F23,17,18 (GenBank accession number AF22194) for patients randomized to genotype-guided dosing algorithms.16,19,20,21 SNPs in CYP2C9 determine S-warfarin metabolism17; VKORC1, warfarin sensitivity3; and CYP4F2, vitamin K metabolism.18,22
Blood for genotyping and archiving was obtained when it was drawn for the preoperative laboratory tests. Extraction of DNA from deidentified blood samples collected in EDTA tubes was performed to determine genotype for VKORC1*2 (-1639G>A, Short Genetic Variations database [dbSNP] rs9923231), CYP2C9*2 (430C>T, dbSNP rs1799853), CYP2C9*3 (1075A>C, dbSNP rs1057910), and CYP4F2*3 (V433M, 1297G>A, dbSNP rs2108622). Three clinical sites (Washington University in St Louis, University of Utah, and Intermountain Healthcare) performed local preoperative genotyping using GenMarkDx (formerly Osmetech) eSensor instrument and reagents, and using laboratory-developed real-time polymerase chain reaction methods (CYP4F2 only).
The central laboratory at Washington University in St Louis used the same methods to perform preoperative genotyping for the other 3 clinical sites (Hospital for Special Surgery, Rush University Medical Center, and University of Texas Southwestern). Once per month, the central laboratory also performed independent confirmatory genotyping using pyrosequencing or real-time polymerase chain reaction methods. Based on a trivial genotyping error rate (1 of 5689 SNPs), duplicate genotyping was discontinued in November 2013; thereafter, the central laboratory performed preoperative genotyping using the GenMarkDx platform for all sites.
Outcomes
The primary outcome of the study was a composite of the following adverse events: major bleeding within 30 days, INR of 4 or greater within 30 days, death within 30 days, and symptomatic or asymptomatic VTE confirmed by objective testing within 60 days of arthroplasty. Major bleeding was defined as (1) bleeding into a critical area (intracranial, epidural, intraocular, pericardial, or retroperitoneal), (2) overt bleeding that resulted in death, (3) a hematoma requiring a return to the operating room, (4) a decrease in hemoglobin level of 2 g/dL or greater, (5) a transfusion of 2 or more units of blood, or (6) hemodynamic changes requiring a transfusion of 1 or more units of blood. Bleeding that did not meet the major bleeding definition was further subclassified as nonmajor clinically relevant bleeding or minor bleeding that was not significant using the definition from prior anticoagulant trials.7,23,24
Secondary outcomes were (1) adverse events; (2) the therapeutic warfarin dose; (3) INR control reported as the percentage of time in the therapeutic range (PTTR) calculated using linear interpolation25; and (4) 90-day follow-up for the composite outcomes. When calculating the PTTR, an INR was considered in the target range if it was within the range of 2.0 to 3.0 for patients with a target INR of 2.5 and within the range of 1.5 to 2.1 for patients with a target INR of 1.8.15 The same INR ranges were used when calculating the time to reach a therapeutic INR, which required that the subsequent INR (if any) measured at 1 week or longer also was within this target range without an intervening nontherapeutic INR. When 2 INR values were obtained on the same day, the mean was used.
Statistical Analyses
The study was analyzed on a modified intention-to-treat basis and included all randomized participants who received 1 or more doses of warfarin. In addition, we prespecified an analysis of the primary end point among patients in the high-risk subgroup whose clinically guided vs genotype-predicted doses differed by 1.0 mg/d or greater (according to baseline genotype- and clinically guided algorithms16).
To preserve a type I error rate of 5%, we partitioned the α value between the entire study population and the high-risk subgroup. Because the primary end points in the 2 groups were collinear, we used simulation to determine possible pairs of α values that preserved the overall type I error.26 We selected an α value of .044 a priori for the primary outcome in the whole study population and an α value of .01 in the high-risk subgroup. We used an α value of .05 for other statistical testing.
To provide adequate power to detect a relative rate (RR) of 0.68 for the composite end point, we selected a sample size of 1600 participants. The RR estimate of 0.68 was selected based on a meta-analysis of clinical trials27 and a large observational study.28
The primary outcome was analyzed using the χ2 test and confirmed using a generalized linear mixed model with site as a random effect. We calculated the rates (including for the post hoc analyses) by dividing the number of events by the total number of patients. We calculated the 95% CI for the absolute difference in rates using the method of Newcombe.29
Secondary analyses of rare events (expected frequency ≤5) were analyzed using the Fisher exact test and after adding 0.5 as a continuity correction. We used logistic regression to test for an interaction between study group and these categories selected a priori: high-risk subgroup, black race, target INR of 1.8 vs 2.5, and CYP2C9 genotype. In the test of CYP2C9 genotype, we assigned 1 point for each CYP2C9*2 allele and 2 points for each CYP2C9*3 allele based on their effect on S-warfarin clearance.
We compared PTTR using an unpaired t test. Linear regression was used to test for an interaction between PTTR and target INR. For time to event analyses, we censored participants at the time of withdraw or loss to follow-up or 30 days after arthroplasty (whichever came first). For the time to therapeutic INR analysis, patients who had fewer than 24 days of INR monitoring were censored on the day of their last measured INR.
We compared the number of days until an INR exceeded the target INR by 1.5 using the log-rank test and the Cox proportional hazards model. For the Cox models, we confirmed the proportional hazard assumption by verifying that there was no interaction between predictor variables and time. All statistical tests were 2-sided. Statistical analyses were conducted using SAS analytical software version 9.4 (SAS Institute Inc) and R version 3.3.1 (R Project for Statistical Computing).
Results
Among 1650 patients (mean [SD] age 72.1 [5.4] years; 63.6% women; and 91.0% white), 831 (50.4%) were randomized to genotype-guided warfarin dosing and 819 (49.6%) to clinically guided warfarin dosing (eTable 1 in Supplement 2 and Figure 1). Enrollment began in April 2011 and patients were followed up for 90 days; follow-up of the final patient occurred in October 2016. Twenty-three patients in the genotype-guided group and 30 in the clinically guided group were excluded because they did not undergo arthroplasty, withdrew from the trial, never received warfarin, or were discovered to have met an exclusion criterion after randomization.
Figure 1. Consent, Randomization, and Follow-up of Participants in the Genetic Informatics Trial of Warfarin to Prevent Deep Vein Thrombosis.

aThe number of patients screened for eligibility is not known.
bA list of the exclusion criteria appears in the Methods section.
The patients who did not receive the intervention (eTable 1 in Supplement 2) had a higher baseline INR compared with the included participants (1.03 vs 1.01, respectively) and were more likely to be smokers (9.4% vs 3.4%), scheduled for hip arthroplasty (45.3% vs 25.4%), and have a target INR of 2.5 (64.1% vs 49.7%). The final sample consisted of 1597 older participants who were predominantly white (91.1%) (Table 1), reflecting the arthroplasty population at the participating medical centers (59.2% of participants were recruited at the Hospital for Special Surgery). The genotype distribution was balanced between the 2 study groups (Table 2).
Table 1. Demographic and Clinical Factors of Participants in the Genetic Informatics Trial of Warfarin to Prevent Deep Vein Thrombosis.
| Warfarin Dosing | ||
|---|---|---|
| Genotype-Guided (n = 808) |
Clinically Guided (n = 789) |
|
| Age, mean (SD), y | 72.2 (5.3) | 72.0 (5.5) |
| Body mass index, mean (SD)a | 29.3 (5.6) | 29.0 (5.4) |
| Body surface area, mean (SD), m2 | 1.92 (0.25) | 1.92 (0.24) |
| Baseline international normalized ratio | 1.0 (0.1) | 1.0 (0.1) |
| Arthroplasty indication, No. (%) | ||
| Hip replacement | 207 (25.6) | 199 (25.2) |
| Knee replacement | 601 (74.4) | 590 (74.8) |
| Target international normalized ratio, No. (%) | ||
| 1.8 | 406 (50.2) | 398 (50.4) |
| 2.5 | 402 (49.8) | 391 (49.6) |
| Female sex, No. (%) | 522 (64.6) | 496 (62.9) |
| High-risk subgroup, No./total (%)b | 323/808 (40.0) | 335/789 (42.5) |
| Race, No. (%) | ||
| Black | 52 (6.4) | 50 (6.3) |
| American Indian or Alaskan Native | 1 (0.1) | 0 |
| Asian or Indian subcontinent | 16 (2.0) | 13 (1.6) |
| White | 735 (91.0) | 719 (91.1) |
| Otherc | 4 (0.5) | 7 (0.9) |
| Hispanic, No. (%) | 17 (2.1) | 25 (3.2) |
| History, No. (%) | ||
| Smoking | 21 (2.6) | 33 (4.2) |
| Diabetes | 116 (14.4) | 105 (13.3) |
| Liver disease | 6 (0.7) | 6 (0.8) |
| Venous thromboembolism | 6 (0.7) | 6 (0.8) |
| Drugs that interact with warfarin, No. (%)d | ||
| Sulfamethoxazole | 4 (0.5) | 2 (0.3) |
| Fluconazole or other azole | 3 (0.4) | 2 (0.3) |
| Statin | 365 (45.2) | 402 (51.0) |
| CYP2C9 inducerd,e | 3 (0.4) | 3 (0.4) |
| Amiodarone | 0 | 3 (0.4) |
Calculated as weight in kilograms divided by height in meters squared.
Consists of patients whose clinically guided vs genotype-predicted warfarin doses differed by 1.0 mg/d or greater (according to baseline genotype and clinical algorithms).
Pacific Islander, mixed race, or self-identified as other.
Prescribed during initial 11 days of therapy.
Carbamazepine, phenobarbital, phenytoin, or rifampin.
Table 2. Distribution of Genotypes Across Study Groups.
| Genetic Loci | Warfarin Dosing, No. (%) | |
|---|---|---|
| Genotype-Guided (n = 808) |
Clinically Guided (n = 789) |
|
| CYP2C9*2 (430C>T) rs1799853 | ||
| CC | 641 (79.3) | 612 (77.6) |
| CT | 151 (18.7) | 169 (21.4) |
| TT | 16 (2.0) | 8 (1.0) |
| CYP2C9*3 (1075A>C) rs1057910 | ||
| AA | 709 (87.8) | 677 (85.8) |
| AC | 94 (11.6) | 102 (12.9) |
| CC | 5 (0.6) | 10 (1.3) |
| VKORC1*2 (-1639G>A) rs9923231 | ||
| GG | 305 (37.8) | 293 (37.1) |
| AG | 371 (45.9) | 352 (44.6) |
| AA | 132 (16.3) | 144 (18.3) |
| CYP4F2*3 (1297G>A) rs2108622 | ||
| GG | 379 (46.9) | 397 (50.3) |
| AG | 350 (43.3) | 331 (42.0) |
| AA | 79 (9.8) | 61 (7.7) |
Primary Outcome
Eighty-seven of 808 participants (10.8%) in the genotype-guided group and 116 of 789 participants in the clinically guided group (14.7%) experienced at least 1 composite end point, corresponding to an absolute risk difference of 3.9% (95% CI, 0.7% to 7.2%; P = .02). The results for the genotype-guided dosing group were similar in the mixed model (P = .02). The rate difference for individual adverse events was 0.8% (95% CI, –0.2% to 1.8%) for major bleeding, 2.8% (95% CI, 0.1% to 5.6%) for INR of 4 or greater, and 0.7% (95% CI, –1.3% to 2.8%) for VTE (Table 3). None of the participants died.
Table 3. Components of the Composite Primary End Pointa.
| Warfarin Dosing, No. (%) | Absolute Difference (95% CI), % |
Relative Rate (95% CI) |
P Value | ||
|---|---|---|---|---|---|
| Genotype-Guided (n = 808) |
Clinically Guided (n = 789) |
||||
| Met ≥1 primary end point componentb | 87 (10.8) | 116 (14.7) | 3.9 (0.7 to 7.2) | 0.73 (0.56 to 0.95)c | .02 |
| Primary End Point Components | |||||
| Major bleeding on days 1-30 | 2 (0.2) | 8 (1.0) | 0.8 (–0.2 to 1.8) | 0.24 (0.05 to 1.15) | .06 |
| Plus INR <4 | 2 (0.2) | 6 (0.8) | 0.5 (–0.4 to 1.5) | ||
| Plus INR ≥4 | 0 | 2 (0.3) | 0.3 (–0.4 to 1.0) | ||
| INR ≥4 on days 1-30 | 56 (6.9) | 77 (9.8) | 2.8 (0.1 to 5.6) | 0.71 (0.51 to 0.99) | .04 |
| Venous thromboembolism on days 1-60 | 33 (4.1) | 38 (4.8) | 0.7 (–1.3 to 2.8) | 0.85 (0.54 to 1.34) | .48 |
| PE or symptomatic DVT | 10 (1.2) | 15 (1.9) | 0.7 (–0.7 to 2.1) | ||
| PE | 3 (0.4) | 8 (1.0) | 0.6 (–0.3 to 1.7) | ||
| Death on days 1-30 | 0 | 0 | |||
Abbreviations: DVT, deep vein thrombosis; INR, international normalized ratio; NA, not applicable; PE, pulmonary embolism.
There were 1597 patients who met criteria for a primary end point.
Patients who met multiple end points were counted only once in the total.
When using a mixed model with site as a random effect, the odds ratio was 0.70 (95% CI, 0.52-0.94), confirming a benefit with genotype-guided dosing of warfarin.
The reduction in INR values of 4 or greater occurred after the first week of warfarin therapy (Figure 2) and did not delay the time to reach a therapeutic INR (eFigure in Supplement 2). In the high-risk subgroup (n = 658; 41.2% of participants), the rates of the composite end point in the genotype-guided group vs the clinically guided group were 11.5% vs 15.2%, respectively, for an absolute difference of 3.76% (95% CI, –9.0% to 1.5%, P = .16). The benefit of genotype-guided dosing was consistent in that there was no significant interaction in any of the subgroups examined (high-risk subgroup, P = .88; black race, P = .74; CYP2C9 genotype, P = .16; target INR of 1.8 vs 2.5, P = .70; or hip vs knee arthroplasty, P = .36).
Figure 2. Kaplan-Meier Plot of the Time to Supratherapeutic International Normalized Ratio of 4 or Greater.

Additional Clinical Outcomes
The rate of either major or nonmajor clinically relevant bleeding was 7.1% (57 events) in the genotype-guided group and 9.4% (74 events) in the clinically guided group for an absolute difference of 2.3% (95% CI, –0.4% to 5.1%; P = .09). Kaplan-Meier analysis confirmed that the risk of either major or nonmajor clinically relevant bleeding was similar (Figure 3).
Figure 3. Kaplan-Meier Plot of the Time to a Major or Nonmajor Clinically Relevant Bleeding Event.

In a post hoc analysis, the rate of symptomatic major adverse events (major bleeding, symptomatic DVT, or pulmonary embolism) was 1.5% (12 events) in the genotype-guided group and 2.9% (23 events) in the clinically guided group (between-group difference, 1.4% [95% CI, 0%-3.0%]; P = .051). The rates of other adverse events (post hoc analyses) were similar in the 2 groups (eTable 2 and eFigure in Supplement 2).
Between the primary follow-up and day 90, there was 1 VTE in each group and 1 major bleeding event (an intracranial hemorrhage 2 months after stopping warfarin) in the clinically guided group. By day 90, the composite outcome (including INRs ≥4) had occurred in 90 participants (11.1%) in the genotype-guided group and 119 participants (15.1%) in the clinically guided group (between-group difference, 3.9% [95% CI, 0.6%-7.3%]; P = .02). The risk of an INR exceeding the target INR by 1.5 or greater was not significantly reduced in the genotype-guided group compared with the clinically guided group (hazard ratio, 0.78 [95% CI, 0.59-1.03]; log-rank test, P = .08).
Percentage of Time in the Therapeutic Range
The PTTR was calculable for 1588 participants (Table 4). Genotyping significantly (P = .004) improved PTTR by 3.4% (95% CI, 1.1%-5.8%) from a mean of 51.3% with clinically guided warfarin dosing to 54.7% with genotype-guided dosing (Figure 4 and Figure 5). Genotyping especially benefitted the high-risk subgroup (P = .006 for interaction) in whom the improvement was 7.0% (95% CI, 3.4%-10.6%) from a mean of 48.4% (SD, 23.8%) with clinically guided dosing to 55.3% (SD, 23.4%) with genotype-guided dosing.
Table 4. Percentage of Time in the Therapeutic Range (PTTR) Through Week 4 of Therapya.
| Genotype-Guided Warfarin Dosing | Clinically Guided Warfarin Dosing | Mean Difference (95% CI), % |
P Value |
P Value for Interaction |
|||
|---|---|---|---|---|---|---|---|
| No. of Patients |
Mean PTTR (95% CI), % |
No. of Patients |
Mean PTTR (95% CI), % |
||||
| All patients | 803 | 54.7 (53.0 to 56.4) | 785 | 51.3 (49.6 to 53.0) | 3.4 (1.1 to 5.8) | .004 | |
| Per-protocol analysis | 784 | 55.1 (53.4 to 56.8) | 761 | 51.9 (50.2 to 53.6) | 3.3 (0.9 to 5.7) | .006 | |
| High-risk subgroupb | 321 | 55.3 (52.7 to 57.9) | 333 | 48.4 (45.9 to 50.9) | 7.0 (3.4 to 10.6) | <.001 | |
| INR target | |||||||
| 1.8 (range, 1.5-2.1) | 404 | 53.3 (50.9 to 55.7) | 396 | 52.1 (49.7 to 54.5) | 1.1 (–2.2 to 4.5) | .51 | .053 |
| 2.5 (range, 2.0-3.0) | 399 | 56.2 (53.9 to 58.5) | 389 | 50.4 (48.1 to 52.7) | 5.8 (2.5 to 9.1) | .001 | |
| Absolute difference between algorithms in predicted warfarin dose | |||||||
| ≥1.0 mg/d (high-risk group) | 321 | 55.3 (52.7 to 57.9) | 333 | 48.4 (45.9 to 50.9) | 7.0 (3.4 to 10.6) | <.001 | .006 |
| <1.0 mg/d | 482 | 54.3 (52.1 to 56.5) | 452 | 53.4 (51.2 to 55.6) | 0.9 (–2.2 to 4.0) | .57 | |
| Race | |||||||
| Black | 52 | 50.9 (44.8 to 57.0) | 50 | 50.7 (44.1 to 57.4) | 0.2 (–8.9 to 9.4) | .96 | .48 |
| Other races | 751 | 55.0 (53.3 to 56.7) | 735 | 51.3 (49.6 to 53.0) | 3.7 (1.2 to 6.1) | .003 | |
| Type of arthroplasty | |||||||
| Knee | 599 | 54.4 (52.4 to 56.4) | 586 | 50.9 (49.0 to 52.8) | 3.6 (0.8 to 6.3) | .01 | .86 |
| Hip | 204 | 55.5 (52.4 to 58.6) | 199 | 52.4 (48.9 to 55.9) | 3.1 (–1.6 to 7.8) | .19 | |
| Analysis by 2-wk intervals | |||||||
| From day 4-14 | 803 | 48.5 (26.1 to 67.3)c | 785 | 42.9 (22.9 to 62.0)c | 5.7 (2.2 to 9.2) | .005 | |
| From day 15-28 | 790 | 65.0 (31.8 to 100.0)c | 767 | 61.1 (29.1 to 100.0)c | 3.9 (–1.8 to 10.0) | .13 | |
Abbreviation: INR, international normalized ratio.
There were 1588 patients who had an INR measured on or after day 4 and were included in PTTR calculations (those without INR measurements were excluded from the PTTR calculations in this Table).
Consists of patients whose clinically guided vs genotype-guided doses of warfarin differed by 1.0 mg/d or greater (according to baseline genotype and clinical algorithms).
Data expressed as median (interquartile range) because the PTTR was not normally distributed.
Figure 4. Distribution of Percentage of Time in the Therapeutic Range (PTTR) for All Patients With an International Normalized Ratio on Day 4 or Later (N = 1588).

Plot shows the probability densities of the PTTR of the international normalized ratio values from days 4 through 28 of warfarin therapy.
Figure 5. Distribution of Percentage of Time in the Therapeutic Range (PTTR) for Patients Stratified by the Absolute Difference in the Predicted Initial Dose of Warfarin and by Self-described Race.
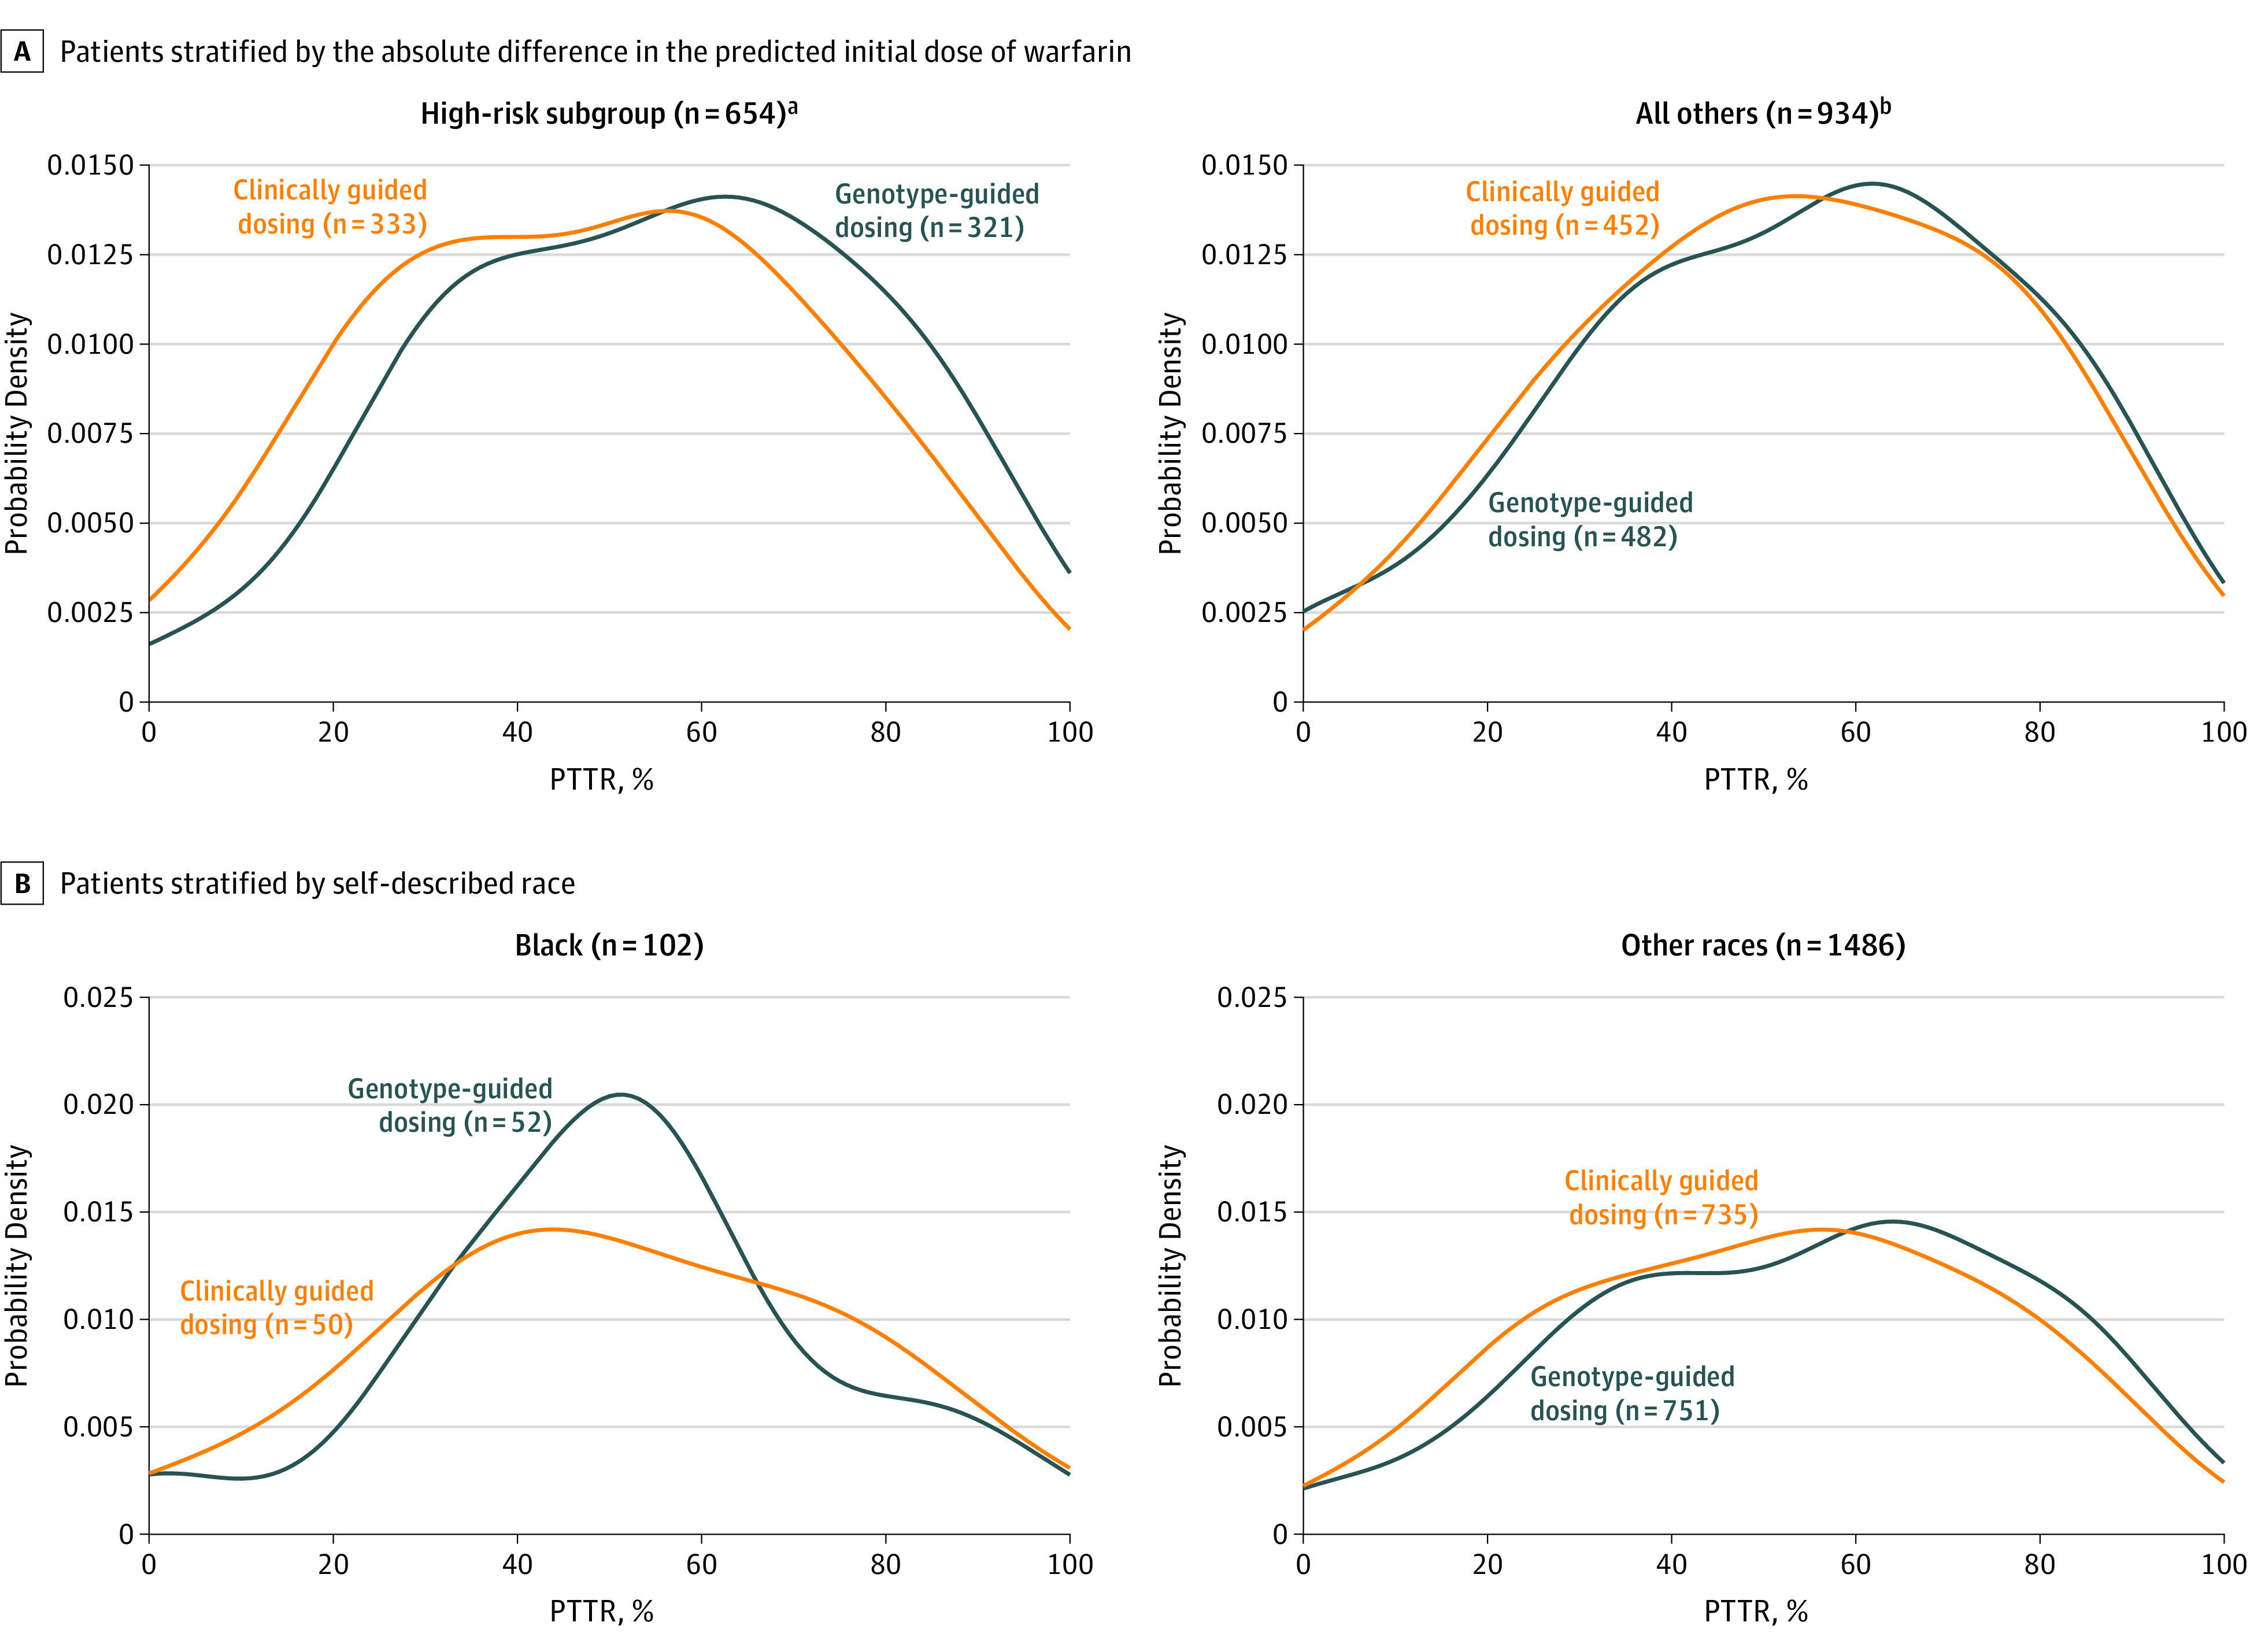
Plots show the probability densities of the PTTR of the international normalized ratio values from days 4 through 28 of warfarin therapy.
aPatients whose clinically guided vs genotype-predicted doses of warfarin differed by 1.0 mg/d or greater (according to baseline genotype and clinical algorithms).
bPatients whose clinically guided vs genotype-predicted doses of warfarin differed by less than 1.0 mg/d (according to baseline genotype and clinical algorithms).
The effect of genotype-guided dosing on PTTR was consistent in the 2 target INR groups (P = .053 for interaction) and among black participants (P = .48 for interaction). Between days 4 and 14 of warfarin therapy, genotype-guided dosing improved PTTR (absolute gain, 5.7% [95% CI, 2.2%-9.2%]; P = .005).
Protocol Adherence
Genotyping was completed prior to warfarin initiation for all but 1 patient. There were a total of 1068 dose deviations, representing 6.1% of the 17 567 doses recommended by the protocol. In the genotype-guided dosing group, 306 of 808 patients (37.9%) had at least 1 dose deviation; in the clinically guided dosing group, 349 of 789 (44.2%) had at least 1 dose deviation (P = .009).
One patient was lost to follow-up before the 30-day telephone call. Sixty-seven participants (36 [4.5%] in the genotype-guided group and 31 [4.2%] in the clinically guided group) did not undergo duplex ultrasound screening for DVT and were assumed to not have DVT.
Discussion
In this randomized clinical trial of warfarin thromboprophylaxis after hip and knee arthroplasty, genotype-guided dosing prevented more adverse outcomes than clinically guided dosing. The absolute reduction in the composite end point (3.9%; 95% CI, 0.7%-7.2%) was similar in the predefined high-risk subgroup (whose clinically vs genotype-predicted doses differed by ≥1.0 mg/d) and in an analysis extended to 90 days after arthroplasty.
The reduction in adverse events was likely the result of improved INR control (as quantified by the PTTR), which was 54.7% in the genotype-guided group vs 51.3% in the clinically guided group. The improvement in PTTR was greatest in the high-risk subgroup.
Compared with previous studies,7,8,9,10,11,12,13,14 this trial was larger, used genotype-guided dosing for a longer duration, and incorporated more genes into the dosing algorithm. Because the trial randomized approximately 1600 older patients (aged ≥65 years) undergoing arthroplasty, the effect of genotype-guided dosing was quantified for clinical outcomes rather than for PTTR alone.
The trial used genotype-guided dosing for 11 days compared with only 4 or 5 days in the Clarification of Optimal Anticoagulation through Genetics (COAG) trial7 and in the EU-PACT8,9 and fewer days in other trials.10,11,12,13,14 The longer period of genotype-guided dosing likely prevented cases of supratherapeutic INR that were common in these trials and during the second week of warfarin therapy in the clinically guided dosing group in this trial (Figure 4). Also, unlike prior trials performed at multiple centers,7,8,9 this trial incorporated the CYP4F2 (V433M) SNP in the genotype algorithms.
Limitations
This study has several limitations. First, although participants and study personnel were blinded to study group and to genotype, the warfarin dose was open label. Therefore, study personnel may have been able to infer the study group, particularly in participants who only rarely needed dose adjustments. However, the warfarin dosing algorithms used in both of the study groups adjusted for many factors so dose estimates varied widely among patients in both the genotype-guided group and the clinically guided group. As a further protection against bias, the end points were adjudicated without knowledge of study group or genotype.
Second, the 3.9% absolute reduction in the primary outcome (death, major bleeding event, INR ≥4, or VTE) was primarily related to differences in rates of INR of 4 or greater (Figure 2). The 1.4% reduction in symptomatic major clinical adverse events (major bleeding, symptomatic DVT, or pulmonary embolism) did not achieve independent statistical significance (P = .051). Likewise, the risk of an INR exceeding the target INR by 1.5 or greater was not significantly reduced during the 90 days of follow-up (P = .08). Third, in this multicenter trial, most participants were enrolled at high-volume academic medical centers, which may limit generalizability. However, genotype-guided warfarin dosing may be more beneficial at low-volume hospitals, which may have higher rates of adverse events.30,31
Fourth, participants were aged 65 years or older. The benefits of genotype-guided dosing may differ when applied to patients of other ages or to general clinical practice. For example, advantages of genotype-guided dosing may be greater among populations in whom the VKORC1 and CYP2C9 SNPs are more common.32 In contrast, the advantages of genotype-guided dosing may be diminished in populations with African ancestry because most genetic algorithms were derived primarily in populations composed of other races.7,33
The benefits of genotype-guided dosing also may be reduced in patients who need to start warfarin before their genotype can be obtained. On the other hand, the benefits of genotype-guided dosing may be greater in clinical settings when warfarin initiation is dosed empirically rather than being guided by clinical algorithms.
Despite the requirement for INR monitoring, warfarin continues to be frequently prescribed because it is orally administered, inexpensive, and its effects are reversible.34 However, there are alternatives to warfarin for VTE prophylaxis following orthopedic surgery. Aspirin is more convenient, albeit less effective at preventing VTE.35,36
Newer anticoagulants are effective; however, many physicians are reluctant to prescribe them due to their cost and risk of postoperative hemorrhage.37,38 Warfarin also remains the treatment of choice in patients with kidney failure. Therefore, strategies that optimize the risks and benefits of warfarin therapy are important despite the availability of alternatives.
Widespread use of genotype-guided dosing will depend on reimbursement, regulations, and logistics. Although several commercial platforms for warfarin-related genes have been approved by the US FDA and the European Medicines Agency, routine genotyping is not yet recommended.39 The Centers for Medicare & Medicaid Services used its Coverage with Evidence Development program to fund genotyping in this trial and will review the results to determine future coverage.
Based on data reflecting clinical care at the time, a 2009 decision analysis projected that genotype-guided dosing would cost less than $50 000 per quality-adjusted life-year gained in the population with chronic atrial fibrillation if it were available by the second warfarin dose, cost less than $200, and had an RR for major bleeding events of less than 0.68.27 In this trial, the RR of 0.24 for major bleeding events (Table 3) had a wide 95% CI of 0.05 to 1.15, so the effect on major bleeding events is imprecise. In addition to incorporating more SNPs,40 future research could focus on integrating warfarin dosing algorithms into electronic medical records.
Conclusions
Among patients undergoing elective hip or knee arthroplasty and treated with perioperative warfarin, genotype-guided warfarin dosing, compared with clinically guided dosing, reduced the combined risk of major bleeding, INR of 4 or greater, venous thromboembolism, or death. Further research is needed to determine the cost-effectiveness of personalized warfarin dosing.
Trial protocol
eTable 1. Demographic and Clinical Characteristics of Randomized Participants
eTable 2. Number of Participants with Secondary Endpoints from Randomization until Post-op Day 30
eFigure. Kaplan-Meier Plot Showing the Time to a Therapeutic INR in Participants Randomized to Clinically Guided Dosing or Genotype-Guided Dosing
References
- 1.Shehab N, Lovegrove MC, Geller AI, et al. US emergency department visits for outpatient adverse drug events, 2013-2014. JAMA. 2016;316(20):2115-2125. [DOI] [PMC free article] [PubMed] [Google Scholar]
- 2.Budnitz DS, Lovegrove MC, Shehab N, Richards CL. Emergency hospitalizations for adverse drug events in older Americans. N Engl J Med. 2011;365(21):2002-2012. [DOI] [PubMed] [Google Scholar]
- 3.Rieder MJ, Reiner AP, Gage BF, et al. Effect of VKORC1 haplotypes on transcriptional regulation and warfarin dose. N Engl J Med. 2005;352(22):2285-2293. [DOI] [PubMed] [Google Scholar]
- 4.Klein TE, Altman RB, Eriksson N, et al. Estimation of the warfarin dose with clinical and pharmacogenetic data [published correction appears in N Engl J Med. 2009;361(16):1613]. N Engl J Med. 2009;360(8):753-764. [DOI] [PMC free article] [PubMed] [Google Scholar]
- 5.Coumadin package insert: 2016. https://www.accessdata.fda.gov/drugsatfda_docs/label/2016/009218s116lbl.pdf. Accessed February 2, 2017.
- 6.Stergiopoulos K, Brown DL. Genotype-guided vs clinical dosing of warfarin and its analogues. JAMA Intern Med. 2014;174(8):1330-1338. [DOI] [PubMed] [Google Scholar]
- 7.Kimmel SE, French B, Kasner SE, et al. A pharmacogenetic versus a clinical algorithm for warfarin dosing. N Engl J Med. 2013;369(24):2283-2293. [DOI] [PMC free article] [PubMed] [Google Scholar]
- 8.Verhoef TI, Ragia G, de Boer A, et al. A randomized trial of genotype-guided dosing of acenocoumarol and phenprocoumon. N Engl J Med. 2013;369(24):2304-2312. [DOI] [PubMed] [Google Scholar]
- 9.Pirmohamed M, Burnside G, Eriksson N, et al. A randomized trial of genotype-guided dosing of warfarin. N Engl J Med. 2013;369(24):2294-2303. [DOI] [PubMed] [Google Scholar]
- 10.Anderson JL, Horne BD, Stevens SM, et al. Randomized trial of genotype-guided versus standard warfarin dosing in patients initiating oral anticoagulation. Circulation. 2007;116(22):2563-2570. [DOI] [PubMed] [Google Scholar]
- 11.Huang SW, Chen HS, Wang XQ, et al. Validation of VKORC1 and CYP2C9 genotypes on interindividual warfarin maintenance dose. Pharmacogenet Genomics. 2009;19(3):226-234. [DOI] [PubMed] [Google Scholar]
- 12.Hillman MA, Wilke RA, Yale SH, et al. A prospective, randomized pilot trial of model-based warfarin dose initiation using CYP2C9 genotype and clinical data. Clin Med Res. 2005;3(3):137-145. [DOI] [PMC free article] [PubMed] [Google Scholar]
- 13.Wang M, Lang X, Cui S, et al. Clinical application of pharmacogenetic-based warfarin-dosing algorithm in patients of Han nationality after rheumatic valve replacement. Int J Med Sci. 2012;9(6):472-479. [DOI] [PMC free article] [PubMed] [Google Scholar]
- 14.McMillin GA, Melis R, Wilson A, et al. Gene-based warfarin dosing compared with standard of care practices in an orthopedic surgery population. Ther Drug Monit. 2010;32(3):338-345. [DOI] [PubMed] [Google Scholar]
- 15.Do EJ, Lenzini P, Eby CS, et al. Genetics Informatics Trial (GIFT) of Warfarin to Prevent Deep Vein Thrombosis (DVT). Pharmacogenomics J. 2012;12(5):417-424. [DOI] [PMC free article] [PubMed] [Google Scholar]
- 16.Gage BF, Eby C, Johnson JA, et al. Use of pharmacogenetic and clinical factors to predict the therapeutic dose of warfarin. Clin Pharmacol Ther. 2008;84(3):326-331. [DOI] [PMC free article] [PubMed] [Google Scholar]
- 17.Linder MW, Bon Homme M, Reynolds KK, et al. Interactive modeling for ongoing utility of pharmacogenetic diagnostic testing. Clin Chem. 2009;55(10):1861-1868. [DOI] [PMC free article] [PubMed] [Google Scholar]
- 18.Caldwell MD, Awad T, Johnson JA, et al. CYP4F2 genetic variant alters required warfarin dose. Blood. 2008;111(8):4106-4112. [DOI] [PMC free article] [PubMed] [Google Scholar]
- 19.Lenzini PA, Grice GR, Milligan PE, et al. Optimal initial dose adjustment of warfarin in orthopedic patients. Ann Pharmacother. 2007;41(11):1798-1804. [DOI] [PubMed] [Google Scholar]
- 20.Lenzini PA, Grice GR, Milligan PE, et al. Laboratory and clinical outcomes of pharmacogenetic vs clinical protocols for warfarin initiation in orthopedic patients. J Thromb Haemost. 2008;6(10):1655-1662. [DOI] [PMC free article] [PubMed] [Google Scholar]
- 21.Horne BD, Lenzini PA, Wadelius M, et al. Pharmacogenetic warfarin dose refinements remain significantly influenced by genetic factors after one week of therapy. Thromb Haemost. 2012;107(2):232-240. [DOI] [PMC free article] [PubMed] [Google Scholar]
- 22.McDonald MG, Rieder MJ, Nakano M, et al. CYP4F2 is a vitamin K1 oxidase. Mol Pharmacol. 2009;75(6):1337-1346. [DOI] [PMC free article] [PubMed] [Google Scholar]
- 23.Lane DA, Kamphuisen PW, Minini P, et al. Bleeding risk in patients with atrial fibrillation. Chest. 2011;140(1):146-155. [DOI] [PubMed] [Google Scholar]
- 24.Bousser MG, Bouthier J, Büller HR, et al. Comparison of idraparinux with vitamin K antagonists for prevention of thromboembolism in patients with atrial fibrillation [published correction appears in Lancet. 2008;372(9655):2022]. Lancet. 2008;371(9609):315-321. [DOI] [PubMed] [Google Scholar]
- 25.Rosendaal FR, Cannegieter SC, van der Meer FJ, Briët E. A method to determine the optimal intensity of oral anticoagulant therapy. Thromb Haemost. 1993;69(3):236-239. [PubMed] [Google Scholar]
- 26.Joo J, Geller NL, French B, et al. Prospective alpha allocation in the Clarification of Optimal Anticoagulation through Genetics (COAG) trial. Clin Trials. 2010;7(5):597-604. [DOI] [PMC free article] [PubMed] [Google Scholar]
- 27.Eckman MH, Rosand J, Greenberg SM, Gage BF. Cost-effectiveness of using pharmacogenetic information in warfarin dosing for patients with nonvalvular atrial fibrillation. Ann Intern Med. 2009;150(2):73-83. [DOI] [PubMed] [Google Scholar]
- 28.Epstein RS, Moyer TP, Aubert RE, et al. Warfarin genotyping reduces hospitalization rates results from the MM-WES. J Am Coll Cardiol. 2010;55(25):2804-2812. [DOI] [PubMed] [Google Scholar]
- 29.Newcombe RG. Interval estimation for the difference between independent proportions. Stat Med. 1998;17(8):873-890. [DOI] [PubMed] [Google Scholar]
- 30.Singh JA, Kwoh CK, Boudreau RM, et al. Hospital volume and surgical outcomes after elective hip/knee arthroplasty. Arthritis Rheum. 2011;63(8):2531-2539. [DOI] [PMC free article] [PubMed] [Google Scholar]
- 31.Cram P, Lu X, Kates SL, Singh JA, Li Y, Wolf BR. Total knee arthroplasty volume, utilization, and outcomes among Medicare beneficiaries, 1991-2010. JAMA. 2012;308(12):1227-1236. [DOI] [PMC free article] [PubMed] [Google Scholar]
- 32.Bader LA, Elewa H. The impact of genetic and non-genetic factors on warfarin dose prediction in MENA region. PLoS One. 2016;11(12):e0168732. [DOI] [PMC free article] [PubMed] [Google Scholar]
- 33.Johnson JA, Caudle KE, Gong L, et al. Clinical Pharmacogenetics Implementation Consortium (CPIC) guideline for pharmacogenetics-guided warfarin dosing. Clin Pharmacol Ther. 2017;102(3):397-404. [DOI] [PMC free article] [PubMed] [Google Scholar]
- 34.Pellegrini VD Jr. Prophylaxis against venous thromboembolism after total hip and knee arthroplasty [published online September 1, 2015]. JBJS Rev. doi: 10.2106/JBJS.RVW.N.00111. [DOI] [PubMed] [Google Scholar]
- 35.Intermountain Joint Replacement Center Writing Committee . A prospective comparison of warfarin to aspirin for thromboprophylaxis in total hip and total knee arthroplasty. J Arthroplasty. 2012;27(1):1-9.e2, e2. [DOI] [PubMed] [Google Scholar]
- 36.Pulmonary Embolism Prevention (PEP) Trial Collaborative Group . Prevention of pulmonary embolism and deep vein thrombosis with low dose aspirin. Lancet. 2000;355(9212):1295-1302. [PubMed] [Google Scholar]
- 37.Venker BT, Ganti BR, Lin H, et al. Safety and efficacy of new anticoagulants for the prevention of venous thromboembolism after hip and knee arthroplasty. J Arthroplasty. 2017;32(2):645-652. [DOI] [PMC free article] [PubMed] [Google Scholar]
- 38.Jensen CD, Steval A, Partington PF, et al. Return to theatre following total hip and knee replacement, before and after the introduction of rivaroxaban. J Bone Joint Surg Br. 2011;93(1):91-95. [DOI] [PubMed] [Google Scholar]
- 39.Holbrook A, Schulman S, Witt DM, et al. Evidence-based management of anticoagulant therapy. Chest. 2012;141(2)(suppl):e152S-e184S. [DOI] [PMC free article] [PubMed] [Google Scholar]
- 40.Perera MA, Cavallari LH, Limdi NA, et al. Genetic variants associated with warfarin dose in African-American individuals. Lancet. 2013;382(9894):790-796. [DOI] [PMC free article] [PubMed] [Google Scholar]
Associated Data
This section collects any data citations, data availability statements, or supplementary materials included in this article.
Supplementary Materials
Trial protocol
eTable 1. Demographic and Clinical Characteristics of Randomized Participants
eTable 2. Number of Participants with Secondary Endpoints from Randomization until Post-op Day 30
eFigure. Kaplan-Meier Plot Showing the Time to a Therapeutic INR in Participants Randomized to Clinically Guided Dosing or Genotype-Guided Dosing