

Summary
The metabolic pathways fueling tumor growth have been well characterized, but the specific impact of transforming events on network topology and enzyme essentiality remains poorly understood. To this end, we performed combinatorial CRISPR-Cas9 screens on a set of 51 carbohydrate metabolism genes that represent glycolysis and the pentose phosphate pathway. This high-throughput methodology enabled systems-level interrogation of metabolic gene dispensability, interactions, and compensation across multiple cell types. The metabolic impact of specific combinatorial knockouts were validated using 13C and 2H isotope tracing, and, these assays together revealed key nodes controlling redox homeostasis along the KEAP1-NRF2 signaling axis. Specifically, targeting KEAP1 in combination with oxidative PPP enzymes mitigated the deleterious effects of these knockouts on growth rates. These results demonstrate how our integrated framework, combining genetic, transcriptomic, and flux measurements, can improve elucidation of metabolic network alterations, and guide precision targeting of metabolic vulnerabilities based on tumor genetics.
eTOC Blurb
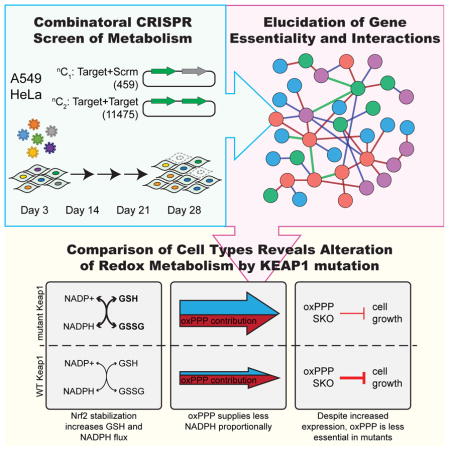
Zhao et al. used combinatorial CRISPR screening to elucidate gene essentiality and interactions in the cancer metabolic network. Examination of cell type-specific essentiality revealed a critical regulation of redox metabolism along KEAP1-NRF2 signaling axis.
Introduction
Cancer cells are characterized by unchecked cellular proliferation and the ability to move into distant cellular niches, requiring a rewiring of metabolism to increase biosynthesis and maintain redox homeostasis. This reprogramming of cellular metabolism is now considered an essential hallmark of tumorigenesis (Pavlova and Thompson, 2016). Since the metabolic network is highly redundant at the isozyme and pathway-levels, reprogramming is an emergent behavior of the network and manifests itself in non-obvious ways. For instance, a unique metabolic feature of tumor cells is a reliance on aerobic glycolysis to satisfy biosynthetic and ATP demands (Hensley et al., 2016). This metabolic rewiring is coordinated, in part, by the selective expression of distinct isozymes, which may benefit the cell by offering different kinetics or modes of regulation (Chaneton et al., 2012; Christofk et al., 2008; Patra et al., 2013). However, isozyme switching is not solely a consequence of genomic instability and instead can be a coordinated step in tumorigenesis that facilitates cancer cell growth and survival (Castaldo et al., 2000; Guzman et al., 2015). Therefore, understanding which isozymes and pathway branch points are important and how they interact with and compensate for one another is necessary to effectively target metabolism in cancer cells.
In this regard, the advent of CRISPR screening technology now provides a rapid, high-throughput means to functionally characterize large gene sets (Shalem et al., 2014; Wang et al., 2014). This analysis has led to greater annotation of essential genes in human cancers and context-dependent dispensability (Hart et al., 2015; Wang et al., 2015). Correspondingly, single-gene knockout (SKO) CRISPR screens have been able to identify important genes in redox homeostasis and oxidative phosphorylation in conjunction with metabolic perturbations (Arroyo et al., 2016; Birsoy et al., 2015). However, in the context of mammalian metabolism the SKO CRISPR approach comes with limitations, as redundancies and plasticity of the metabolic network may allow the system to remodel around a SKO, thereby confounding analyses of impact on cellular fitness. To overcome this challenge, our group and others recently developed combinatorial gene knockout screening approaches which may provide a more suitable platform to study gene dispensability and also systematically map their interactions (Boettcher et al., 2017; Chow et al., 2017; Han et al., 2017; Shen et al., 2017; Wong et al., 2016).
Utilizing this combinatorial CRISPR genetic screening format, coupled with interrogation of metabolic fluxes, we systematically studied the dispensability and interactions within a set of genes encoding enzymes involved in carbohydrate metabolism, including glycolysis and the pentose phosphate pathway. We illustrated functional relationships between dominant and minor isozymes in various families and discovered multiple genetic interactions within and across glucose catabolic pathways. Aldolase and enzymes in the oxidative pentose phosphate pathway (oxPPP) emerged as critical drivers of fitness in two cancer cell lines, HeLa and A549. Distinctions in this dependence are influenced by the KEAP1-NRF2 signaling axis, which coordinates the cellular antioxidant pathway in response to redox stress. We found loss or mutation of KEAP1 E3-ubiquitin ligase upregulates NRF2-mediated transcription of genes involved in glutathione synthesis and NADPH regeneration, making the oxPPP less important for NADPH production and less critical for cell growth in these contexts. Thus, mutation status of the KEAP1-NRF2 regulatory axis should be considered when designing therapeutic strategies that target redox pathways in cancer cells.
Results
Combinatorial CRISPR-Cas9 screening to probe metabolic networks
To systematically study the dispensability and interactions of genes underlying carbohydrate metabolism, we applied a combinatorial CRISPR screening approach (Shen et al., 2017) to interrogate singly and in combination a set of 51 genes, encompassing glycolysis, gluconeogenesis, pentose phosphate pathway, and glucose entry into the TCA cycle (Fig 1A). We generated 3 sgRNAs per gene such that 9 unique constructs were present for every gene-pair, resulting in a dual-sgRNA library consisting of 459 elements targeting genes individually, as well as 11,475 unique elements targeting two different genes simultaneously (Table S1). The dual-sgRNA constructs were synthesized from oligonucleotide arrays, cloned into a lentiviral vector, and then transduced into HeLa or A549 cells stably expressing Cas9 (Fig 1B and S1A and B). Through sampling of sgRNA frequencies at days 3, 14, 21, and 28 (Fig S1C and D), both robust gene-level fitness values (fg)) and also interaction scores (πgg) were computed. Finally, impact of SKOs and dual-gene knockouts (DKOs) on cellular growth and metabolic fluxes were validated in a targeted fashion.
Figure 1. Experimental design.

(A) Schematic pathway diagram of carbohydrate metabolism, and list of 51 targeted enzymes. (B) Schematic overview of the combinatorial CRISPR-Cas9 screening approach. A dual-gRNA library in which each element targets either gene-gene pairs or gene-scramble pairs, to assay dual and single gene perturbations, was constructed from array-based oligonucleotide pools. Competitive growth based screens were performed, and the relative abundance of dual-gRNAs were sampled over multiple time points. The fitness and genetic interactions were computed via a numerical Bayes model and key hits were validated using both competitive cell growth assays and measurement of metabolic fluxes. See also Figure S1 and Table S1.
Mapping metabolic gene dependencies in glucose catabolism
Upon analyzing fitness scores for individual gene knockouts across the metabolic network (Table S2), we noted that for most (but not all) isozyme families, a dominant gene showed the greatest indispensability (Fig 2A and S2A). Consistent with the notion of a “cancer-specific” isozyme (Hay, 2016), HK2, ALDOA, PGK1, and PFKL all showed a fitness defect greater than two-fold higher as compared to other isozymes. However not all families exemplified this dynamic, with ENO1/ENO3 and the lactate dehydrogenase (LDH) family showing similar dispensability across gene members (Fig 2A and S2A). The general dispensability of SKOs within the LDH family is notable given the critical role of glycolysis in the maintenance of cancer cell homeostasis and concomitant need to regenerate cytosolic NAD+ when relying on glycolytic flux (Vander Heiden et al., 2009). Importantly nodes central to the regeneration of reducing equivalents (NADH and NADPH) – GAPDH, G6PD, and PGD – were found to be critical for cellular growth (Fig 2A and S2A).
Figure 2. Combinatorial CRISPR screens reveal metabolic network dependencies.

(A) SKO fitness scores for HeLa cells, plotted as fg (day−1), with a more negative score representing a loss in fitness with SKO. Plotted as mean ± SD. (B) Multi-isoform family member fitness scores and gene expression for HeLa (top) and A549 (bottom) cells. (C) Relative comparison of SKO fitness scores (fg) across both cells. (D) Relative comparison of genetic interaction scores (πgg) across both cell lines. (E) Combined genetic interaction map of both cell lines. Green solid line represents interactions observed in both cell lines. Red and blue lines represent significant genetic interactions in A549 and HeLa cells respectively. See also Figure S2 and Table S2–S4.
We hypothesized that gene expression could explain why certain genes were less dispensable and why certain families did not display a dominant member. Indeed, lower fitness score may be associated with higher gene expression (R = −0.461, p-value = 6.7e-04 and R = −0.429, p-value = 1.7e-03, for HeLa and A549 cells respectively). These expression-driven differences also partially explained dynamics within isozyme families. For instance, ALDOA had a much lower fitness score and higher gene expression as compared to ALDOB and ALDOC (Fig 2B). ENO1 and ENO3 both displayed negative fitness scores and both were more highly expressed than ENO2 (Fig 2B and C). However, the dispensable isozyme families LDH and PDH (key for maintenance of glycolytic flux and oxidation of pyruvate respectively) were also found to be highly expressed in both cell types (Fig 2B and C). With each family having more than two member enzymes, this result demonstrates that vital functions of cell metabolism can be carried out by multiple genes and show surprising resiliency through isozyme compensation or network behavior.
To this end, SKO knockouts correlated well (R = 0.718, p-value = 3.1e-09) across both cell lines (Fig 2C). This correlation extended to expression of all enzymes (R = 0.938, p-value < 2.2e-16). Furthermore, HeLa fitness scores correlated well with previously published HeLa screening data (R = 0.664, p-value = 1.435e-07) (Hart et al., 2015). However, these results exemplify the challenge in understanding metabolic topology through screening individual genes: few metabolic genes are essential, and essential elements are typically conserved across all cell types.
We subsequently hypothesized that gene interactions could provide information on metabolic network topology and cell-specific adaptations in these pathways. Indeed, a notable number of gene pairs were found to significantly interact (Fig 2D and E, Table S3). Specifically, after filtering for genes with RPKM<0.15, we observed 35 interactions (z-score < −3) in the combined HeLa and A549 interaction network (Fig S2B and Table S4), of which 10 (~30%) have been previously reported as protein-protein interactions (Stark et al., 2006). Five gene pair interactions were shared across both cell types.
Notably, the conserved interaction of ENO1/ENO3 demonstrates the possible compensation observed in SKO results (Fig 2A). Previous results have demonstrated that passenger deletion of ENO1 in glioblastoma (GBM) cell lines increases their dependence on ENO2 and generates a GBM synthetic lethality (Muller et al., 2012). As ENO2 is only expressed in neural tissues, our results suggest that ENO1 and ENO3 may compensate for one another in these cell lines. Additionally, redox-associated genes, GAPDH and PGD, had many interacting partners, consistent with their negative SKO fitness scores and metabolic functions (Fig 2E). As NAD(P)H is required for both bioenergetics and biosynthetic reactions, alteration of cofactor balance or regeneration fluxes could have large impacts on distal reactions within the network.
Validation of significant SKO and DKO results on cellular fitness and metabolic fluxes
Next, to functionally validate the screening results, competition assays and metabolic flux measurements were conducted in the presence of SKO and DKO pairs. Competition assays were performed by mixing control tdTomato+ cells expressing an empty vector, with tdTomato− cells expressing a gRNA of interest (Fig 3A), and relative growth rates were assayed by quantifying the ratio of +/− cells in the mixture via flow cytometry (Fig 3B). Dominant family member isozyme fitness was observed in the ALDO family (Fig 3C), and significant gene interactions over additive SKO effects were observed in multiple gene pairs (Fig 3D and E). Correspondingly, perturbations in glycolytic flux were observed through dynamic labeling of metabolites (i.e. pyruvate, lactate, alanine) from 13C-labeled glucose ([U-13C6]glucose) (Fig 3F). Notably, DKO of ENO1 and ENO3 significantly decreased flux through glycolysis compared to control and SKOs (Fig 3G, S3A, and S3B) and also displayed significantly lower fitness (Fig 3H). Finally, we applied specific 13C and 2H tracers to quantify how the oxPPP contributed to NADPH regeneration (Fig 3I) (Lee et al., 1998; Lewis et al., 2014). SKO knockout of oxPPP enzymes was indeed observed to lower flux (Fig 3J and K) and fitness (Fig 3L and S3C) through this pathway.
Figure 3. Screening results validated through targeted fitness and metabolic flux measurements.

(A) Schematic of cell competition assay used to validate growth. A Cas9-expressing cell is transduced with a sgRNA lentivirus of interest (tdTomato−) and mixed with a control Cas9-expressing cell transduced with a tdTomato lentivirus (tdTomato+). The cells are grown together and the percentage of control (tdTomato+) cells is used to assess relative fitness of SKO. (B) Non-targeting control (top) is stable for duration of experiment and shows no fitness changes. SKO of ALDOA (bottom) shows decreased fitness over time as control cells take over population. (C) SKO competition assay of ALDO isozyme family. ALDOA shows greatest loss of fitness. (D) Growth validation of PFKM/PGD genetic interaction. DKO (green) shows significantly greater decrease in fitness over additive SKO effect (black). (E) Growth validation of ALDOA/GAPDH interaction. (F) Atom transition map depicting glycolysis. Fully labeled ([U-13C6]glucose) leads to fully labeled pyruvate, lactate, and alanine. (G) Metabolic validation of DKO interaction in ENO1/ENO3. DKO significantly lowered flux through glycolysis over control or SKOs. † indicates statistical significance (p<0.05) for all conditions as compared to DKO (H) Growth validation of ENO1/ENO3 interaction. (I) Atom transition map depicting oxPPP tracing. [3-2H]glucose labels cytosolic NADPH through oxPPP. Labeling on glycolytic intermediates from [1,2-13C]glucose is changed by shunting of glucose through oxPPP. (J) Metabolic validation of PGD SKO at day 4. oxPPP contributes less NADPH with PGD knockout. Plotted as mean ± 95% CI. * indicates statistical significance by non-overlapping confidence intervals. (K) Metabolic validation of G6PD SKO at day 7. Less glucose is shunted through oxPPP with G6PD knockout. (L) SKO competition assay of oxPPP enzymes. All experiments were performed in HeLa cells. (C–E, G–H, K–L) Data plotted as mean ± SEM. See also Figure S3.
Comparison of metabolic liabilities across cell lines reveals key role of KEAP1-NRF2
We next focused on differences in the screens of these two cell lines to explore how oncogenic status contributes to metabolic reprogramming. By conducting screens in A549 and HeLa cells and comparing fitness results, we could also gain insights into the impact of SKO results in combination with endogenous mutations. Notably, screening results suggested and we validated that SKO of oxPPP genes (i.e., G6PD and PGD) impacted the growth and survival of HeLa cells more dramatically than A549 cells (Fig 4A, S4A, and S3C) with observed editing rates in each cell line ≥95% (Fig S3D). Intriguingly, the expression of G6PD and PGD in these cell lines showed the opposite trend, with A549 cells expressing these genes at significantly higher levels but having a lower dependence on them to maintain growth and viability (Fig 4A and S4A). As the oxPPP is critical for maintaining redox homeostasis (i.e. NAPDH regeneration) (Kuehne et al., 2015), mutations within control points of redox metabolism could drive this differential sensitivity and further extend the interactions of metabolic genes to known oncogenes or tumor suppressors.
Figure 4. KEAP1 mutational status alters redox metabolism and impact of oxPPP gene knockouts on cellular fitness.

(A) Plot of cell-specific fitness scores for expressed genes. Positive scores are SKOs that are essential in A549s and negative scores are SKOs more essential in HeLa cells. The cell-specific essentiality scores respond to the z-score transformed residuals of linear regression of HeLa and A549 SKO fitness, shown in Figure S4A. (B) Immunoblot of KEAP1 SKO in HeLa cells. (C) Contribution of oxPPP to cytosolic NADPH with KEAP1 SKO in HeLa cells. Plotted as mean ± 95% CI. * indicates statistical significance by non-overlapping confidence intervals. (D) Relative PGD SKO effect in A549s with KEAP1 mutant panel. (E) Contribution of oxPPP to cytosolic NADPH in A549s with KEAP1 mutant panel. Plotted as mean ± 95% CI. * indicates statistical significance by non-overlapping confidence intervals. (F) Immunoblot of A549s with KEAP1 mutant panel. (G) Normalized relative gene expression of A549s with KEAP1 mutant panel. (H) Glutathione measurement in A549 with KEAP1 mutant panel (n=5). (I) Schematic of how KEAP1 mutational status alters relative metabolism and oxPPP dispensability. (D, G, H) Data plotted as mean ± SEM. See also Figure S4.
In this regard, A549 NSCLC cells harbor a loss of function mutation in KEAP1 while this regulatory axis is functional in HeLa cells. Loss of function mutation of KEAP1 is observed in 20–50% of non-small-cell lung cancers (NSCLCs) (Singh et al., 2006). KEAP1 is a redox-sensitive E3 ubiquitin ligase that targets oxidized NRF2, the master transcriptional regulator of the cellular antioxidant response (DeNicola et al., 2011; Ishii et al., 2000; Thimmulappa et al., 2002) and previous work has demonstrated an ability of NRF2 to alter metabolic fluxes (DeNicola et al., 2015; Mitsuishi et al., 2012; Thimmulappa et al., 2006). Consequently, we hypothesized that the mutational status of this pathway potentially influenced oxPPP sensitivity.
Knockout of KEAP1 in HeLa cells significantly increased NRF2 levels and expression of oxPPP enzymes G6PD and PGD (Fig S3E and 4B) consistent with the increased expression levels observed in A549 cells (KEAP1-deficient) relative to HeLa cells (KEAP1 WT) (Fig S4A, bottom left). We next determined how oxPPP flux contributed to cytosolic NADPH pools using [3-2H]glucose in KEAP1 KO cells (Lewis et al., 2014). For all sgRNAs we observed a significant decrease in labeling (Fig 4C), which indicates higher pathway flux and loss of label via glutathione-mediated H-D exchange (Zhang et al., 2017). This enhanced glutathione buffering capacity is consistent with the greater dispensability of oxPPP enzymes observed in A549 cells as compared to HeLa cells (Fig 4A).
We next hypothesized that KEAP1 mutational status could directly alter sensitivity to SKO of oxPPP enzymes and quantified the impact of such SKOs on the fitness and metabolism of an isogenic panel of A549 cells. Ectopic expression of wild type (WT) KEAP1 decreased NRF2 stabilization as compared to constitutively active C273S mutant KEAP1 (Zhang and Hannink, 2003) (Fig S4B). Interestingly, overexpression of either mutant or WT KEAP1 increased NRF2 levels as compared to parental cells (Fig S4B). Re-expression of WT KEAP1 in A549 cells increased cell sensitivity to PGD knockout as compared to C273S KEAP1 mutant cells (Fig 4D, S4C), highlighting the role of KEAP1 in regulating oxPPP enzyme expression and flux. Consistent with these fitness results and the above metabolic measurements, WT KEAP1 expression increased the contribution of PGD to cytosolic NADPH regeneration (Fig 4E) and decreased expression of oxPPP enzymes (Fig 4F).
Finally, we hypothesized that KEAP1 remodels redox metabolism due to its canonical role in the cellular antioxidant response. Indeed, expression of WT KEAP1 was found to both decrease expression of NADPH-regenerating enzymes and those involved in glutathione (GSH) synthesis (Fig 4G). Consistent with decreased expression of GSH synthesis enzymes, intracellular glutathione levels were decreased by 45% upon expression of WT KEAP1 (Fig 4H). Presumably, the decreased buffering capacity by GSH and lower expression of other NADPH regenerating contributes to the increased dependence on oxPPP flux observed in cells expressing WT KEAP1. A model therefore emerges from our screening results, whereby KEAP1 mutational status alters the relative importance of the oxPPP by modulating expression of the redox network to drive GSH synthesis and regeneration (Fig 4I).
Discussion
While it is clear that cancer cells rely on aerobic glycolysis to maintain biosynthetic fluxes and ATP demands (Hsu and Sabatini, 2008), how the underlying metabolic network topology changes in response to specific oncogenic events is not fully clear. In this study, we comprehensively interrogated metabolic gene dispensability, interaction, and compensation through a combinatorial CRISPR-Cas9 screening approach. Key nodes within glycolysis were found to significantly interact with one another (e.g. ALDOA and PGD) in an emergent network behavior. Many of these interactions were conserved across cells of different origin, implying such enzyme interaction pairs harbor some function that warrant future interrogation.
Other interactions were demonstrative of metabolic compensation within isozyme families (e.g. ENO1 and ENO3) and consistent with previously described mechanisms of metabolic synthetic lethality (Dey et al., 2017; Muller et al., 2012). These observed network features present a new opportunity through combinatorial (pairwise) screening to understand if/how cells can adapt around loss of a metabolic enzyme. Knowing if a solid tumor of interest is pharmacologically vulnerable to a metabolic inhibitor a priori will allow for future precision medicine applications.
In fact, by comparing relative SKO scores across cell types, we were able to elucidate a paradoxical resistance to targeting the oxPPP along the KEAP1-NRF2 axis. Even though cells potently upregulated expression of oxPPP enzymes upon loss of KEAP1, cells were less vulnerable to KO of enzymes in this metabolic pathway. In this case, alternate NADPH regeneration pathways and increased antioxidant buffering by GSH pools provides compensation and survival benefits to cells. Our NAPDH tracing data demonstrated that cells lacking functional KEAP1 exhibit higher oxPPP flux, as evidenced by reduced labeling due to increased H-D exchange through glutathione-related pathways (Zhang et al., 2017). Indeed, elevated oxPPP enzyme levels and increased glutathione pools would specifically increase exchange flux, resulting in the observed decrease in labeling downstream of [3-2H]glucose. The integration of such functional measurements with genetic screening and transcriptional results provides better context to interpret the observed metabolic reprogramming downstream of KEAP1-NRF2.
Our results suggest that KEAP1 mutational status must be considered when targeting the oxPPP therapeutically. In fact, recent work has implicated KEAP1 mutational status as a driver of metabolic reprograming and potential targeting of glutaminase in pre-clinical models of lung adenocarcinoma (Romero et al., 2017). Consistent with our findings, KEAP1 mutation increases intracellular glutathione levels and need for cysteine, causing an increased need for glutamine anaplerosis to support glutamate/cysteine antiporter flux (SLC7A11) (Muir et al., 2017; Romero et al., 2017). Other recent work has also implicated KEAP1 mutational status as a driver of chemotherapeutic resistance in preclinical models of lung cancer and further demonstrates the need for new paradigms connecting oncogenic mutations to cancer cell survival (Krall et al., 2017).
Moving forward, it will be important to perform such screens across a larger number of cell types to elucidate a more comprehensive picture of metabolic network reprogramming. The high throughput methodology presented here increases the feasibility of such studies. We note also that comparing the absolute fitness values in screens across cell lines can be confounded by various factors. These include differences in relative cell growth and expression of CRISPR effectors among others, and thus devising new strategies for normalization will be valuable to improve the utility of future screening data sets. We also note the critical importance of sgRNA efficacy, and anticipate that continued improvements in sgRNA design (Chari et al., 2015; Doench et al., 2016; Erard et al., 2017) will be critical to improving consistency and signal-to-noise in the assays. Finally, layering in data from complementary perturbation strategies such as CRISPR activation/inhibition and small molecule inhibition should enable charting of more comprehensive networks underlying cellular function and transformation.
Discovery of the unique metabolic features in transformed cells has spurred much interest in exploiting metabolic vulnerabilities for drug discovery (Vander Heiden, 2011). In fact, metabolic inhibitors have been developed as single agent therapeutics and combination therapeutics for many different cancer types (Tennant et al., 2010). However, these agents have found varying success in the clinic due an inability to determine proper cancer types in preclinical development. While cancer cells share common hallmarks of ming, cell-of-origin and tumorigenic drivers uniquely influence the direction and extent of metabolic reprogramming. The new paradigm of incorporating combinatorial CRISPR screening, transcriptomic information, and metabolic flux measurements presented here will provide a new platform to address this limitation. By interrogating metabolism at the network-level, new therapeutic targets may be identified, and clinicians may become better equipped at identifying the most responsive patient populations.
STAR Methods
CONTACT FOR REAGENT AND RESOURCE SHARING
Further information and requests for resources and reagents should be directed to and will be fulfilled by the Lead Contact, Prashant Mali (pmali@ucsd.edu)
EXPERIMENTAL MODEL AND SUBJECT DETAILS
Cell Lines and Culture Conditions
HEK293T, A549, HeLa-AAVS-Cas9-Hygro, A549-AAVS-Cas9-Hygro cells were grown in DMEM supplemented with 10% FBS, 2 mM L-glutamine, 100 units/mL of penicillin, 100 μg/mL of streptomycin, and 0.25 μg/mL of Amphotericin B. HeLa-AAVS-Cas9-Hygro and A549-AAVS-Cas9-Hygro cells were purchased from GeneCopoeia.
METHOD DETAILS
Dual-gRNA library design and cloning
A set of 51 genes, encompassing glycolysis, gluconeogenesis, pentose phosphate pathway, and glucose entry into the TCA cycle were selected for this study. Three unique 20-bp sgRNAs were designed for each target gene and three scrambled, non-targeting sequence absent from the genome were used as control. The dual sgRNA construct library comprised all pairwise gRNA combinations between either two genes or a gene and a scramble, resulting in 11,475 double-gene-knockout constructs and 459 single-gene-knockout constructs. The dual-gRNA library was generated as previously described (Fig S1A) (Shen et al., 2017). Briefly, the oligonucleotides with dual-gRNA spacers were synthesized by CustomArray Inc., amplified and assembled into the LentiGuide-Puro vector (Addgene #52963). Independent bacterial clones obtained in step I library were counted to ensure ~50× library coverage. Subsequently, the step I library was digested by BsmBI and an insert contained a gRNA scaffold and a mouse U6 promoter were cloned in the middle of two spacers. Again, ~50× library coverage was ensured.
Lentivirus production
One 15cm dish of HEK293T cells at 60% confluent were transfected with 3 μg PMD2.G, 12 μg of lenti-gag/pol/PCMVR8.2, and 9 μg of lentiviral vector (library or single constructs) using 36 μl of Lipofectamine 2000. Medium containing viral particles were harvested 48 h and 72 h after transfection, then concentrated with Centricon Plus-20 100,000 NMWL centrifugal ultrafilters, divided into aliquots and frozen at −80 °C.
CRISPR/Cas9 dual-gRNA screening
CRISPR Cas9 nuclease stable expressing HeLa and A549 cells were obtained from GeneCopoeia and grown in DMEM medium with 10% FBS and Antibiotic-Antimycotic. Hygromycin B was added at the concentrations of 200 μg/ml or 100 μg/ml for HeLa and A549 cells, respectively. For each screen, cells were seeded in three 15cm dishes at a density of 1 × 10^7 per ml and transduced with the lentiviral dual gRNA library at a low MOI of 0.1–0.3. Puromycin was added at 48 h after transduction at a concentration of 5 μg/ml. Then the cells were cultured and passaged for every 3–4 days while 1 × 10^7 cells were sampled at days 3, 14, 21 and 28 and stored at −80 °C until extraction of genomic DNA. Two biological replicates of the screens were performed for each cell line.
Quantification of dual gRNAs abundance
Genomic DNA of the cells were purified using Qiagen DNeasy Blood and Tissue Kits. To amplify the dual gRNAs from each sample, we used 20 μg of genomic DNA as template across ten 50-μL PCR reactions with Kapa Hifi polymerase. By testing the amplification efficiency, we used 22 – 24 cycles at an annealing temperature of 55 °C with the following primers:
Forward: ACACTCTTTCCCTACACGACGCTCTTCCGATCTTATATATCTTGTGGAAAGGACGAAACACC G;
Reverse: GACTGGAGTTCAGACGTGTGCTCTTCCGATCTCCTTATTTTAACTTGCTATTTCTAGCTCTA.
The amplicons were pooled and purified with Agencourt AMPure XP bead at a double selection of 0.55× and then 0.8×. The samples were quantified with Qubit dsDNA High Sensitivity Kit. To attach Illumina sequencing adaptors and indexes, we used 50 ng of purified step I PCR product as template across four 50-μL PCR reactions with Kapa Hifi polymerase using primers of Next Multiplex Oligos for Illumina (New England Biosciences). 7 or 8 PCR cycles were carried out at an annealing temperature of 72 °C. The PCR product were purified twice with Agencourt AMPure XP bead at 0.8× ratio, quantified, pooled and sequenced on an Illumina HiSeq rapid-run mode for 75 cycles paired-end runs.
Computation of single and double gene knockout fitness and genetic interaction scores
Analysis was performed with a previously reported software pipeline constructed from Python, R and Jupyter Notebooks (https://github.com/ucsd-ccbb/mali-dual-crispr-pipeline). The following details are adapted from our published paper (Shen et al., 2017). Briefly, the two gRNA sequences were extracted and trimmed to 19bp from 3′ end, and then aligned to the known library sequences with one mismatch allowed. We determined a minimum threshold for read counts based on the histograms and masked out pairwise gRNA constructs that have read counts below the threshold. The read counts were used for analysis of fitness and genetic interaction scores as follows:
(1) Estimation of fitness of each pairwise gRNA construct
The logarithmic transformation of the frequency of each pairwise gRNA construct in the population is:
where Nc is the number of cells in the population expressing construct c. We assume that each cell subpopulation grows exponentially:
where t is a given time point; fc is the fitness of construct c; f0 is the absolute fitness of reference cells which don’t express any constructs. Combining these two equations, we get:
where ac ≡ xc(0) as the initial condition and Σc2xc = 1 in the whole population. Fitting to this equation from experimental data of frequencies Xc(t), we minimize the sum of squares:
Here E is invariant under the substitution fc → fc + δ, where δ is an arbitrary constant, which can be fixed by setting the mean non-targeting gRNA fitness to zero. To resolve this, one should find the minimum of the function:
where λ is the Lagrange multiplier. This solution equals:
When the number of constructs is large, Σc 1 ≫ 1, the approximation solution is:
and
where the bars indicate means over time points. The ac values do not depend on the choice of δ.
(2) Estimation of single gRNA fitness and gRNA–gRNA interactions
For each construct containing gRNAs and g and g′, we define:
where πgg′ is the gRNA-gRNA interaction scores. fc is calculated from step (1). fg values are found by robust fitting of this equation. The gRNA-level πgg′ scores are the residuals of the robust fit.
(3) Computation of gene level fitness based on weighted average of gRNA fitness
We ranked the three gRNAs targeting to the same gene as r(g) ∈ {0, 1, 2} in ascending order of |fg|. The gene-level fitness values are calculated as the weighted means of gRNA fitness values with weights given by the squares of gRNA ranks, r2(g). The gene-level interaction scores are calculated as the weighted means of gRNA-gRNA interaction scores with weights given by the products of gRNA ranks, r(g)r(g′).
(4) Correction by replicates
As we performed biological replicates for each experiment, we combine replicates for more power rather than looking for two fc separately. We fit a single optimal fc from all data points excludes those below the threshold, with the assumption that fc does not change across experiments while the initial conditions ac may be different. The raw P value associate to each fc is:
where SE(fc)is the standard error of fc:
The raw P values then are transformed into posterior probabilities, PPc, according to the theory of Storey. To scale the genetic interaction scores for comparison across different experiments, we calculated a genetic interaction z score by dividing the πgg′ of each two genes by of genetic interaction pairs in a given experiment. We consider an interaction to be a meaningful candidate if it has an absolute z score above 3.
(5) Calculation of false discovery rates by numerical Bayesian ensemble of experiments
We assign a fitness value to each construct c on the basis of change in fitness relative to the standard deviation of repeated measurements. The assigned value is either 0 with probability (1 − PPc), or a random number within f̄c ± s.d. We perform 1000 permutations and reported gene level fg and πgg′ for each permutation. The false discovery rate (FDR) of genetic interactions (π) is calculated as the odds ratio between the observed and permuted results in the null model, which is obtained by mean-centering of the marginal distribution of every πgg′.
Single-gRNA construct cloning
The LentiGuide-Puro vector were linearized using restriction enzyme BsmBI at 55 °C for 3 hours. For each individual gRNA, two oligonucleotides containing the spacer sequences were synthesized as listed in Supplemental Table S1. The two oligos were annealed and extended to make a double stranded DNA fragment using Kapa Hifi polymerase. The fragment was purified and subjected to Gibson assembly (New England Biolabs) with the linearized LentiGuide-Puro vector.
Competitive cell growth assay
We developed a competitive cell growth assay to assess the effect of gene perturbations by mixing control tdTomato+ cells with tdTomato− cells expressing a gRNA of interest (Fig 3A) and sampling relative growth rates through time by flow cytometry. Cas9-expressing cells were transduced with EF1A- tdTomato-T2A-puromycin lentivirus and cultured under puromycin selection for stable expression of tdTomato. To measure the negative impact of a gRNA introduced gene perturbation on the cellular proliferation rate, the Cas9-expressing cells were cultured in 12-well-plate and transduced with gRNA lentivirus at a high MOI (>5). The day after transduction, the Cas9-expressing cells were resuspended, counted, mixed with tdTomato+ Cas9-expressing cells, and re-seed into 12-well-plate. The cells were sampled every 3 or 4 days to score the tdTomato+/tdTomato− ratio by longitudinal flow cytometric analysis. By assuming the exponential growth of the cells, from time t1 to t2, the growth of cells (tdTomato+ or gRNA expressing) in the mixture population fits to the equation:
where Nc is the cell number of the certain cell subtype, f0 is the absolute fitness of reference cells which in this case is the tdTomato+ cells, and Δfc is fitness measurements of the certain cell subtype. For a certain gRNA (or a pair of gRNA), ΔfgRNA the is able to be calculated easilyaccording to the equation without measuring the absolutely fitness of reference cells f0:
Although the percentage of tdTomato+ cells in the mixtures with the cells expressing non-targeting control gRNAs was stable over time, we normalize the fitness of gRNA of interest to non-targeting control gRNAs for side by side comparisons. The cell viability of a gRNA of interest (non-log transformed fitness) relative to non-targeting controls showed in Fig 3 is as follows:
The expected cell viability of a pair of gRNAs calculated according to:
In addition, f0 is able to be measured by counting of the absolute cell number over time base on the equation (1). Then the effects of a gene perturbation (eg. PGD) relative to non-targeting controls (NTC) in a certain cell subtype (eg. KEAP1 mutations) are calculable as follows:
RNA sequencing data analysis
RNA sequencing data were obtained from the ENCODE project (GSE30567, sample GSM765402 and GSM758564 for HeLa and A549 cell lines respectively). The results were expressed as the average value of reads per kilobase of transcript per million mapped reads (RPKM) across two biological replicates. The average RPKM values were log2 transformed for Pearson correlation analysis.
Stable isotope tracing
For isotopic labeling experiments, cells were cultured in glucose- and glutamine-free media (Gibco) supplemented with 10% dialyzed FBS, 100 U/mL penicillin/streptomycin, 4mM glutamine (Sigma), and 20 mM of either [3-2H]glucose (98%, Cambridge Isotope Laboratories), [U-13C6]glucose (99%, Cambridge Isotope Laboratories), or [1,2-13C]glucose (99%, Cambridge Isotope Laboratories).
Cells were rinsed with PBS before addition of tracing media. For glycolytic measurements, basal media was changed 1hr before addition of tracer media and extracted at indicated time intervals. For measurement of shunting through oxPPP, cells were traced for 4hrs. For estimation of PGD contribution to cytosolic NADPH, cells were traced for 48hrs.
Metabolite Extraction and GC-MS Analysis
Cells were rinsed with 0.9% (w/v) saline and 250 μL of −80°C MeOH was added to quench metabolic reactions. 100 μL of ice-cold water supplemented with 10 μg/mL norvaline was then added to each well and cells were collected by scraping. The lysate was moved to a fresh 1.5 mL eppendorf tube and 250 μL of −20°C chloroform supplemented with 4 μg/mL D31 palmitate was added. After vortexing and centrifugation, the top aqueous layer and bottom organic layer were collected and dried under airflow.
Derivatization of aqueous metabolites was performed using the Gerstel MultiPurpose Sampler (MPS 2XL). Methoxime-tBDMS derivatives were formed by addition of 15 μL 2% (w/v) methoxylamine hydrochloride (MP Biomedicals) in pyridine and incubated at 45°C for 60 minutes. Samples were then silylated by addition of 15 μL of N-tert-butyldimethylsily-N-methyltrifluoroacetamide (MTBSTFA) with 1% tert-butyldimethylchlorosilane (tBDMS) (Regis Technologies) and incubated at 45°C for 30 minutes. Aqueous metabolites were analyzed by GC-MS using a DB-35MS column (30m × 0.25mm i.d. × 0.25μm, Agilent J&W Scientific, Santa Clara, CA) in an Agilent 7890B gas chromatograph (GC) interfaced with a 5977C mass spectrometer (MS). Electron impact ionization was performed with the MS scanning over the range of 100–650 m/z for polar metabolites. For separation of aqueous metabolites the GC oven was held at 100°C for 1 min after injection, increa sed to 255°C at 3.5°C/min, and finally increased to 320°C at 15°C/min and held for 3 min.
Dried organic fraction was saponified and esterified to form fatty acid methyl esters (FAMEs) by addition of 500 μL of 2% (w/v) H2SO4 in MeOH and incubated at 50°C for 120 minutes. FAM Es were then extracted by addition of saturated NaCl and hexane before collection and drying of the inorganic layer. Derivatized fatty acids were analyzed by GC-MS using a select FAME column (100m × 0.25mm i.d. × 0.25μm; Agilent J&W Scientific) as above, with the MS scanning over the range 120–400 m/z. For separation the GC oven was held at 80°C for 1 min after injection, increased to 160°C at 20°C/min, increase d to 198°C at 1°C/min, and finally increased to 250°C at 5°C/min and held for 15 min.
Metabolite integration and isotopomer spectral analysis (ISA)
Mass isotopomer distributions and total abundances were determined by integration of mass fragments (Supplemental Table S1) and correcting for natural abundances using MATLAB-based algorithm. Glycolytic flux was estimated by normalizing pyruvate, lactate, or alanine abundance by the sum of intracellular branched-chain amino acids abundance and M+3 label. Oxidative PPP shunting was estimated by labeling on pyruvate from [1,2-13C]glucose (Lee et al., 1998). Isotopomer spectral analysis (ISA) was performed to estimate contribution of oxPPP to cytosolic NADPH as previously described (Lewis et al., 2014). ISA compares experimental labeling of fatty acids to simulated labeling using a reaction network where C16:0 is condensation of 14 NADPHs. Parameters for contribution of PGD to lipogenic NADPH (D value) and percentage of newly synthesized fatty acid (g(t) value) and their 95% confidence intervals are then calculated using best-fit model from INCA MFA software (Young, 2014).
Immunoblotting
Cultured cells were washed with cold PBS and harvested on ice with mPER (Pierce Biotechnology) with freshly added 1x HALT inhibitor (Thermo Fisher Scientific). Protein concentration was determined by BCA assay and equal amounts of protein were resolved on SDS-PAGE gel and transferred to nitrocellulose membrane. Membrane was blocked with 5% milk in TBST (Tris-buffered saline with 0.1% Tween 20) for 2–3hrs and incubated overnight at 4C with primary antibody: anti-Vinculin (Abcam), anti-G6PD (Cell Signaling Technologies), anti-PGD (Santa Cruz Biotechnology), anti-KEAP1 (Proteintech), anti-HA (Abcam), or anti-Nrf2 (Cell Signaling Technology). Blots were then incubated with secondary antibody for 1hr at room temp, Anti-Rabbit HRP-conjugate (Cell Signaling Technology) or Anti-Mouse HRP-conjugate (Cell Signaling Technology). Finally blots were incubated with ECL substrate (BioRad) and imaged.
RT-PCR
Total mRNA was isolated from cells using RNA isolation kit (RNeasy Mini Kit; Qiagen). Isolated RNA was reverse transcribed using cDNA synthesis kit (High-capacity cDNA Reverse Transcription Kit; Thermo Fisher Scientific). Real-time PCR was performed using SYBR green reagent (iTaq Universeal SYBR Green Supermix; Bio-Rad). Relative expression was determined using Livak (ΔΔCT) method with RPL27 and RPLP0 as housekeeping gene. Primers used were taken from Primerbank (Wang et al., 2012) and tabulated in Supplemental Table S1. All commercial kits were used per the manufacturer’s protocol.
Glutathione measurement
Intracellular glutathione was measure using Glutathione Assay Kit (Sigma) per manufacturer’s protocol. Ten centimeter dishes of cells were assayed in quintuplicate and cells were counted in parallel for normalization.
QUANTIFICATION AND STATISTICAL ANALYSIS
Unless indicated, all results shown as mean ± SEM of biological triplicates. P values were calculated using a Student’s two-tailed t test; *, P value between 0.01 and 0.05; **, P value between 0.001 and 0.01; ***, P value less than 0.001
DATA AND SOFTWARE AVAILABILITY
Analysis was performed with a previously reported software pipeline constructed from Python, R and Jupyter Notebooks (https://github.com/ucsd-ccbb/mali-dual-crispr-pipeline, Shen et al., 2017).
Information of paired guide RNA designs and raw read counts of screens: Supplementary Table S1
Single gene fitness: Supplementary Table S2
Genetic interactions (pi) scores: Supplementary Table S3
Top hits of genetic interactions: Supplementary Table S4
Original imaging data have been deposited to Mendeley Data.
Supplementary Material
Tab 1: dual sgRNA information and sequences of synthesized oligo pools. Tab 2: sgRNA oligo sequences for SKO studies. Tab 3: RT-PCR primer sequences. Tab 4: Metabolite fragments. Tab 5: Raw counts for HeLa screen. Tab 6: Raw counts for A549 screen. Tab 7: Raw counts for plasmid library.
Tab 1: Single gene fitness scores in A549. Tab 2: Single gene fitness scores in HeLa.
Tab 1: Genetic interaction scores (pi socres) in A549. Tab 2: Genetic interaction scores (pi scores) in HeLa.
Tab 1: Top hits of genetic interactions in A549. Tab 2: Top hits of genetic interactions in HeLa.
Highlights.
CRISPR screen reveals gene essentiality and interactions in the metabolic network
Isozyme families display redundancy and compensation with single-gene knockout
Integration of CRISPR screen and MFA link genotype to cell-specific phenotype
KEAP1 mutation alters cancer redox network and essentiality of oxidative PPP genes
Acknowledgments
We would like to acknowledge members of the Mali and Metallo labs for their helpful discussions, Alex Thomas and Nathan Lewis for help with sgRNA designs, and Eric Bennett for KEAP1 vectors. This work was supported by the California Institute of Regenerative Medicine (RB5-07356 to C.M.M.), NIH grant (R01CA188652 to C.M.M.), Camille and Henry Dreyfus Teacher-Scholar (to C.M.M.), NSF CAREER (to C.M.M.), Searle Scholar Award (to C.M.M.), UCSD Institutional Funds (to P.M.), NIH grant (R01HG009285 to P.M.), NIH grant (R01CA222826 to P.M.), the Burroughs Wellcome Fund (1013926 to P.M.), the March of Dimes Foundation (5-FY15-450 to P.M.), and the Kimmel Foundation (SKF-16-150 to P.M). M.G.B. is supported by a NSF Graduate Research Fellowship (DGE-1144086).
Footnotes
Author contributions
D.Z., M.G.B., C.M.M., and P.M. designed the study. D.Z., M.G.B., J.L., J.H.M., A.B., and P.M. performed experiments and analyzed data. R.S. and T.I. provided technical advice. D.Z., M.G.B., C.M.M., and P.M. wrote the manuscript. All authors read the manuscript.
Declaration of interests
The authors declare no competing interests.
Publisher's Disclaimer: This is a PDF file of an unedited manuscript that has been accepted for publication. As a service to our customers we are providing this early version of the manuscript. The manuscript will undergo copyediting, typesetting, and review of the resulting proof before it is published in its final citable form. Please note that during the production process errors may be discovered which could affect the content, and all legal disclaimers that apply to the journal pertain.
References
- Arroyo JD, Jourdain AA, Calvo SE, Ballarano CA, Doench JG, Root DE, Mootha VK. A Genome-wide CRISPR Death Screen Identifies Genes Essential for Oxidative Phosphorylation. Cell Metab. 2016;24:875–885. doi: 10.1016/j.cmet.2016.08.017. [DOI] [PMC free article] [PubMed] [Google Scholar]
- Birsoy K, Wang T, Chen WW, Freinkman E, Abu-Remaileh M, Sabatini DM. An Essential Role of the Mitochondrial Electron Transport Chain in Cell Proliferation Is to Enable Aspartate Synthesis. Cell. 2015;162:540–551. doi: 10.1016/j.cell.2015.07.016. [DOI] [PMC free article] [PubMed] [Google Scholar]
- Boettcher M, Tian R, Blau J, Markegard E, Wu D, Biton A, Zaitlen N, McCormick F, Kampmann M, McManus MT. Decoding directional genetic dependencies through orthogonal CRISPR/Cas screens. bioRxiv 2017 [Google Scholar]
- Castaldo G, Calcagno G, Sibillo R, Cuomo R, Nardone G, Castellano L, Del Vecchio Blanco C, Budillon G, Salvatore F. Quantitative analysis of aldolase A mRNA in liver discriminates between hepatocellular carcinoma and cirrhosis. Clin Chem. 2000;46:901–906. [PubMed] [Google Scholar]
- Chaneton B, Hillmann P, Zheng L, Martin AC, Maddocks OD, Chokkathukalam A, Coyle JE, Jankevics A, Holding FP, Vousden KH, et al. Serine is a natural ligand and allosteric activator of pyruvate kinase M2. Nature. 2012;491:458–462. doi: 10.1038/nature11540. [DOI] [PMC free article] [PubMed] [Google Scholar]
- Chari R, Mali P, Moosburner M, Church GM. Unraveling CRISPR-Cas9 genome engineering parameters via a library-on-library approach. Nat Methods. 2015;12:823–826. doi: 10.1038/nmeth.3473. [DOI] [PMC free article] [PubMed] [Google Scholar]
- Chow RD, Wang G, Codina A, Ye L, Chen S. Mapping in vivo genetic interactomics through Cpf1 crRNA array screening. bioRxiv 2017 [Google Scholar]
- Christofk HR, Vander Heiden MG, Harris MH, Ramanathan A, Gerszten RE, Wei R, Fleming MD, Schreiber SL, Cantley LC. The M2 splice isoform of pyruvate kinase is important for cancer metabolism and tumour growth. Nature. 2008;452:230–233. doi: 10.1038/nature06734. [DOI] [PubMed] [Google Scholar]
- DeNicola GM, Chen PH, Mullarky E, Sudderth JA, Hu Z, Wu D, Tang H, Xie Y, Asara JM, Huffman KE, et al. NRF2 regulates serine biosynthesis in non-small cell lung cancer. Nat Genet. 2015;47:1475–1481. doi: 10.1038/ng.3421. [DOI] [PMC free article] [PubMed] [Google Scholar]
- DeNicola GM, Karreth FA, Humpton TJ, Gopinathan A, Wei C, Frese K, Mangal D, Yu KH, Yeo CJ, Calhoun ES, et al. Oncogene-induced Nrf2 transcription promotes ROS detoxification and tumorigenesis. Nature. 2011;475:106–109. doi: 10.1038/nature10189. [DOI] [PMC free article] [PubMed] [Google Scholar]
- Dey P, Baddour J, Muller F, Wu CC, Wang H, Liao WT, Lan Z, Chen A, Gutschner T, Kang Y, et al. Genomic deletion of malic enzyme 2 confers collateral lethality in pancreatic cancer. Nature. 2017;542:119–123. doi: 10.1038/nature21052. [DOI] [PMC free article] [PubMed] [Google Scholar]
- Doench JG, Fusi N, Sullender M, Hegde M, Vaimberg EW, Donovan KF, Smith I, Tothova Z, Wilen C, Orchard R, et al. Optimized sgRNA design to maximize activity and minimize off-target effects of CRISPR-Cas9. Nat Biotechnol. 2016;34:184–191. doi: 10.1038/nbt.3437. [DOI] [PMC free article] [PubMed] [Google Scholar]
- Erard N, Knott SRV, Hannon GJ. A CRISPR Resource for Individual, Combinatorial, or Multiplexed Gene Knockout. Mol Cell. 2017;67:348–354. e343. doi: 10.1016/j.molcel.2017.06.030. [DOI] [PMC free article] [PubMed] [Google Scholar]
- Guzman G, Chennuri R, Chan A, Rea B, Quintana A, Patel R, Xu PZ, Xie H, Hay N. Evidence for heightened hexokinase II immunoexpression in hepatocyte dysplasia and hepatocellular carcinoma. Dig Dis Sci. 2015;60:420–426. doi: 10.1007/s10620-014-3364-3. [DOI] [PMC free article] [PubMed] [Google Scholar]
- Han K, Jeng EE, Hess GT, Morgens DW, Li A, Bassik MC. Synergistic drug combinations for cancer identified in a CRISPR screen for pairwise genetic interactions. Nat Biotechnol. 2017 doi: 10.1038/nbt.3834. [DOI] [PMC free article] [PubMed] [Google Scholar]
- Hart T, Chandrashekhar M, Aregger M, Steinhart Z, Brown KR, MacLeod G, Mis M, Zimmermann M, Fradet-Turcotte A, Sun S, et al. High-Resolution CRISPR Screens Reveal Fitness Genes and Genotype-Specific Cancer Liabilities. Cell. 2015;163:1515–1526. doi: 10.1016/j.cell.2015.11.015. [DOI] [PubMed] [Google Scholar]
- Hay N. Reprogramming glucose metabolism in cancer: can it be exploited for cancer therapy? Nat Rev Cancer. 2016;16:635–649. doi: 10.1038/nrc.2016.77. [DOI] [PMC free article] [PubMed] [Google Scholar]
- Hensley CT, Faubert B, Yuan Q, Lev-Cohain N, Jin E, Kim J, Jiang L, Ko B, Skelton R, Loudat L, et al. Metabolic Heterogeneity in Human Lung Tumors. Cell. 2016;164:681–694. doi: 10.1016/j.cell.2015.12.034. [DOI] [PMC free article] [PubMed] [Google Scholar]
- Hsu PP, Sabatini DM. Cancer cell metabolism: Warburg and beyond. Cell. 2008;134:703–707. doi: 10.1016/j.cell.2008.08.021. [DOI] [PubMed] [Google Scholar]
- Ishii T, Itoh K, Takahashi S, Sato H, Yanagawa T, Katoh Y, Bannai S, Yamamoto M. Transcription factor Nrf2 coordinately regulates a group of oxidative stress-inducible genes in macrophages. J Biol Chem. 2000;275:16023–16029. doi: 10.1074/jbc.275.21.16023. [DOI] [PubMed] [Google Scholar]
- Krall EB, Wang B, Munoz DM, Ilic N, Raghavan S, Niederst MJ, Yu K, Ruddy DA, Aguirre AJ, Kim JW, et al. KEAP1 loss modulates sensitivity to kinase targeted therapy in lung cancer. Elife. 2017:6. doi: 10.7554/eLife.18970. [DOI] [PMC free article] [PubMed] [Google Scholar]
- Kuehne A, Emmert H, Soehle J, Winnefeld M, Fischer F, Wenck H, Gallinat S, Terstegen L, Lucius R, Hildebrand J, et al. Acute Activation of Oxidative Pentose Phosphate Pathway as First-Line Response to Oxidative Stress in Human Skin Cells. Mol Cell. 2015;59:359–371. doi: 10.1016/j.molcel.2015.06.017. [DOI] [PubMed] [Google Scholar]
- Lee WN, Boros LG, Puigjaner J, Bassilian S, Lim S, Cascante M. Mass isotopomer study of the nonoxidative pathways of the pentose cycle with [1,2-13C2]glucose. Am J Physiol. 1998;274:E843–851. doi: 10.1152/ajpendo.1998.274.5.E843. [DOI] [PubMed] [Google Scholar]
- Lewis CA, Parker SJ, Fiske BP, McCloskey D, Gui DY, Green CR, Vokes NI, Feist AM, Vander Heiden MG, Metallo CM. Tracing compartmentalized NADPH metabolism in the cytosol and mitochondria of mammalian cells. Mol Cell. 2014;55:253–263. doi: 10.1016/j.molcel.2014.05.008. [DOI] [PMC free article] [PubMed] [Google Scholar]
- Mitsuishi Y, Taguchi K, Kawatani Y, Shibata T, Nukiwa T, Aburatani H, Yamamoto M, Motohashi H. Nrf2 redirects glucose and glutamine into anabolic pathways in metabolic reprogramming. Cancer Cell. 2012;22:66–79. doi: 10.1016/j.ccr.2012.05.016. [DOI] [PubMed] [Google Scholar]
- Muir A, Danai LV, Gui DY, Waingarten CY, Lewis CA, Vander Heiden MG. Environmental cystine drives glutamine anaplerosis and sensitizes cancer cells to glutaminase inhibition. Elife. 2017:6. doi: 10.7554/eLife.27713. [DOI] [PMC free article] [PubMed] [Google Scholar]
- Muller FL, Colla S, Aquilanti E, Manzo VE, Genovese G, Lee J, Eisenson D, Narurkar R, Deng P, Nezi L, et al. Passenger deletions generate therapeutic vulnerabilities in cancer. Nature. 2012;488:337–342. doi: 10.1038/nature11331. [DOI] [PMC free article] [PubMed] [Google Scholar]
- Patra KC, Wang Q, Bhaskar PT, Miller L, Wang Z, Wheaton W, Chandel N, Laakso M, Muller WJ, Allen EL, et al. Hexokinase 2 is required for tumor initiation and maintenance and its systemic deletion is therapeutic in mouse models of cancer. Cancer Cell. 2013;24:213–228. doi: 10.1016/j.ccr.2013.06.014. [DOI] [PMC free article] [PubMed] [Google Scholar]
- Pavlova NN, Thompson CB. The Emerging Hallmarks of Cancer Metabolism. Cell Metab. 2016;23:27–47. doi: 10.1016/j.cmet.2015.12.006. [DOI] [PMC free article] [PubMed] [Google Scholar]
- Romero R, Sayin VI, Davidson SM, Bauer MR, Singh SX, LeBoeuf SE, Karakousi TR, Ellis DC, Bhutkar A, Sanchez-Rivera FJ, et al. Keap1 loss promotes Kras-driven lung cancer and results in dependence on glutaminolysis. Nat Med. 2017 doi: 10.1038/nm.4407. [DOI] [PMC free article] [PubMed] [Google Scholar]
- Shalem O, Sanjana NE, Hartenian E, Shi X, Scott DA, Mikkelsen TS, Heckl D, Ebert BL, Root DE, Doench JG, et al. Genome-scale CRISPR-Cas9 knockout screening in human cells. Science. 2014;343:84–87. doi: 10.1126/science.1247005. [DOI] [PMC free article] [PubMed] [Google Scholar]
- Shen JP, Zhao D, Sasik R, Luebeck J, Birmingham A, Bojorquez-Gomez A, Licon K, Klepper K, Pekin D, Beckett AN, et al. Combinatorial CRISPR-Cas9 screens for de novo mapping of genetic interactions. Nat Methods. 2017 doi: 10.1038/nmeth.4225. [DOI] [PMC free article] [PubMed] [Google Scholar]
- Singh A, Misra V, Thimmulappa RK, Lee H, Ames S, Hoque MO, Herman JG, Baylin SB, Sidransky D, Gabrielson E, et al. Dysfunctional KEAP1-NRF2 interaction in non-small-cell lung cancer. PLoS Med. 2006;3:e420. doi: 10.1371/journal.pmed.0030420. [DOI] [PMC free article] [PubMed] [Google Scholar]
- Stark C, Breitkreutz BJ, Reguly T, Boucher L, Breitkreutz A, Tyers M. BioGRID: a general repository for interaction datasets. Nucleic Acids Res. 2006;34:D535–539. doi: 10.1093/nar/gkj109. [DOI] [PMC free article] [PubMed] [Google Scholar]
- Tennant DA, Duran RV, Gottlieb E. Targeting metabolic transformation for cancer therapy. Nat Rev Cancer. 2010;10:267–277. doi: 10.1038/nrc2817. [DOI] [PubMed] [Google Scholar]
- Thimmulappa RK, Lee H, Rangasamy T, Reddy SP, Yamamoto M, Kensler TW, Biswal S. Nrf2 is a critical regulator of the innate immune response and survival during experimental sepsis. J Clin Invest. 2006;116:984–995. doi: 10.1172/JCI25790. [DOI] [PMC free article] [PubMed] [Google Scholar]
- Thimmulappa RK, Mai KH, Srisuma S, Kensler TW, Yamamoto M, Biswal S. Identification of Nrf2-regulated genes induced by the chemopreventive agent sulforaphane by oligonucleotide microarray. Cancer Res. 2002;62:5196–5203. [PubMed] [Google Scholar]
- Vander Heiden MG. Targeting cancer metabolism: a therapeutic window opens. Nat Rev Drug Discov. 2011;10:671–684. doi: 10.1038/nrd3504. [DOI] [PubMed] [Google Scholar]
- Vander Heiden MG, Cantley LC, Thompson CB. Understanding the Warburg effect: the metabolic requirements of cell proliferation. Science. 2009;324:1029–1033. doi: 10.1126/science.1160809. [DOI] [PMC free article] [PubMed] [Google Scholar]
- Wang T, Birsoy K, Hughes NW, Krupczak KM, Post Y, Wei JJ, Lander ES, Sabatini DM. Identification and characterization of essential genes in the human genome. Science. 2015;350:1096–1101. doi: 10.1126/science.aac7041. [DOI] [PMC free article] [PubMed] [Google Scholar]
- Wang T, Wei JJ, Sabatini DM, Lander ES. Genetic screens in human cells using the CRISPR-Cas9 system. Science. 2014;343:80–84. doi: 10.1126/science.1246981. [DOI] [PMC free article] [PubMed] [Google Scholar]
- Wang X, Spandidos A, Wang H, Seed B. PrimerBank: a PCR primer database for quantitative gene expression analysis, 2012 update. Nucleic Acids Res. 2012;40:D1144–1149. doi: 10.1093/nar/gkr1013. [DOI] [PMC free article] [PubMed] [Google Scholar]
- Wong AS, Choi GC, Cui CH, Pregernig G, Milani P, Adam M, Perli SD, Kazer SW, Gaillard A, Hermann M, et al. Multiplexed barcoded CRISPR-Cas9 screening enabled by CombiGEM. Proc Natl Acad Sci U S A. 2016;113:2544–2549. doi: 10.1073/pnas.1517883113. [DOI] [PMC free article] [PubMed] [Google Scholar]
- Young JD. INCA: a computational platform for isotopically non-stationary metabolic flux analysis. Bioinformatics. 2014;30:1333–1335. doi: 10.1093/bioinformatics/btu015. [DOI] [PMC free article] [PubMed] [Google Scholar]
- Zhang DD, Hannink M. Distinct cysteine residues in Keap1 are required for Keap1-dependent ubiquitination of Nrf2 and for stabilization of Nrf2 by chemopreventive agents and oxidative stress. Mol Cell Biol. 2003;23:8137–8151. doi: 10.1128/MCB.23.22.8137-8151.2003. [DOI] [PMC free article] [PubMed] [Google Scholar]
- Zhang Z, Chen L, Liu L, Su X, Rabinowitz JD. Chemical Basis for Deuterium Labeling of Fat and NADPH. J Am Chem Soc. 2017;139:14368–14371. doi: 10.1021/jacs.7b08012. [DOI] [PMC free article] [PubMed] [Google Scholar]
Associated Data
This section collects any data citations, data availability statements, or supplementary materials included in this article.
Supplementary Materials
Tab 1: dual sgRNA information and sequences of synthesized oligo pools. Tab 2: sgRNA oligo sequences for SKO studies. Tab 3: RT-PCR primer sequences. Tab 4: Metabolite fragments. Tab 5: Raw counts for HeLa screen. Tab 6: Raw counts for A549 screen. Tab 7: Raw counts for plasmid library.
Tab 1: Single gene fitness scores in A549. Tab 2: Single gene fitness scores in HeLa.
Tab 1: Genetic interaction scores (pi socres) in A549. Tab 2: Genetic interaction scores (pi scores) in HeLa.
Tab 1: Top hits of genetic interactions in A549. Tab 2: Top hits of genetic interactions in HeLa.