Significance
Changes in the amount and timing of snowmelt have large effects on water for society and ecosystems. Using long-term records from across the western United States, we demonstrate that atmospheric humidity is a major control on how seasonal snow responds to warming temperatures. Specifically, we observe an increase in the frequency and magnitude of episodic winter melt events under higher humidity that may alter the timing of water availability. In lower-humidity regions, however, warming is associated with increased sublimation and/or evaporation from the snowpack further reducing the amount of available water in these dry regions. Management approaches to address these changes in snowmelt water resources from continued warming will require improved estimation of variable and changing atmospheric humidity.
Keywords: snow, climate, water resources, hydrology, humidity
Abstract
Climate change is altering historical patterns of snow accumulation and melt, threatening societal frameworks for water supply. However, decreases in spring snow water equivalent (SWE) and changes in snowmelt are not ubiquitous despite widespread warming in the western United States, highlighting the importance of latent and radiant energy fluxes in snow ablation. Here we demonstrate how atmospheric humidity and solar radiation interact with warming temperature to control snowpack ablation at 462 sites spanning a gradient in mean winter temperature from −8.9 to +2.9 °C. The most widespread response to warming was an increase in episodic, midwinter ablation events. Under humid conditions these ablation events were dominated by melt, averaging 21% (202 mm/year) of SWE. Winter ablation under dry atmospheric conditions at similar temperatures was smaller, averaging 12% (58 mm/year) of SWE and likely dominated by sublimation fluxes. These contrasting patterns result from the critical role that atmospheric humidity plays in local energy balance, with latent and longwave radiant fluxes cooling the snowpack under dry conditions and warming it under humid conditions. Similarly, spring melt rates were faster under humid conditions, yet the second most common trend was a reduction in spring melt rates associated with earlier initiation when solar radiation inputs are smaller. Our analyses demonstrate that regional differences in atmospheric humidity are a major cause of the spatial variability in snowpack response to warming. Better constraints on humidity will be critical to predicting both the amount and timing of surface water supplies under climate change.
Mountain snowpacks supply water to semiarid regions worldwide, storing precipitation through the winter and releasing it during spring and summer when both societal and ecosystem water demands peak (1). Global estimates are that snowmelt-derived surface water supplies 1/8 of the world’s drinking water and 1/4 of the global gross domestic product (2). Snowmelt also recharges regional groundwater (3, 4), which supplements surface water supplies in semiarid regions. Consequently, changing snowpack accumulation and ablation may threaten both the timing (5) and the amount of snowmelt water (6) that reaches streams, reservoirs, and aquifers.
Changes in seasonal snowpack ablation (i.e., snow mass loss from melt, sublimation, or evaporation) as a result of increasing temperatures are a growing concern for both water supply management and water availability for sensitive ecosystems. Declines in snow water equivalent (SWE) have been linked to earlier melt (5, 7), altered melt rates (7, 8), and changes from snow to rain (7, 9), yet these changes are not ubiquitous despite widespread warming (10). Initial research on snowpack response to warming focused on April 1 SWE, largely because of its historical use in water management (11). More recent work has highlighted changes in melt rate and timing and rain versus snowfall on surface water resources (5, 7). Although these studies provide insights on the sensitivity of snowmelt-derived water resources to recent warming, the high spatial and temporal heterogeneity observed in snowpack response highlights a need to inform empirical observations with mechanistic understanding of snowpack mass and energy balance.
Seasonal snow cover fundamentally alters land surface energy balance, which complicates predicting how warming will influence snow water resources. Solar radiation is the largest energy input to seasonal snow cover, and persistent snowpacks typically develop as solar radiation approaches an annual minimum (12). Warming temperatures may delay the initiation of snow cover in the autumn (12), but the high albedo of snow minimizes net shortwave energy input allowing snowpacks to develop and subsequently persist as solar angles increase through winter and spring. Although the effects of warming temperatures on the snowpack energy balance can shift the initiation of snowmelt earlier in the year, earlier spring snowmelt during lower solar radiation results in slower snowmelt rates under a warming climate (8).
Within this seasonal energy balance constraint set by solar radiation and albedo, local temperature, humidity, and longwave radiation interact to either cool or warm the snowpack. A warmer atmosphere increases both sensible heat and longwave radiation fluxes to the snowpack. Because water molecules, including snow, have a much higher emissivity than dry air (13), the snowpack can continue to cool even when air temperature is above 0 °C if humidity is low. Increasing atmospheric humidity, especially when it leads to the presence of clouds, offsets the differential emissivity between air and snow that tends to cool the snowpack during cold, clear nights. Similarly, latent energy exchanges between the atmosphere and snowpack can either warm (condensation) or cool (sublimation) the snowpack with the direction of energy exchange determined by the vertical gradient in humidity and turbulent mixing (14). These latent energy fluxes are often much larger than sensible energy, caused by temperature, yet are relatively understudied sources of snowmelt (15) and overall snowpack energy balance in drier locations (16).
Despite the strong interactions between humidity and multiple components of snowpack energy balance, atmospheric humidity has not been directly addressed as a driver of snowpack sensitivity to climate change. This is due both to a lack of broad appreciation for the role atmospheric moisture plays in snowpack energy balance and to large uncertainties in how humidity will change (17). Consequently, changes in atmospheric humidity can be expected to vary regionally leading to large, but currently unquantified, variability in snowmelt-derived water resources.
To address this knowledge gap we evaluated 30+ years of snowpack records to understand how changes in temperature will interact with the much larger energy fluxes associated with radiation and latent energy to either exacerbate or attenuate the effects of warming on seasonal snowpacks. Our empirical results demonstrate that humidity has strongly modified the effects of recent regional warming.
Results and Discussion
We analyzed 462 Snow Telemetry (SNOTEL) sites in the western United States during a 30+ year period (1985–2015) of warming air temperatures (∼0.5 °C/decade). We matched gridded climate data to the SNOTEL sites to extend the record of air temperature (that are typically less than 20 y) and add estimates of humidity and solar radiation. We used the resulting >7,500 site years to assess the primary drivers of changing snowpack ablation during the winter season (defined as the period of net snow accumulation between snowpack initiation and the date of peak SWE) and spring season (defined as the period of net snowpack ablation from date of peak SWE until snow disappearance). Mean winter temperatures during the accumulation season ranged from −8.9 °C to +2.9 °C, highlighting that temperature alone is an insufficient predictor of seasonal snow cover. The measurements, collected over a broad range of climates in the western United States, provide a rich dataset to evaluate how climate change is likely to influence future snowpack ablation.
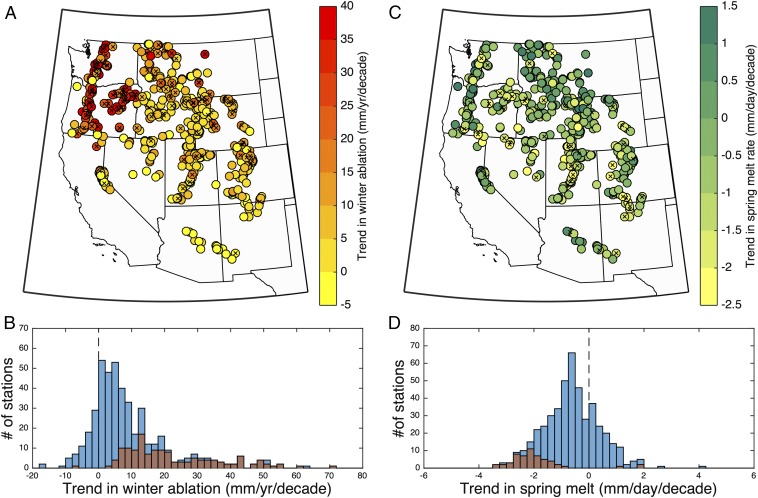
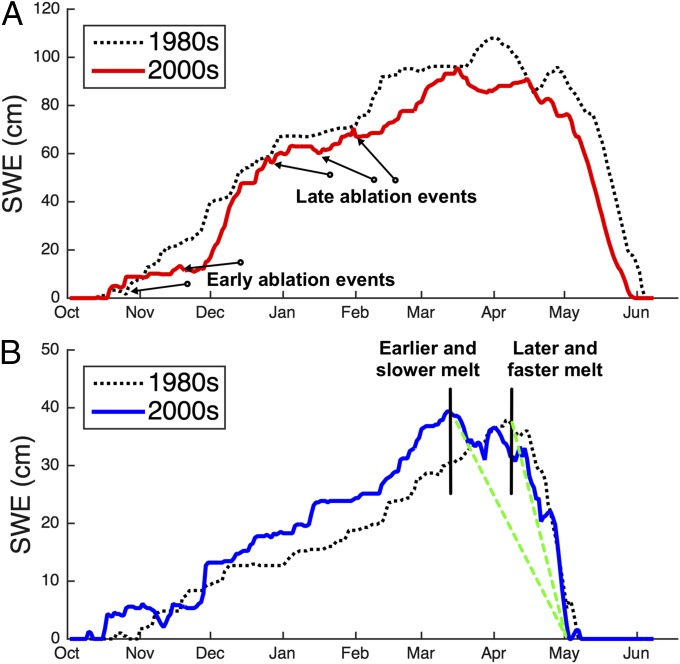
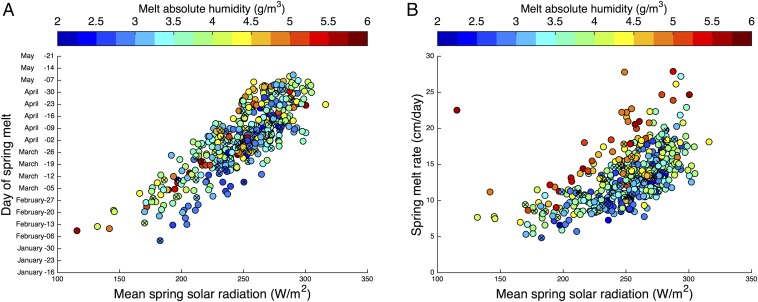
Significant warming occurred at 262 of 462 sites (57%) averaging 0.5 °C/decade over the last three decades (SI Appendix, Fig. S1). Despite this widespread warming, the response of seasonal snowpack ablation was highly variable. The most common observation was a significant increase in episodic, midwinter ablation events (referred to as winter ablation) at 171 of 462 sites (Fig. 1A and SI Appendix, Fig. S2). These winter ablation events averaged 3 d in duration and were largest and most prevalent in the Pacific Northwest (PNW) (Fig. 1A). In contrast to the episodic winter melt events in the PNW (Fig. 2A), the arid Southwest (SW) had lower and less variable ablation rates, consistent with measured sublimation rates of around 1 mm/d (18). In addition, once melt began in the SW it typically proceeded until snow disappeared for the season (Fig. 2B), leading to a clearly differentiable accumulation and ablation period. The second most common observation was a change in the rate of spring snowmelt at 55 sites, with 52 of 55 trends toward slower rather than faster melt (Fig. 1C). The changes toward slower spring snowmelt were largest in the SW portion of the study domain (i.e., Southern Rockies and Colorado Plateau; Fig. 1C) where melt began an average of 5 d earlier per decade (SI Appendix, Fig. S1). Variability in spring snowmelt rate could be explained primarily by the timing of snowmelt (Fig. 3A), with later melting snow having greater solar radiation inputs and melting at faster rates (Fig. 3B). Across all locations, higher absolute humidity was associated with faster melt rates (Fig. 3B), consistent with large latent energy fluxes warming the snowpack.
Fig. 1.
Trends in winter and spring ablation over the last 3 decades. Trends in (A and B) winter ablation and (C and D) spring melt rate (C and D) from 1985 through 2015 at 462 sites. Symbol colors (A and C) represent magnitude of change, and crosses denote sites with significant trends (P < 0.05). Histograms (B and D) show the number of sites with trends at varying magnitudes (blue bars); red bars are significant trends (P < 0.05).
Fig. 2.
(A) Example SWE time series from a site (388, Cascade Summit, OR) representing the Pacific Northwest, with similar winter precipitation between 1988 and 2001. The absolute humidity was 3.0 in 1988 versus 3.7 g/m3 in 2001, and the winter ablation had a corresponding increase from 40 to 160 mm. (B) The second example site (618, McClure Pass, CO) represents the Southwest, where melt began earlier and was warmer in 2006 than 1986 (mean temperature of −2.0 and −3.2 °C, respectively). During the warmer and earlier snowmelt in 2006, the melt rate was slower (green dotted line) than the cooler 1986 (average melt rate of 0.8 and 1.4 cm/d, respectively).
Fig. 3.
(A) Day of spring melt initiation as a function of spring solar radiation and (B) spring melt rate as a function of solar radiation for the 462 sites. The symbol colors represent the mean melt season absolute humidity. The crosses denote significant changes (P < 0.05) in either the day of melt or spring melt rate. Spring melt rate slowed with lower solar radiation inputs that were caused by an earlier initiation of melt when sun angles and incoming radiation were lower.
The observations of both increased winter ablation magnitude and earlier spring melt are consistent with previous reports that identified reductions in April 1 SWE and earlier streamflow (5, 19). However, they indicate marked, regional differences in the processes responsible for snowpack ablation (Fig. 1). We evaluated these broad, regional patterns by quantifying how site-specific temperature, humidity, and solar radiation covaried to identify the mechanisms underlying heterogeneous snowpack response to warming (16). Our analyses first highlight the importance of seasonal cycles in solar radiation in snowpack response to warming (Fig. 3). When incoming solar radiation is low in midwinter, warming increases episodic ablation events (either by melt or sublimation) followed by snow accumulation and/or snowpack redevelopment (Fig. 2). Conversely, when warming results in the earlier initiation of spring melt, the lower solar angles earlier in the spring result in a reduction in melt rate, increasing the importance of sensible and especially latent energy (e.g., higher humidity) in driving melt rates (Fig. 3B).
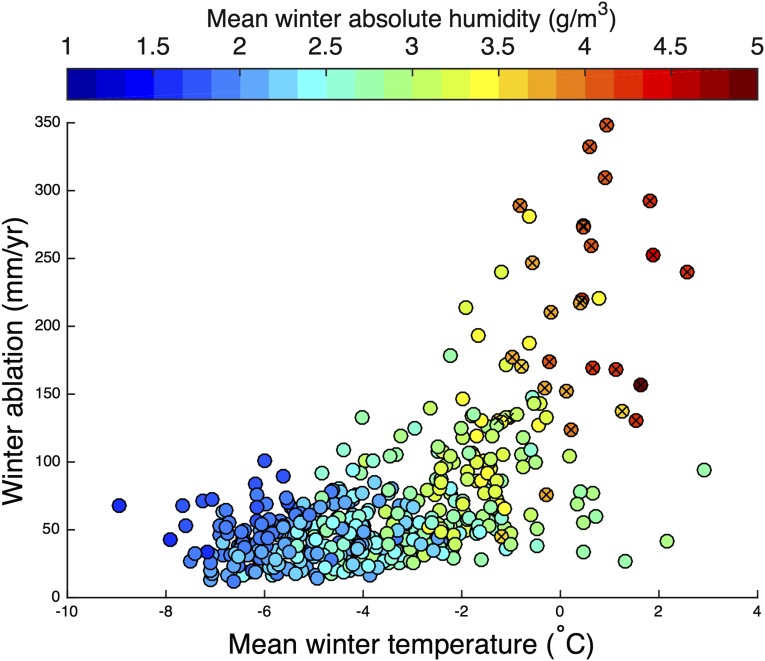
Winter ablation ranged from 12 to 349 mm/y, and although the highest ablation occurred at warmer temperatures, only the combination of warm temperature and higher humidity resulted in large ablation rates (Fig. 4). Sites with mean winter temperature above 0 °C only showed higher winter ablation magnitudes (Fig. 4) and rates (SI Appendix, Fig. S3) if mean winter absolute humidity crossed above ∼3.5 g/m3. This empirically derived threshold of ∼3.5 g/m3 reflects the dual role of vapor exchange in either cooling or warming the snowpack (16). Condensation warms the snowpack when the overlying atmosphere has an absolute humidity equal to or above the saturated vapor pressure at the ice–air interface (maximum absolute humidity of ∼4.8 g/m3 at temperatures of 0 °C). The mismatch between our empirically derived ∼3.5 g/m3 threshold and the physical threshold of saturated vapor pressure at 0 °C (∼4.8 g/m3) is related to the increased likelihood of episodic warm, humid winter ablation events as mean humidity increases. For example, a snowpack in a location with mean winter absolute humidity of 3.5 g/m3 spends about 10% of winter days above 4.8 g/m3 during which condensation will warm the snowpack if turbulent mixing is present (SI Appendix, Fig. S4). Although not evaluated directly here, increased cloudiness associated with higher humidity (20) alters the longwave energy balance, exacerbating the effects of warming (21). Similarly, increased energy inputs to the snowpack from condensation and longwave radiation are also the primary drivers of melt during rain-on-snow events (22). In this analysis, however, 82% of winter ablation occurred on days without precipitation, demonstrating that rain on snow is not required for large ablation events.
Fig. 4.
Mean site-level winter ablation as function of mean winter temperature. The symbol colors represent the mean winter absolute humidity. Sites with mean winter absolute humidity >3.5 g/m3 are shown with crosses.
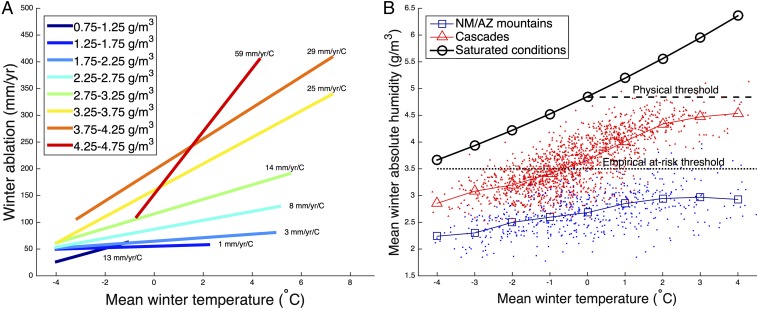
We further highlight the sensitivity of winter ablation to latent energy fluxes by binning the annual data into winter absolute humidity bins of 0.5 g/m3 and plotting the observed winter ablation magnitudes and rates as a function of temperature (Fig. 5A and SI Appendix, Fig. S5). The slopes of regression lines clearly represent the increasing sensitivity of winter ablation to higher absolute humidity, and the line length represents the observed temperature range (details are in SI Appendix, Table S1). For example, site years having mean winter absolute humidity of 3.25–3.75 g/m3 exhibited five times more sensitivity to warming effects on winter ablation than site years of <2.25 g/m3 (Fig. 5A). These different winter ablation sensitivities largely sort regionally between the arid, continental climate of the SW and the humid, maritime climate of the PNW (Fig. 5B). In the more humid PNW locations, the difference between saturated and actual absolute humidity was small (i.e., relative humidity is high), and winter ablation events were common. On average, these locations crossed our empirically derived at risk threshold of ∼3.5 g/m3 when mean winter air temperature was approximately −1.0 °C, with individual site years crossing that threshold at values as low as −3 °C (Fig. 5B). Despite covering a nearly identical winter temperature range, the lower humidity site years in SW rarely crossed the at risk absolute humidity threshold, even at site years with winter temperatures above 0 °C (Fig. 5B). These warmer locations were as likely to have long-term temperature increases as the more humid sites (SI Appendix, Fig. S1), but sublimation (18) and longwave cooling likely buffered sensible energy inputs and sustained snow cover in to the spring. The net effect of warming at these lower-humidity locations was a slightly earlier initiation of melt and slower melt driven by lower solar radiation (8) (Fig. 3A), consistent with solar radiation being the primary driver of melt rates (16, 21) (Fig. 3B).
Fig. 5.
(A) The influence of temperature on winter ablation differs between lower- and higher-humidity locations, whereas (B) the differences in humidity vary by region. Best-fit lines (P < 0.01) between winter ablation and mean winter temperature for all site years grouped in 0.5 g/m3 absolute humidity bins (A). Mean winter absolute humidity versus winter temperature using site years from the PNW and SW (B). The dark black line represents saturated conditions, whereas the dashed line represents saturated conditions at 0 °C. The dotted line is the empirical at-risk absolute humidity threshold (3.5 g/m3).
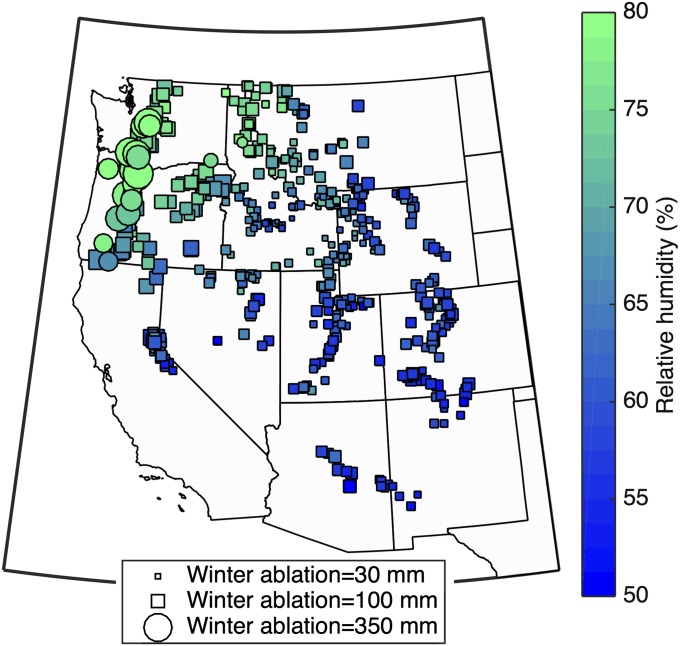
The observation that seasonal snow cover in the western United States exists across a mean winter temperature range of greater than 12 °C, including multiple locations with mean winter temperatures greater than 0 °C (Fig. 4), highlights the importance of other energy fluxes in controlling snowpack response to climate change. The primary control on seasonal snow presence and persistence is solar radiation, with snow cover developing when net radiation is lower in the autumn and melting as solar angle increases in the spring (Fig. 3). Within this seasonal cycle in solar radiation, we demonstrate that the mechanisms underlying the differential response of seasonal winter ablation to warming were mediated by atmospheric water vapor (Fig. 6). The exponential relationship between absolute humidity with temperature (Fig. 5B) provides a physical explanation for the dramatic increase in winter ablation and its associated temperature sensitivity (e.g., slopes in Fig. 5A). This is consistent with humidity-mediated latent energy fluxes, driven by the same turbulent exchange processes that control temperature-mediated sensible energy fluxes, causing much larger energy exchange than temperature effects alone (15) (Fig. 5A). However, these humidity-mediated heat fluxes can be both positive during condensation events and negative during sublimation events. Consequently, in the SW, humidity-mediated energy fluxes result in lower but still substantial losses (mean of 58 mm/y or 12% of maximum annual SWE) and a net cooling of the snowpack (Fig. 6 and SI Appendix, Fig. S6) that, at least partially, offsets the effects of warming by delaying spring snowmelt timing and thereby lowering melt rates (21) (Fig. 3). In contrast, humidity-mediated energy exchanges cause increased frequency and magnitude of winter melt in the PNW (mean of 202 mm/y or 22% of maximum annual SWE) and other locations with absolute humidity above 3.5 g/m3 (Fig. 6).
Fig. 6.
Mean winter ablation over the last 30 y (size of symbol) for sites with mean winter absolute humidity above 3.5 g/m3 (circles) and below (squares). The symbol color shows the mean winter relative humidity. Lower relative humidity drives lower winter ablation via sublimation, whereas at-risk areas with absolute humidity >3.5 g/m3 had much higher ablation losses from episodic melt events. However, the winter ablation as a percent of the snowpack could be high in places in the SW where snowpacks were smaller (SI Appendix, Fig. S6).
Predicting the response of seasonal snow cover and snowmelt-derived water resources to future warming will require a convergence between physically based models, which are currently limited by the absence of finely distributed climate and snowpack data, and operational models that rely heavily on readily available meteorological data. An important initial step in this convergence is to prioritize when, where, and how to include the effects of the large energy fluxes associated with latent energy in operational models and management decisions. Bidirectional changes in relative humidity over the 30+ historical records, with increases in the PNW and decreases in the SW (SI Appendix, Fig. S1B), highlight the challenges for predicting snow under a changing climate. In locations where average winter absolute humidity increases above 3.5 g/m3, we can expect more frequent episodic winter melt events followed by redevelopment of snowpacks. Increased winter snowmelt could significantly change the timing of river and reservoir inflows, with uncertain but likely small changes in annual water yield (i.e., the fraction of winter precipitation available downstream). If winter humidity remains below 3.5 g/m3, however, we are likely to observe higher winter sublimation losses (10, 18) and a gradual trend toward slightly earlier melt initiation, slower melt rates (8), a prolonged melt season (12), and decreased water yields (6) all causing an increase in the summer water stress of natural and built systems (23, 24). Identifying the corresponding hydrological response from differential changes to winter and spring snowmelt may help explain observed regional trends in winter and summer baseflow (25) and variable response to timing of the snowmelt freshet (5).
Conclusions
The differential snowpack response to recent warming mediated by humidity (Figs. 5 and 6) results in different water management challenges that necessitate targeted societal responses. Increased winter melt in humid areas will require enhanced storage capabilities (reservoir, groundwater, etc.) to compensate for the decrease in snow storage and safeguard against increased winter flooding events. Conversely, earlier and slower snowmelt in less humid areas could lower annual water yields due to sublimation losses and increased evapotranspiration (6, 26), requiring updated water management strategies to conserve water in dry years. The critical role that humidity plays in both snow formation (27) and persistence (Fig. 5A) in the western United States will require a focused effort to understand future humidity patterns and include those projections in snow water resource assessments.
Materials and Methods
Data.
Observations from 462 SNOTEL sites operated by the US Natural Resource Conservations Service (NRCS) were used in the analysis. All 462 sites have precipitation and SWE records beginning between water years 1980 and 1985 and running through 2015. The SNOTEL precipitation and SWE data are subject to significant postprocessing by the NRCS and, therefore, did not require quality control. The datasets are available at www.wcc.nrcs.usda.gov/snow/. Most of these sites are below tree line and located in small forest clearings (28). NRCS does maintain these sites to remove adjacent trees that are affecting precipitation gauges and snow pillows, but some effects of tree growth on long-term trends are possible and unaccounted for. These effects are unlikely to bias our results as tree growth may reduce energy input to the snowpack through shading and decreased turbulence or increase it through longwave radiation and increased local humidity (29). A climatological record was developed from the University of Idaho gridded surface meteorological data. This gridded dataset combines spatial patterns from high-resolution statistical models with temporal attributes from climate reanalysis datasets to develop daily 4-km climate products (30). We utilize air temperature, relative humidity, and incoming solar radiation data extracted from the 4-km grid cell containing each SNOTEL site. Estimates of minimum and maximum relative humidity had median absolute error (MAE) of 6–12% and minimum and maximum temperature had MAE of 1.7–2.3 °C (30). Additional uncertainty arises because of subgrid variability within the 4-km grid cell that was not considered. These uncertainties are most problematic for estimating the absolute values and likely increased scatter in some of the regressions.
The daily air temperature and relative humidity was estimated to be the mean of the minimum and maximum daily values. The absolute humidity was calculated in g/m3 as a function of temperature (T) in Celsius and percent relative humidity (RH) based on the ideal gas law using the following equation:
The air temperature, relative humidity, and solar radiation dataset is available at climate.northwestknowledge.net/METDATA/. Aggregations were made using the boundaries of the Environmental Protection Agency Ecoregion III (31), with the Cascades ecoregion used to define the PNW climate and the NM/AZ mountains ecoregion used to characterize the climate of the SW.
Snowpack Ablation Calculations.
Snowpack mass loss was calculated for the cumulative winter total from day of persistent snow appearance to day of maximum annual SWE, as well as the daily rate over the spring period (day of maximum SWE to snow disappearance). We also computed the winter ablation rate (magnitude divided by days between snow initiation and peak annual SWE) and the number of days on which winter ablation occurred.
Trend Analysis.
The trends in winter ablation and climate variables were calculated using the Mann–Kendall test (32). The Mann–Kendall test is a nonparametric test of monotonic trends that has been successfully applied to SNOTEL records previously (10). The test statistic tau was assumed significant if it differed from zero with a P value less than 0.05. The slope of the trend was estimated using the Sen method (33).
Statistical Analysis.
Several statistical regression measures were used to relate snowpack ablation response to climate variables. Linear regression was performed on the site year datasets to calculate a P value based on an F statistic that is shown in SI Appendix, Table S1, and used in Fig. 5A. Spearman rho values were calculated as a nonparametric and nonlinear measure of statistical correlation, and P values for the Spearman rho were computed using the exact permutation distribution.
Supplementary Material
Acknowledgments
All data used in these analyses are freely available either from NRCS SNOTEL network (https://www.wcc.nrcs.usda.gov/snow/) or from climate.northwestknowledge.net/METDATA/. A.A.H. was supported by a US Department of Agriculture NIFA Grant (NEV05293). P.D.B. was supported by the National Science Foundation (EAR-0724960, OIA-1208732, and EAR-1331408) and the Department of Energy (DOE)’s Terrestrial Ecosystem Science Program (DOE Award DE-SC0006968).
Footnotes
The authors declare no conflict of interest.
This article is a PNAS Direct Submission.
This article contains supporting information online at www.pnas.org/lookup/suppl/doi:10.1073/pnas.1716789115/-/DCSupplemental.
References
- 1.Sturm M, Goldstein MA, Parr C. Water and life from snow: A trillion dollar science question. Water Resour Res. 2017;53:3534–3544. [Google Scholar]
- 2.Barnett TP, Adam JC, Lettenmaier DP. Potential impacts of a warming climate on water availability in snow-dominated regions. Nature. 2005;438:303–309. doi: 10.1038/nature04141. [DOI] [PubMed] [Google Scholar]
- 3.Manning AH, Solomon DK. Using noble gases to investigate mountain-front recharge. J Hydrol (Amst) 2003;275:194–207. [Google Scholar]
- 4.Jasechko S, et al. The pronounced seasonality of global groundwater recharge. Water Resour Res. 2014;50:8845–8867. [Google Scholar]
- 5.Stewart IT, Cayan DR, Dettinger MD. Changes toward earlier streamflow timing across western North America. J Clim. 2005;18:1136–1155. [Google Scholar]
- 6.Barnhart TB, et al. Snowmelt rate dictates streamflow. Geophys Res Lett. 2016;43:8006–8016. [Google Scholar]
- 7.Clow DW. Changes in the timing of snowmelt and streamflow in Colorado: A response to recent warming. J Clim. 2010;23:2293–2306. [Google Scholar]
- 8.Musselman KN, Clark MP, Liu C, Ikeda K. Slower snowmelt in a warmer world. Nat Clim Chang. 2017;7:214–219. [Google Scholar]
- 9.Knowles N, Dettinger MD, Cayan DR. Trends in snowfall versus rainfall in the western United States. J Clim. 2006;19:4545–4559. [Google Scholar]
- 10.Harpold A, et al. Changes in snowpack accumulation and ablation in the intermountain west. Water Resour Res. 2012;48:W11501. [Google Scholar]
- 11.Church JE. Snow surveying: Its principles and possibilities. Geogr Rev. 1933;23:529–563. [Google Scholar]
- 12.Trujillo E, Molotch NP. Snowpack regimes of the western United States. Water Resour Res. 2014;50:5611–5623. [Google Scholar]
- 13.Brewster MQ. Thermal Radiative Transfer and Properties. Wiley; New York: 1992. pp. 28–39. [Google Scholar]
- 14.DeWalle D, Rango A. Principles of Snow Hydrology. Cambridge Univ Press; Cambridge, UK: 2008. Snowpack energy exchange: Basic theory; pp. 146–181. [Google Scholar]
- 15.Harder P, Pomeroy JW, Helgason W. Local scale advection of sensible and latent heat during snowmelt. Geophys Res Lett. 2017;44:9769–9777. [Google Scholar]
- 16.Cline DW. Effect of seasonality of snow accumulation and melt on snow surface energy exchanges at a continental alpine site. J Appl Meteorol. 1997;36:32–51. [Google Scholar]
- 17.Pierce DW, Cayan DR. Downscaling humidity with Localized Constructed Analogs (LOCA) over the conterminous United States. Clim Dyn. 2016;47:411–431. [Google Scholar]
- 18.Sexstone GA, Clow DW, Stannard DI, Fassnacht SR. Comparison of methods for quantifying surface sublimation over seasonally snow‐covered terrain. Hydrol Process. 2016;30:3373–3389. [Google Scholar]
- 19.Mote PW, Hamlet AF, Clark MP, Lettenmaier DP. Declining mountain snowpack in western North America. Bull Am Meterol Soc. 2005;86:39–49. [Google Scholar]
- 20.Slingo JM. A cloud parametrization scheme derived from GATE data for use with a numerical model. Q J R Meteorol Soc. 1980;106:747–770. [Google Scholar]
- 21.Marks D, Dozier J. Climate and energy exchange at the snow surface in the Alpine region of the Sierra Nevada: 2. Snow cover energy balance. Water Resour Res. 1992;28:3043–3054. [Google Scholar]
- 22.Marks D, Link T, Winstral A, Garen D. Simulating snowmelt processes during rain-on-snow over a semi-arid mountain basin. Ann Glaciol. 2001;32:195–202. [Google Scholar]
- 23.Milly PCD, et al. Climate change. Stationarity is dead: Whither water management? Science. 2008;319:573–574. doi: 10.1126/science.1151915. [DOI] [PubMed] [Google Scholar]
- 24.Harpold AA. Diverging sensitivity of soil water stress to changing snowmelt timing in the western US. Adv Water Resour. 2016;92:116–129. [Google Scholar]
- 25.Kormos PR, Luce CH, Wenger SJ, Berghuijs WR. Trends and sensitivities of low streamflow extremes to discharge timing and magnitude in Pacific Northwest mountain streams. Water Resour Res. 2016;52:4990–5007. [Google Scholar]
- 26.Foster LM, Bearup LA, Molotch NP, Brooks PD, Maxwell RM. Energy budget increases reduce mean streamflow more than snow–rain transitions: Using integrated modeling to isolate climate change impacts on Rocky Mountain hydrology. Environ Res Lett. 2016;11:044015. [Google Scholar]
- 27.Harpold AA, Rajagopal S, Crews JB, Winchell T, Schumer R. Relative humidity has uneven effects on shifts from snow to rain over the western U.S. Geophys Res Lett. 2017;44:9742–9750. [Google Scholar]
- 28.Serreze MC, Clark MP, Armstrong RL, McGinnis DA, Pulwarty RS. Characteristics of the western United States snowpack from snowpack telemetry (SNOTEL) data. Water Resour Res. 1999;35:2145–2160. [Google Scholar]
- 29.Broxton PD, et al. Quantifying the effects of vegetation structure on snow accumulation and ablation in mixed‐conifer forests. Ecohydrology. 2014;8:1073–1094. [Google Scholar]
- 30.Abatzoglou JT. Development of gridded surface meteorological data for ecological applications and modelling. Int J Climatol. 2013;33:121–131. [Google Scholar]
- 31.Omernik JM, Griffith GE. Ecoregions of the conterminous United States: Evolution of a hierarchical spatial framework. Environ Manage. 2014;54:1249–1266. doi: 10.1007/s00267-014-0364-1. [DOI] [PubMed] [Google Scholar]
- 32.Kendall MG. Rank Correlation Methods. Griffin; London: 1976. [Google Scholar]
- 33.Sen PK. Estimates of the regression coefficient based on Kendall’s tau. J Am Stat Assoc. 1968;63:1379–1389. [Google Scholar]
Associated Data
This section collects any data citations, data availability statements, or supplementary materials included in this article.


