

Abstract
Introduction
Colorectal cancer is highly prevalent and the vast majority of cases are thought to be sporadic, although few risk factors have been identified.
Aims
Using metabolomics technology, our aim was to identify biomarkers prospectively associated with colorectal cancer.
Methods
Our study included 254 incident colorectal cancers and 254 matched controls nested in the Prostate, Lung, Colorectal, and Ovarian Cancer Screening Trial. Serum samples were collected at baseline and the mean length of follow-up was 8 years. Serum metabolites were analyzed by ultra-high performance liquid-phase chromatography with tandem mass spectrometry, and gas chromatography coupled with mass spectrometry. Conditional logistic regression was used to calculate odds ratios (OR) and 95% confidence intervals (CI) for metabolites above the limit of detection and present in at least 80% of participants.
Results
We measured 676 serum metabolites; of these, 447 were of known identity and 278°of these were present in > 80% of individuals. Overall, there was no association between serum metabolites and colorectal cancer; however, we observed some suggestive associations between individual metabolites and colorectal cancer but none reached statistical significance after Bonferroni correction for multiple comparisons; for example, leucyl-leucine was inversely associated (OR comparing the 90th to the 10th percentile=0.50; 95% CI=0.32-0.80; P=0.003). In gender stratified analyses, serum glycochenodeoxycholate was positively associated with colorectal cancer among women (OR90th vs.10th percentile =5.34; 95% CI=2.09-13.68; P-value=0.0001).
Conclusions
We observed no overall associations between serum metabolites and colorectal cancer, but serum glycochenodeoxycholate, a bile acid metabolite, was positively associated with colorectal cancer among women.
Keywords: Colorectal cancer, metabolites, biomarkers, metabolomics
Introduction
Colorectal cancer remains the third most common cancer around the globe, and is fatal in approximately half of cases1. Although overall incidence rates have recently decreased in the U.S., they remain among the highest in the world and incidence is increasing among those less than 50 years of age2. The majority of colorectal cancer cases arise sporadically, and although screening reduces the risk of colorectal cancer, improvements in lifestyle and diet have been hypothesized to have the largest effect on incidence3, 4. However, a recent review of the literature showed that few known modifiable risk factors have been identified; only obesity, alcohol, red meat, and processed meat intake have been consistently positively associated with colorectal cancer5. Furthermore, observational studies report that these risk factors only confer modest increases in risk for this malignancy5, 6.
Epidemiologic studies usually capture data on health and lifestyle using self-administered questionnaires, which are subject to a number of random and systematic errors, such as reporting bias, and can result in misclassification. Biological markers are not subject to such errors and they may be able to better characterize true exposures by incorporating multiple factors, such as diet, lifestyle, the environment, microbiome, and genetics. Biomarkers could incorporate nutritional status, food composition, food processing or cooking products, bioactive food components, contaminants, as well as drugs and endogenous metabolites.
High-throughput technologies such as gas or liquid chromatography and mass spectrometry, or nuclear magnetic resonance spectroscopy, can be used to measure hundreds of metabolites (<1000 Daltons) in any given biospecimen; this is known as metabolic profiling, or metabolomics. The aim of our study was to use metabolomics to agnostically investigate a large number of metabolites in prospectively collected serum samples in relation to incident colorectal cancer.
Methods
The PLCO Cancer Screening Trial
We conducted a nested case-control study within the screening arm of the Prostate, Lung, Colorectal, and Ovarian cancer screening (PLCO) trial, which is a large randomized controlled trial to test the efficacy of screening methods for each of these four cancers7–9. Approximately 155,000 men and women, aged 55 to 74 years, who had no history of prostate, lung, colorectal, or ovarian cancer were enrolled from 10 U.S. centers between 1993 and 2001, and were randomly assigned to the screened or the non-screened arm.
At baseline, all participants in the screening arm of the trial completed questionnaires that queried a variety of health conditions and lifestyle choices, as well as a 137-item food frequency questionnaire. In addition, individuals in the screened arm (n = 77,445) were offered a flexible sigmoidoscopy to examine the distal colorectum as a screening procedure for colorectal cancer; of which 83% (n = 64,658) were compliant and 89% (n = 57,559) of these procedures were considered successful (insertion to at least 50 cm with >90% of mucosa visible or a suspect lesion identified). If neoplastic lesions were detected during flexible sigmoidoscopy, participants were referred to their healthcare provider for a colonoscopy. All participants in the screening arm of the trial were offered a follow-up flexible sigmoidoscopy either three or five years after baseline.
Colorectal cancers were ascertained through self-reported annual health surveys and linkage to the National Death Index (for completeness) and histologically confirmed through medical record review. The Institutional Review Boards of the U.S. National Cancer Institute and the 10 screening centers approved the study, and all participants provided informed consent.
Study sample
Our study sample was drawn from those in the screening arm of the trial who completed the baseline risk factor questionnaire and the dietary questionnaire, provided consent for biospecimens to be used in etiologic studies, and did not have colorectal cancer at study entry according to the questionnaire data and screening sigmoidoscopy (n=52,705). We excluded individuals who had a self-reported personal history of cancer (except basal-cell skin cancer) (n=4,924), had less than 6 months of follow-up (an additional 168 individuals), had a rare cancer during follow-up (an additional 1,074), had self-reported Crohn’s disease, ulcerative colitis, familial polyposis, Gardner’s syndrome, or colorectal polyps (an additional 6,429), and those who did not have a serum sample available from baseline (an additional 2,866 individuals); some individuals fell into multiple exclusion categories.
We then selected the 254 first primary incident colorectal cancers (International Classification of Diseases for Oncology10, ICD-0-3 codes: C180-189, C199, C209, C260) whose ICD morphologies were not in the range of 8240-8249 (which are carcinoid/neuroendocrine tumors and atypical for colorectal cancer), and were identified at least six months after baseline through February 2011; of these, 30 were rectal cancers. Controls (n=254) were free from any cancer at the time the matched case was diagnosed and were incidence-density sampled and matched to the cases on age at randomization (5-year intervals), sex, race, year of randomization, and season of blood draw.
Metabolite assessment
Using non-fasting serum samples from baseline that had been stored at −70 °C or lower and had not been previously thawed, we identified a range of metabolites (approximately under 1,000 Daltons) in serum using Metabolon, Inc. (North Carolina, U.S). The details of the technology used have been previously described11, 12; in brief, a non-targeted single methanol extraction was performed, followed by protein precipitation. Ultra-high performance liquid chromatography-tandem mass spectrometry and gas chromatography–mass spectrometry were used to identify peaks. Using a chemical reference library generated from 2,500 standards, mass spectral peaks, retention times, and mass to charge ratios were used to identify individual metabolites as well as their relative quantities.
Samples were arranged in batches of up to 30, which included blinded quality control samples of pooled serum at a level of 10%. Matched cases and controls were consecutive samples within a batch, and the order of case versus control was counterbalanced within each batch. In addition, Metabolon Inc. inserted a standard every sixth sample.
Metabolite levels were batch normalized and log-transformed. Within each batch, measurements of a given metabolite were divided by their median value. These batch normalized levels were then log-transformed and those individuals with values below the limit-of-detection were assigned the minimum of all observed values.
Statistical analysis
Demographic data for the cases and controls was compared by either Fisher’s exact test for the categorical variables, or Wilcoxon rank test for the continuous variables. The analyses were restricted to metabolites measured in > 80% of individuals. Our primary analysis modeled the association between each metabolite and colorectal cancer by conditional logistic regression, adjusting for body mass index (BMI, continuous), and study center; in addition to the 5-year matching by age, we also adjusted for age in the models to more finely control for the effects of this important colorectal cancer risk factor. We used the Hosmer and Lemeshow goodness of fit test13 to determine whether logistic regression appropriately captured the relationship between case status and age, BMI, gender, and study center in the baseline model; the resulting P-value of 0.26 indicated that logistic regression was a good fit.
We report the odd ratios (ORs) comparing the 90th to the 10th percentile of the metabolite values, the corresponding confidence intervals (CIs), and the P-value from the likelihood ratio test comparing models with and without the metabolite. Letting X90, X10, and β denote the 90th percentile, 10th percentile, and the log(OR) from the conditional logistic regression, we defined the OR of interest by . We repeated the analyses for each gender separately. We used Bonferroni correction to account for multiple comparisons, with the threshold for statistical significance determined by P-values < 0.05/number of metabolites analyzed. Using a Bonferroni corrected threshold will limit our power to detect associations; based on the threshold α=0.05/278, our power to detect a metabolite with an OR = 3 is only 0.4 and a metabolite with an OR = 5 is 0.9. Therefore, many relatively strong associations may not be detectable in this analysis. When considering P-values from our secondary analyses, testing the metabolite-colorectal cancer association separately in men and women, a conservative Bonferroni threshold (6 × 10−5 = 0.05/(278 × 3) should account for the multiple metabolites (278 metabolites) and the multiple tests per metabolite (both genders combined, men only, and women only).
We examined the proportion of metabolites associated with cancer by a quantile-quantile (QQ) plot. We plotted, on a log10-scale, the expected P-values (n/(n+1), (n−1)/(n+1),…,1/n) against the observed P-values, ordered from largest to smallest (p(1), p(1),…, p(n)), where n is the number of metabolites. We also plotted a point-wise 95% CI showing the range of p(i) that can occur by chance. Specifically, we created 1000 permuted datasets by randomly assigning case/control status within each matched pair, calculated for each permutation , and then extracted the 2.5th and 97.5th quantiles of each .
We also performed a standard pathway analysis. Specifically, we evaluated whether the metabolites within predefined pathways were associated with the outcome using the Gene-Set Enrichment analysis14. P-values for the Gene-Set Enrichment analysis were calculated by permutation and are therefore valid given the potentially high correlation between some groups of metabolites.
We examined whether the metabolites, as a group, can distinguish cases from controls using principal component analysis15. We calculated the top 10 principal components of the metabolite measurements, and used a likelihood ratio test to evaluate whether each principal component was associated with the outcome. We then attempted to correctly classify case status by multiple metabolites using random forests. Briefly, random forests, an ensemble learning method, (1) constructs 500 classification trees based on 500 bootstrapped samples; (2) uses each tree to classify the out-of-bag individuals (individuals not used to build the tree); (3) obtains a single prediction or probability for each individual by averaging over all trees. We report the classification error, Area Under the ROC Curve (AUC) based on the probabilities, and their corresponding P-values from Wilcoxon rank sum tests.
Although the incidence of colorectal cancer is roughly equally common in men and women, and several established risk factors are evident among both sexes, there are some sex disparities in the incidence of this malignancy by anatomic subsite and age16, as well as the clear role of female hormones17. With this in mind, we also conducted separate analyses within each gender. Furthermore, in exploratory analyses, we conducted analyses stratified by length of follow-up time.
We assessed the technical reliability of our data by calculating coefficients of variation and intraclass correlation coefficients (ICC) for the quality control samples. We have also previously reported on the overall reliability and validity of this platform18. All analyses were performed with SAS software version 9.1.3 (SAS Institute, Cary, NC) and the R statistical language version 3.0.1.
Results
The median follow-up time from serum collection to diagnosis of colorectal cancer was 7.8 years (25th and 75th percentiles were 5.6 and 10.1 years). None of the baseline characteristics were significantly different between cases and controls (Table 1).
Table 1.
Characteristics of colorectal cancer cases and controls from the Prostate, Lung, Colorectal, and Ovarian cancer screening trial*
| Cases‡ (n=254) |
Controls‡ (n=254) |
P-value† | ||
|---|---|---|---|---|
| Gender | Men | 143 | 143 | |
| Women | 112 | 111 | Matched | |
| Age (years) | 64.3 (5.1) | 64.3 (5.1) | Matched | |
| Race | White | 227 | 226 | |
| Black | 13 | 13 | ||
| Other | 15 | 15 | Matched | |
| Cigarette smoking status | Current | 26 | 19 | |
| Former | 120 | 121 | ||
| Never | 109 | 114 | 0.57 | |
| Education | High school or less | 85 | 84 | |
| Post high school training/some college | 85 | 75 | ||
| College or post-graduate | 85 | 94 | 0.59 | |
| BMI (kg/m2) | <25 | 78 | 88 | |
| 25 to <30 | 103 | 112 | ||
| 30 to <35 | 54 | 41 | ||
| 35 + | 19 | 10 | 0.14 | |
| Vigorous physical activity (hrs/wk) | < 1hr | 75 | 78 | |
| 1 – 3 hrs | 112 | 95 | ||
| 4+ hours | 65 | 75 | 0.35 | |
| Menopausal hormone useˆ | Never | 38 | 28 | |
| Former | 19 | 21 | ||
| Current | 53 | 62 | 0.31 | |
| Regular aspirin use | No | 124 | 131 | |
| Yes | 131 | 123 | 0.54 | |
| Regular ibuprofen use | No | 174 | 183 | |
| Yes | 80 | 71 | 0.44 | |
| Alcohol (g/day) | 12.2 (23.0) | 13.2 (23.6) | 0.44 |
May not add to total due to some missing values
Total counts for categorical variables, means and standard deviations for continuous variables
Fisher’s exact test (categorical variables) or Wilcoxon rank test (continuous variables)
Among women only
There were a total of 676 metabolites identified, of which 447 were named. Among the named metabolites, 278 were measured in > 80% of the individuals in our study, and they included amino acids, carbohydrates, fatty acids, androgens, and xenobiotics.
Using the quality control samples to assess technical reliability, the median coefficient of variation across all of the metabolites was 0.10 (inter-quartile range: 0.04-0.21). Furthermore, the median ICC was 0.86 (10th-90th percentile: 0.39-0.95; 25th-75th percentile: 0.64-0.92).
A QQ plot revealed that there was no overall association between serum metabolites and risk of incident colorectal cancer (Figure 1). In analyses of individual metabolites, none were statistically significantly associated with colorectal cancer after Bonferroni correction for multiple comparisons. The top 20 metabolites with the lowest P-values are shown in Table 2; the lowest P-value was for leucyl-leucine (OR=0.50; 95% CI=0.32-0.80; P-value=0.003), although this did not reach the Bonferroni-corrected level of statistical significance. Associations for leucyl-leucine were also evident in each gender (OR=0.42; 95% CI=0.22-0.83; P-value=0.0089 for men, Table 3; and OR=0.45; 95% CI=0.21-0.95; P-value=0.029 for women, Table 4), albeit they did not reach the Bonferroni corrected threshold for multiple comparisons.
Figure 1.
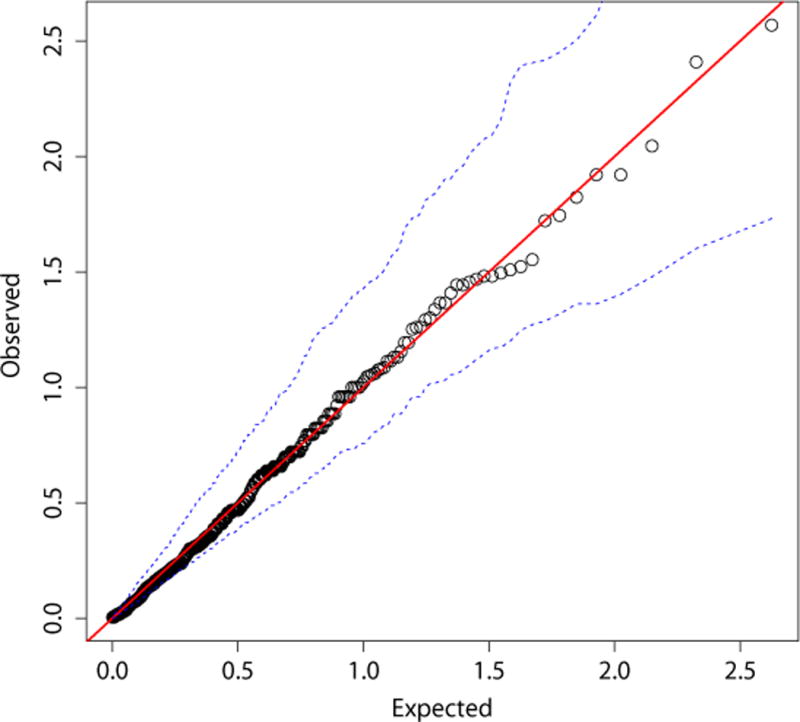
A QQ-plot of the P-values (on a –log10 scale) and 95% confidence intervals from conditional logistic regression* for each metabolite in relation to colorectal cancer compared to the values that would be expected by chance
Table 2.
Odds ratios and 95% confidence intervals for diagnosis of colorectal cancer comparing men and women combined in the 90th and 10th percentiles for each of the top 20 metabolites, using conditional logistic regression
| Metabolite | % of individuals with this metabolite | OR (95% CI)* | P-value† | |
|---|---|---|---|---|
| 1 | Leucyl-leucine | 99 | 0.50 (0.32-0.80) | 0.003 |
| 2 | Fumarate | 98 | 0.55 (0.36-0.84) | 0.004 |
| 3 | 10-undecenoate (11:1n1) | 100 | 0.52 (0.31-0.87) | 0.012 |
| 4 | Xanthine | 97 | 1.90 (1.14-3.18) | 0.012 |
| 5 | Stearate | 100 | 0.52 (0.30-0.89) | 0.015 |
| 6 | Glycochenodeoxycholate | 96 | 1.76 (1.09-2.85) | 0.018 |
| 7 | Andro steroid monosulfate 2 | 86 | 2.08 (1.12-3.87) | 0.019 |
| 8 | Alpha-tocopherol | 100 | 0.56 (0.33-0.95) | 0.028 |
| 9 | 17-methylstearate | 93 | 0.61 (0.39-0.96) | 0.030 |
| 10 | Palmitate | 100 | 0.56 (0.33-0.96) | 0.031 |
| 11 | Eicosenoate (20:1n9 or 11) | 100 | 0.55 (0.32-0.95) | 0.032 |
| 12 | Margarate | 95 | 0.57 (0.34-0.96) | 0.033 |
| 13 | Dihomo-linoleate (20:2n6) | 100 | 0.57 (0.34-0.96) | 0.033 |
| 14 | Dihomo-linolenate | 100 | 0.58 (0.35-0.97) | 0.034 |
| 15 | Cyclo(phe-phe) | 82 | 1.88 (1.03-3.41) | 0.036 |
| 16 | Octadecanedioate | 97 | 0.63 (0.41-0.98) | 0.036 |
| 17 | Docosapentaenoate | 100 | 0.57 (0.34-0.98) | 0.039 |
| 18 | N-acetylserine | 84 | 1.76 (1.01-3.06) | 0.043 |
| 19 | 13-methylmyristic acid | 95 | 0.67 (0.45-1.00) | 0.043 |
| 20 | Leucylalanine | 99 | 0.60 (0.36-1.00) | 0.046 |
Adjusted for age, BMI (continuous), and study center
Bonferroni corrected P-value for significance: 0.05/278=0.00018
Table 3.
Odds ratios and 95% confidence intervals for diagnosis of colorectal cancer comparing men in the 90th and 10th percentiles for each of the top 20 metabolites, using conditional logistic regression
| Metabolite | % of men with this metabolite | OR (95% CI)* | P-value† | |
|---|---|---|---|---|
| 1 | 13-methylmyristic acid | 96 | 0.34 (0.17-0.67) | 0.0007 |
| 2 | Methyl palmitate (15 or 2) | 100 | 0.31 (0.14-0.66) | 0.0014 |
| 3 | 17-methylstearate | 94 | 0.34 (0.17-0.70) | 0.0017 |
| 4 | 10-undecenoate (11:1n1) | 100 | 0.34 (0.15-0.76) | 0.0062 |
| 5 | Leucyl-leucine | 99 | 0.42 (0.22-0.83) | 0.0089 |
| 6 | 2-hydroxystearate | 100 | 0.39 (0.18-0.83) | 0.012 |
| 7 | Margarate | 94 | 0.42 (0.21-0.85) | 0.013 |
| 8 | Scyllo-inositol | 97 | 0.45 (0.22-0.91) | 0.021 |
| 9 | Stearate | 100 | 0.42 (0.19-0.91) | 0.023 |
| 10 | Pentadecanoate | 100 | 0.44 (0.20-0.93) | 0.026 |
| 11 | 2-hydroxypalmitate | 100 | 0.45 (0.22-0.93) | 0.027 |
| 12 | Fumarate | 98 | 0.50 (0.26-0.96) | 0.028 |
| 13 | Stearidonate (18:4n3) | 91 | 0.41 (0.18-0.93) | 0.029 |
| 14 | N-acetylserine | 85 | 2.63 (1.07-6.45) | 0.030 |
| 15 | Glutaroyl carnitine | 97 | 0.46 (0.22-0.95) | 0.030 |
| 16 | Glycerate | 100 | 0.43 (0.20-0.94) | 0.030 |
| 17 | N-acetylneuraminate | 87 | 2.46 (1.03-5.89) | 0.038 |
| 18 | Xanthine | 96 | 2.19 (1.01-4.73) | 0.041 |
| 19 | Phenol sulfate | 100 | 1.98 (0.97-4.00) | 0.054 |
| 20 | Myristate | 100 | 0.49 (0.23-1.03) | 0.055 |
Adjusted for age, BMI (continuous), and study center
Bonferroni corrected P-value for significance: 0.05/(278 × 3)=0.00006
Table 4.
Odds ratios and 95% confidence intervals for diagnosis of colorectal cancer comparing women in the 90th and 10th percentiles for each of the top 20 metabolites, using logistic conditional regression
| Metabolite | % of women with this metabolite | OR (95% CI)* | P-value† | |
|---|---|---|---|---|
| 1 | Glycochenodeoxycholate | 95 | 5.34 (2.09-13.68) | 0.0001 |
| 2 | Pantothenate | 100 | 0.32 (0.14-0.74) | 0.0046 |
| 3 | Cyclo(phe-phe) | 81 | 3.69 (1.37-9.94) | 0.0064 |
| 4 | Taurochenodeoxycholate | 87 | 3.63 (1.35-9.78) | 0.0069 |
| 5 | Pyridoxate | 100 | 0.39 (0.19-0.81) | 0.0069 |
| 6 | Glycocholate | 87 | 3.62 (1.33-9.87) | 0.0077 |
| 7 | Taurolithocholate-3-sulfate | 85 | 3.30 (1.31-8.34) | 0.0084 |
| 8 | Taurodeoxycholate | 88 | 3.22 (1.27-8.19) | 0.0096 |
| 9 | Glycylvaline | 98 | 2.57 (1.14-5.81) | 0.018 |
| 10 | Glycoursodeoxycholate | 83 | 3.15 (1.12-8.90) | 0.025 |
| 11 | Pyroglutamine | 100 | 0.40 (0.17-0.92) | 0.027 |
| 12 | Leucyl-leucine | 100 | 0.45 (0.21-0.95) | 0.029 |
| 13 | Glycolate-hydroxyacetate | 97 | 2.16 (1.06-4.42) | 0.029 |
| 14 | Pyroglutamylglycine | 81 | 2.70 (1.04-7.00) | 0.034 |
| 15 | Dihomo-linolenate | 100 | 0.42 (0.19-0.96) | 0.035 |
| 16 | Glycolithocholate sulfate | 96 | 2.21 (1.04-4.70) | 0.035 |
| 17 | N-acetylalanine | 100 | 0.43 (0.19-0.97) | 0.036 |
| 18 | 1-palmitoylglycerophosphoethanolamine | 100 | 2.18 (1.02-4.69) | 0.037 |
| 19 | Succinate | 92 | 0.47 (0.22-1.00) | 0.041 |
| 20 | 2-hydroxybutyrate (AHB) | 100 | 0.45 (0.21-0.99) | 0.042 |
Adjusted for age, BMI (continuous), and study center
Bonferroni corrected P-value for significance: 0.05/(278 × 3)=0.00006
With the exception of leucyl-leucine, the 20 metabolites with the lowest P-value in men (Table 3) were different from the 20 metabolites with the lowest P-value in women (Table 4). Among men, no metabolites were significantly associated with colorectal cancer. In women, glycochenodeoxycholate was positively associated with colorectal cancer (OR=5.34; 95% CI=2.09-13.68; P-value=0.0001), although this did not withstand stringent correction for multiple testing. Glycochenodeoxycholate was not associated with cancer risk among men (OR=1.16; 95% CI=0.58-2.33; P-value=0.67). The associations between glycochenodeoxycholate, a secondary bile acid, and colorectal cancer did not materially change when the models were also adjusted for history of gallbladder disease, or hormone therapy use among women. Exploratory analyses did not reveal any distinct differences in the associations between metabolites and the colorectal cancers diagnosed in the first 8 years of follow-up versus those diagnosed after 8 years of follow-up.
Examining metabolic pathways did not reveal any associations among men. Five metabolic pathways were statistically significant at the P<0.05 level among women, including bile acid metabolism (P-value=0.012), tocopherol metabolism (P-value=0.022), glutamate metabolism (P-value=0.027), Kreb’s cycle (P-value=0.032), and dipeptides (P-value=0.043); however, after correcting for multiple testing for 44 different pathways, none of these remained statistically significant.
Global tests of associations, combining information across metabolites, similarly suggested that metabolomic profiles were not associated with case status. None of the top 10 principal components were significantly associated with case status, with all likelihood ratio test P-values greater than 0.2. The classification error rate using Random Forests was 0.497 (P = 0.483) and the AUC based on the resulting probabilities was 0.521 (P = 0.405).
Discussion
Using an agnostic metabolomics approach to investigate serum biomarkers, we found no overall association between serum metabolites and colorectal cancer; although a suggestive inverse association was evident for serum leucyl-leucine and colorectal cancer in analyses combining both genders and among each gender, neither reached the Bonferroni corrected level of statistical significance. Serum glycochenodeoxycholate was positively associated with colorectal cancer among women, but this association did not quite reach statistical significance after stringent correction for multiple testing.
For many years, it has been suspected that bile acids play a role in colorectal carcinogenesis through a variety of mechanisms, including apoptosis, tumor promotion, and oxidative stress19, 20. A previous study reported that serum levels of bile acids were higher in patients with colon cancer compared to healthy controls21. Glycochenodeoxycholate is an acyl glycine and a bile acid-glycine conjugate; more specifically, it is a secondary bile acid produced by the microbial flora in the large intestine22. Biologically, experimental studies have shown that glycochenodeoxycholate generates reactive oxygen species23, and has been positively associated with hepatocellular carcinoma24. The specificity of this metabolite to the colon as well as its role as a bile acid both lend biological credence to the association that we observed between this metabolite and colorectal cancer risk; it is not clear, however, why this suggestive association was only evident among women in our study.
The only metabolite evident in both genders was an inverse association between serum leucyl-leucine, a dipeptide, and colorectal cancer, although it was not deemed statistically significant after Bonferroni correction. Leucyl-leucine is a product of incomplete protein breakdown, and, to our knowledge, has not previously been studied in relation to carcinogenesis.
While in our study many of the metabolites were not statistically significant after strict Bonferroni correction for multiple comparisons, we did identify some associations that have been previously reported, albeit not in prospectively collected biospecimens. Serum myristate was inversely associated with colorectal cancer in a previous study25, as well as in men in our study; myristate is found in nutmeg, oils and fats. Although using a different biospecimen type, tissue fumarate was previously inversely associated with colorectal cancer26 and serum levels were also inversely associated with colorectal cancer risk in our study. In addition, urinary succinate was previously inversely associated with colorectal cancer27, this metabolite was also one of the metabolites with the lowest P-values in our study and was inversely associated with risk. Although fumarate is also used as a food additive, both fumarate and succinate are involved in energy production as intermediates in the Krebs cycle.
Previous studies have investigated metabolic profiles in relation to colorectal cancer, but not using prospectively collected samples; instead they are studies in diagnosed cases investigating potential screening or diagnostic markers. A study in Denmark analyzed serum metabolites in metastatic colorectal cancer cases (153 cases and 139 controls) and investigated markers of overall survival28, and several other studies have compared metabolic profiles of serum in colorectal cancer cases and controls, including two small studies (one of 64 cases25 and another of 60 cases29), as well as a larger study (of 222 cases)30. In addition to serum, studies have analyzed other types of biospecimen in relation to colorectal cancer, including fecal water extracts (among 21 cases)31, urine samples (before and after surgery in 24 cases32, and another study of 64 cases27), as well as tumor tissue (all studies had less than 32 cases)26, 33–35. The data from all of these previous studies collected the biospecimens after colorectal cancer diagnosis; therefore, they examined the effects of the disease itself, as well as any treatment, including bowel preparation prior to endoscopy and biopsy. Our study, on the other hand, was designed to prospectively investigate potential markers of exposure prior to the onset of disease. We did conduct exploratory analyses to determine whether the cases diagnosed during the first 8 years of follow-up were associated with different metabolites to those diagnosed after the first 8 years but we did not identify any distinct differences. Nevertheless, future studies should consider the length of follow-up time from the blood collection to the cancer diagnosis and the effect this may have on the metabolite—cancer association.
There were several important limitations to our study. Firstly, we measured metabolites in a single serum sample, which cannot incorporate daily variability in metabolites that could attenuate associations and cannot capture past or lifetime exposures. A previous study highlighted that most metabolites have moderate variability over time and additional sample collections would improve exposure assessment18. Secondly, the serum samples were not fasting samples; previous studies have shown that 20-50% of metabolites can be affected by fasting status. For some metabolites, the effect of fasting status is large, although for most metabolites, the effects are modest18, 36, 37. Thirdly, our analysis was limited to metabolites captured by the technology we used; other technologies, such as nuclear magnetic resonance, may have captured different metabolites. In addition, our endpoint is potentially heterogenous, as some studies have suggested there may be distinct molecular subtypes of colorectal cancer, characterized by microsatellite instability or CpG island methylator phenotype38. Furthermore, the subsite of the tumor may provide distinct etiologic information; unfortunately, we had too few cases within each subsite to investigate this but future studies would benefit from considering tumor location. Finally, due to the relatively small sample size, particularly for the stratified analyses by gender, it is possible that our findings could be due to chance.
Despite the limitations, our study has many strengths. A major strength is the large number of metabolites assayed in a relatively large sample size, which allowed us to investigate many associations in a population that is generalizable to other U.S. populations. In addition, our study was based on prospectively collected serum samples and incident cases of colorectal cancer, reducing the chances of metabolic perturbations as a result of underlying disease. Finally, the laboratory produced good technical ICCs for the metabolites measured.
In conclusion, analyzing metabolites in non-fasting serum from a single point in time did not unveil any associations with colorectal cancer that withstood Bonferroni correction for multiple testing when both genders were combined. Among women only, serum glycochenodeoxycholate was positively associated with colorectal cancer, but after correcting for multiple comparisons for each gender, the association did not quite reach statistical significance. These findings for colorectal cancer should be investigated in additional studies; furthermore, it would be informative to conduct metabolomics analyses of colorectal adenomas to compare with the data for colorectal cancer to shed light on potentially important metabolic pathways involved in the adenoma-carcinoma sequence.
Acknowledgments
The authors would like to thank Tom Riley, Craig Williams, Michael Furr, and Adam Risch of Information Management Services, Inc. of Silver Spring, Maryland, for data management.
Financial support: This work was supported by the Intramural Research Program of the National Cancer Institute, National Institutes of Health, Department of Health and Human Services.
Abbreviations
- BMI
body mass index
- CI
confidence interval
- OR
odds ratio
Footnotes
Conflicts of interest: None
References
- 1.Siegel R, Naishadham D, Jemal A. Cancer statistics, 2012. CA Cancer J Clin. 2012;62(1):10–29. doi: 10.3322/caac.20138. [DOI] [PubMed] [Google Scholar]
- 2.Edwards BK, Ward E, Kohler BA, et al. Annual report to the nation on the status of cancer, 1975-2006, featuring colorectal cancer trends and impact of interventions (risk factors, screening, and treatment) to reduce future rates. Cancer. 2010;116(3):544–573. doi: 10.1002/cncr.24760. [DOI] [PMC free article] [PubMed] [Google Scholar]
- 3.Platz EA, Willett WC, Colditz GA, Rimm EB, Spiegelman D, Giovannucci E. Proportion of colon cancer risk that might be preventable in a cohort of middle-aged US men. Cancer Causes Control. 2000;11(7):579–588. doi: 10.1023/a:1008999232442. [DOI] [PubMed] [Google Scholar]
- 4.Wei EK, Colditz GA, Giovannucci EL, Fuchs CS, Rosner BA. Cumulative risk of colon cancer up to age 70 years by risk factor status using data from the Nurses’ Health Study. Am J Epidemiol. 2009;170(7):863–872. doi: 10.1093/aje/kwp210. [DOI] [PMC free article] [PubMed] [Google Scholar]
- 5.WCRF/AICR World Cancer Research Fund/American Institute for Cancer Research. Continuous Update Project. Food, Nutrition, Physical Activity, and the Prevention of Colorectal Cancer; Washington, DC: 2011. [Google Scholar]
- 6.Brenner H, Kloor M, Pox CP. Colorectal cancer. Lancet. 2013 doi: 10.1016/S0140-6736(13)61649-9. [DOI] [PubMed] [Google Scholar]
- 7.Gohagan JK, Prorok PC, Hayes RB, Kramer BS. The Prostate, Lung, Colorectal and Ovarian (PLCO) Cancer Screening Trial of the National Cancer Institute: history, organization, and status. Control Clin Trials. 2000;21(6 Suppl):251S–272S. doi: 10.1016/s0197-2456(00)00097-0. [DOI] [PubMed] [Google Scholar]
- 8.Hayes RB, Sigurdson A, Moore L, et al. Methods for etiologic and early marker investigations in the PLCO trial. Mutat Res. 2005;592(1–2):147–154. doi: 10.1016/j.mrfmmm.2005.06.013. [DOI] [PubMed] [Google Scholar]
- 9.Prorok PC, Andriole GL, Bresalier RS, et al. Design of the Prostate, Lung, Colorectal and Ovarian (PLCO) Cancer Screening Trial. Control Clin Trials. 2000;21(6 Suppl):273S–309S. doi: 10.1016/s0197-2456(00)00098-2. [DOI] [PubMed] [Google Scholar]
- 10.International Classification of Diseases for Oncology. Third. Geneva: World Health Organization; 2000. [Google Scholar]
- 11.Evans AM, DeHaven CD, Barrett T, Mitchell M, Milgram E. Integrated, nontargeted ultrahigh performance liquid chromatography/electrospray ionization tandem mass spectrometry platform for the identification and relative quantification of the small-molecule complement of biological systems. Anal Chem. 2009;81(16):6656–6667. doi: 10.1021/ac901536h. [DOI] [PubMed] [Google Scholar]
- 12.Sha W, da Costa KA, Fischer LM, et al. Metabolomic profiling can predict which humans will develop liver dysfunction when deprived of dietary choline. FASEB J. 2010;24(8):2962–2975. doi: 10.1096/fj.09-154054. [DOI] [PMC free article] [PubMed] [Google Scholar]
- 13.Hosmer DW, Lemeshow S, Sturdivant RX. Applied Logistic Regression. 3rd. Wiley; 2013. [Google Scholar]
- 14.Subramanian A, Tamayo P, Mootha VK, et al. Gene set enrichment analysis: a knowledge-based approach for interpreting genome-wide expression profiles. Proc Natl Acad Sci U S A. 2005;102(43):15545–15550. doi: 10.1073/pnas.0506580102. [DOI] [PMC free article] [PubMed] [Google Scholar]
- 15.Jolliffe I. Encyclopedia of Statistics in Behavioral Science. John Wiley & Sons, Ltd; 2005. Principal component analysis. [Google Scholar]
- 16.Murphy G, Devesa SS, Cross AJ, Inskip PD, McGlynn KA, Cook MB. Sex disparities in colorectal cancer incidence by anatomic subsite, race and age. Int J Cancer. 2011;128(7):1668–1675. doi: 10.1002/ijc.25481. [DOI] [PMC free article] [PubMed] [Google Scholar]
- 17.Green J, Czanner G, Reeves G, et al. Menopausal hormone therapy and risk of gastrointestinal cancer: nested case-control study within a prospective cohort, and meta-analysis. Int J Cancer. 2012;130(10):2387–2396. doi: 10.1002/ijc.26236. [DOI] [PubMed] [Google Scholar]
- 18.Sampson JN, Boca SM, Shu XO, et al. Metabolomics in epidemiology: sources of variability in metabolite measurements and implications. Cancer Epidemiol Biomarkers Prev. 2013;22(4):631–640. doi: 10.1158/1055-9965.EPI-12-1109. [DOI] [PMC free article] [PubMed] [Google Scholar]
- 19.Reddy BS, Watanabe K, Weisburger JH, Wynder EL. Promoting effect of bile acids in colon carcinogenesis in germ-free and conventional F344 rats. Cancer Res. 1977;37(9):3238–3242. [PubMed] [Google Scholar]
- 20.McGarr SE, Ridlon JM, Hylemon PB. Diet, anaerobic bacterial metabolism, and colon cancer: a review of the literature. J Clin Gastroenterol. 2005;39(2):98–109. [PubMed] [Google Scholar]
- 21.Bayerdorffer E, Mannes GA, Ochsenkuhn T, Dirschedl P, Wiebecke B, Paumgartner G. Unconjugated secondary bile acids in the serum of patients with colorectal adenomas. Gut. 1995;36(2):268–273. doi: 10.1136/gut.36.2.268. [DOI] [PMC free article] [PubMed] [Google Scholar]
- 22.Ridlon JM, Kang DJ, Hylemon PB. Bile salt biotransformations by human intestinal bacteria. J Lipid Res. 2006;47(2):241–259. doi: 10.1194/jlr.R500013-JLR200. [DOI] [PubMed] [Google Scholar]
- 23.Komichi D, Tazuma S, Nishioka T, Hyogo H, Chayama K. Glycochenodeoxycholate plays a carcinogenic role in immortalized mouse cholangiocytes via oxidative DNA damage. Free Radic Biol Med. 2005;39(11):1418–1427. doi: 10.1016/j.freeradbiomed.2005.07.005. [DOI] [PubMed] [Google Scholar]
- 24.Chen T, Xie G, Wang X, et al. Serum and urine metabolite profiling reveals potential biomarkers of human hepatocellular carcinoma. Mol Cell Proteomics. 2011;10(7):M110 004945. doi: 10.1074/mcp.M110.004945. [DOI] [PMC free article] [PubMed] [Google Scholar]
- 25.Qiu Y, Cai G, Su M, et al. Serum metabolite profiling of human colorectal cancer using GC-TOFMS and UPLC-QTOFMS. J Proteome Res. 2009;8(10):4844–4850. doi: 10.1021/pr9004162. [DOI] [PubMed] [Google Scholar]
- 26.Chan EC, Koh PK, Mal M, et al. Metabolic profiling of human colorectal cancer using high-resolution magic angle spinning nuclear magnetic resonance (HR-MAS NMR) spectroscopy and gas chromatography mass spectrometry (GC/MS) J Proteome Res. 2009;8(1):352–361. doi: 10.1021/pr8006232. [DOI] [PubMed] [Google Scholar]
- 27.Qiu Y, Cai G, Su M, et al. Urinary metabonomic study on colorectal cancer. J Proteome Res. 2010;9(3):1627–1634. doi: 10.1021/pr901081y. [DOI] [PubMed] [Google Scholar]
- 28.Bertini I, Cacciatore S, Jensen BV, et al. Metabolomic NMR fingerprinting to identify and predict survival of patients with metastatic colorectal cancer. Cancer Res. 2012;72(1):356–364. doi: 10.1158/0008-5472.CAN-11-1543. [DOI] [PubMed] [Google Scholar]
- 29.Nishiumi S, Kobayashi T, Ikeda A, et al. A novel serum metabolomics-based diagnostic approach for colorectal cancer. PLoS One. 2012;7(7):e40459. doi: 10.1371/journal.pone.0040459. [DOI] [PMC free article] [PubMed] [Google Scholar]
- 30.Ritchie SA, Ahiahonu PW, Jayasinghe D, et al. Reduced levels of hydroxylated, polyunsaturated ultra long-chain fatty acids in the serum of colorectal cancer patients: implications for early screening and detection. BMC Med. 2010;8:13. doi: 10.1186/1741-7015-8-13. [DOI] [PMC free article] [PubMed] [Google Scholar]
- 31.Monleon D, Morales JM, Barrasa A, Lopez JA, Vazquez C, Celda B. Metabolite profiling of fecal water extracts from human colorectal cancer. NMR Biomed. 2009;22(3):342–348. doi: 10.1002/nbm.1345. [DOI] [PubMed] [Google Scholar]
- 32.Ma YL, Qin HL, Liu WJ, et al. Ultra-high performance liquid chromatography-mass spectrometry for the metabolomic analysis of urine in colorectal cancer. Dig Dis Sci. 2009;54(12):2655–2662. doi: 10.1007/s10620-008-0665-4. [DOI] [PubMed] [Google Scholar]
- 33.Lean CL, Newland RC, Ende DA, Bokey EL, Smith IC, Mountford CE. Assessment of human colorectal biopsies by 1H MRS: correlation with histopathology. Magn Reson Med. 1993;30(5):525–533. doi: 10.1002/mrm.1910300502. [DOI] [PubMed] [Google Scholar]
- 34.Denkert C, Budczies J, Weichert W, et al. Metabolite profiling of human colon carcinoma–deregulation of TCA cycle and amino acid turnover. Mol Cancer. 2008;7:72. doi: 10.1186/1476-4598-7-72. [DOI] [PMC free article] [PubMed] [Google Scholar]
- 35.Piotto M, Moussallieh FM, Dillmann B, et al. Metabolic characterization of primary human colorectal cancers using high resolution magic angle spinning 1H magnetic resonance spectroscopy. Metabolomics. 2009;5(3):292–301. [Google Scholar]
- 36.Ho JE, Larson MG, Vasan RS, et al. Metabolite profiles during oral glucose challenge. Diabetes. 2013;62(8):2689–2698. doi: 10.2337/db12-0754. [DOI] [PMC free article] [PubMed] [Google Scholar]
- 37.Robertson DG, Ruepp SU, Stryker SA, et al. Metabolomic and transcriptomic changes induced by overnight (16 h) fasting in male and female Sprague-Dawley rats. Chem Res Toxicol. 2011;24(4):481–487. doi: 10.1021/tx200074f. [DOI] [PubMed] [Google Scholar]
- 38.Ogino S, Chan AT, Fuchs CS, Giovannucci E. Molecular pathological epidemiology of colorectal neoplasia: an emerging transdisciplinary and interdisciplinary field. Gut. 2011;60(3):397–411. doi: 10.1136/gut.2010.217182. [DOI] [PMC free article] [PubMed] [Google Scholar]