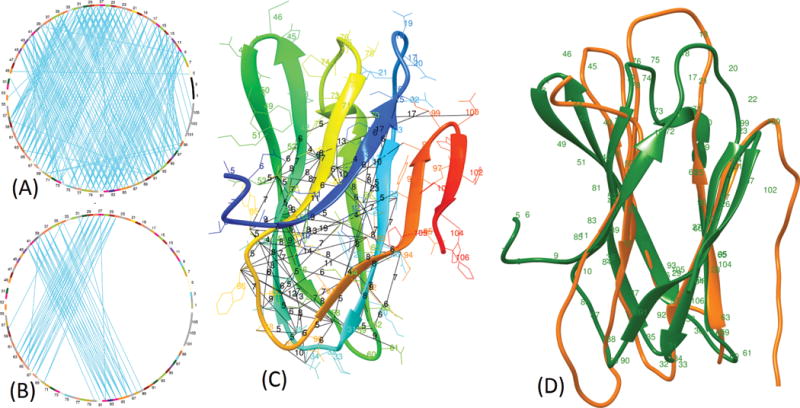
Figure 3.

Visualization of the top L contacts predicted using MULTICOM-CONSTRUCT and reconstructed model for the domain T0900-D1. Chord diagram for the long-range contacts in the native structure are shown in (A) and the top L contacts predicted by MULTICOM-CONSTRUCT shown in (B). MULTICOM-CONSTRUCT predicted contacts are highlighted in the native structure with actual distances between the residues shown in black (C) and the reconstructed structure (in orange) superimposed with the native structure (in green) is shown in (D).
