Abstract
Macrophages infiltrating the allografts are heterogeneous, consisting of pro-inflammatory (M1 cells) as well as anti-inflammatory and fibrogenic phenotypes (M2 cells); they affect transplant outcomes via diverse mechanisms. Herein, we found that macrophage polarization into M1 and M2 subsets was critically dependent on TRAF6 and mTOR, respectively. In a heart transplant model we showed that macrophage-specific deletion of TRAF6 (LysMCreTraf6fl/fl) or mTOR (LysMCreMtorfl/fl) did not affect acute allograft rejection. However, treatment of LysMCreMtorfl/fl recipients with CTLA4-Ig induced long-term allograft survival (>100 days) without histological signs of chronic rejection, whereas the similarly treated LysMCreTraf6fl/fl recipients developed severe transplant vasculopathy (chronic rejection). The presentation of chronic rejection in CTLA4-Ig treated LysMCreTraf6fl/fl mice was similar to that of CTLA4-Ig treated wild type B6 recipients. Mechanistically, we found that the graft infiltrating macrophages in LysMCreMtorfl/fl recipients expressed high levels of PD-L1, and PD-L1 blockade readily induced rejection of otherwise survival grafts in the LysMCreMtorfl/fl recipients. Our findings demonstrate that targeting mTOR-dependent M2 cells is critical in preventing chronic allograft rejection and that graft survival under such conditions is dependent on the PD-1/PD-L1 co-inhibitory pathway.
Introduction
Chronic allograft rejection is characterized primarily by arteriosclerosis and interstitial fibrosis in the grafts, and it remains a major cause for the loss of transplanted organs over time (1, 2). This type of rejection often occurs in the presence of commonly used immunosuppression drugs which potently suppress the activation of T cells, and this led to the belief that other cell types, including innate immune cells are likely critical in chronic allograft rejection (3). Currently, there are limited means to intervene therapeutically in preventing chronic graft rejection. Hence, there is a practical need in identifying the identity as well as regulators of innate immune cells in triggering chronic damage to the transplanted organs.
In the clinical setting, the intensity of macrophage infiltration in the grafts is correlated with the increased incidence of chronic rejection and poor transplant outcomes (4, 5). In multiple animal models, macrophages represent a major innate cell type in chronically rejected allografts (6), and partial depletion of macrophages by a chemical compound carrageenan leads to a 70% reduction in the development of cardiac allograft vasculopathy (CAV), a typical form of chronic rejection of heart transplants (7). These data suggest that macrophages infiltrating the grafts are capable of shaping the alloimmune responses toward chronic rejection. However, certain macrophage subsets in the grafts, such as those expressing the surface markers TIM-4 and DC-SIGN, can also promote allograft acceptance by limiting the allogeneic T cell response or by boosting the frequency of T regulatory cells (Treg) (8-10). In fact, macrophages are an extremely heterogeneous and dynamic cell type (6, 11); they are highly adaptive to the environmental cues and constantly adjusting their phenotypes and functions. This issue has been studied in considerable depth in cancer models, but the impact of macrophage subpopulations on transplant outcomes, especially on chronic graft loss, remains poorly defined.
Conceptually, macrophages could develop into functionally diverse subsets, ranging from pro-inflammatory to anti-inflammatory cell types, with M1 and M2 cells represent the extreme ends of a broad spectrum (12, 13). The induction of M1 cells requires TLR stimulation or under conditions of Type 1 immunity (12), those signals converge on NF-κB activation, which drives M1 cells to express iNOS and produce potent inflammatory cytokines (14). Under M1 cell-polarizing conditions, the tumor necrosis factor receptor-associated factor 6 (TRAF6) acts as a critical adaptor protein in the activation of the NF-kB pathway in M1 cells (15). On the other hand, M2 polarization depends on IL-4 and IL-13, and these cytokines signal through the JAK/STAT pathway, which usually leads to the activation of mTOR and other downstream signaling events (16). In fact, pharmacological inhibition of mTOR Complex 1 (mTORC1) by rapamycin or specific deletion of mTORC2 in macrophages can markedly reduce IL-4/IL-13-mediated M2 polarization (17, 18). Therefore, TRAF6 and mTOR are pivotal signaling molecules in orchestrating M1 and M2 polarization.
We and others have previously reported that macrophage infiltrating the cardiac allografts displayed an M2 phenotype during chronic allograft rejection (6, 19). Thus, understanding the regulatory mechanisms that favor M2 induction in transplant models is an important and clinically relevant issue. In the present study, we generated mouse models in which the TRAF6 and mTOR were selectively deleted in monocytes/macrophages and used such conditional knockout mice as transplant recipients to examine the role of macrophage subpopulations in chronic allograft rejection. We found that conditional deletion of TRAF6 and mTOR in macrophages differentially affected the induction of M1 and M2 cells. Furthermore, treatment of TRAF6-deleted mice with CTLA4-Ig induced prominent chronic rejection of heart allografts, whereas treatment of mTOR-deleted mice produced long-term heart allograft survival, free of histological signs of chronic graft rejection. Interestingly, graft survival in CTLA4-Ig treated conditional mTOR-deleted mice was dependent on the PD-1/PD-L1 pathway. These results highlight the importance of the mTOR-M2-PD-L1 regulatory axis in the control of transplant outcomes under costimulatory blockade conditions.
Materials and Methods
Mice
C57BL/6 (B6; H-2b), BALB/c (H-2d), LysMCre (B6.129P2-Lyz2tm1(Cre)Ifo/J) and Mtorfl/fl (B6.129S4-Mtortm1.2Koz/J) mice were purchased from the Jackson Laboratory (Bar Harbor, ME). Traf6fl/fl mice have been previously described (20). LysMCreTraf6fl/fl and LysMCreMtorfl/fl mice were generated by crossing Traf6fl/fl and Mtorfl/fl mice with LysMCre mice, respectively, and confirmed by genotyping. All animal care and experiments were approved by the Institutional Animal Care and Use Committee at the Houston Methodist Research Institute in Houston, Texas.
Reagents
Fluorochrome-conjugated antibodies for mouse CD16/32 (clone 93), CD11b (M1/70), F4/80 (BM8), Ly6C (HK1.4), Ly6G (1A8), CD45 (30-F11), CD206 (C068C2), DC-SIGN (LWC06), PD-L1 (10F.9G2), CD4 (GK1.4), CD8α (53-6.7) and Foxp3 (FJK-16s) were purchased from BD Pharmingen (San Diego, CA), eBiosciences (San Diego, CA), or BioLegend (San Diego, CA). Immunoblotting antibodies for TRAF6 (D-10), mTOR (catalog 2972), NOS2 (CSNFT), Arg-1 (AF5868), and β-actin (13E5) were purchased from Cell Signaling Technologies (Danvers, MA), eBiosciences, R & D systems (Minneapolis, MN) and Santa Cruz (Dallas, TX). Zombie Aqua viability kit was purchased from Biolegend. Mouse recombinant macrophage colony-stimulating factor (M-CSF), IFN-γ, IL-2, IL-4, and IL-13 were obtained from Peprotech (Rocky Hill, NJ). Lipopolysaccharide (LPS) was purchased from Sigma-Aldrich (St. Louis, MO). Human recombinant CTLA4-Ig was purchased from Bristol-Myers-Squibb (New York, NY). Anti-PD-L1 mAb (10F.9G2) was purchased from BioXCell (West Lebanon, NH).
Immunoblotting analysis
Protein extracts from bone marrow-derived macrophages (BMDMs) and T cells were boiled, resolved by sodium dodecyl sulfate polyacrylamide gels (Bio-Rad Laboratories, Hercules, CA), and transferred onto polyvinylidene difluoride membranes (Millipore, Billerica, MA). The membranes were blocked in Tris-buffered saline containing 0.5% Tween 20 (TBST) and 5% bovine serum albumin, washed and incubated overnight with antibodies in TBST, and then washed and incubated for 1 h with appropriate horseradish peroxidase-coupled secondary antibodies. The specific bands were visualized using the enhanced chemiluminescence reagents (Thermo Scientific, Waltham, MA). For all immunoblotting experiments, β-actin was used as a loading control.
Quantitative reverse transcriptase polymerase chain reaction (RT-PCR)
Total RNA was extracted from cells using the RNeasy Mini Kit (Qiagen, Valencia, CA), and reverse-transcription was performed using the cDNA synthesis kit (Applied Biosystems, Foster City, CA). The reaction protocol included a 10-min incubation time at 95°C. The amplification cycles consisted of 95°C for 10 s, 60°C for 20 s and 72°C for 20 s for each cycle for a total of 40 cycles, followed by a final elongation at 72°C for 5 min. All primers used for the studies are listed in Table 1. Quantitative RT-PCR was performed with a Bio-Rad PCR machine CFX96 (Hercules, CA) using the SYBR Green mix (Bio-Rad). All data were expressed as the ratio between the expressions of the target gene to HPRT. Fold changes in target gene expression were analyzed by CFX Manager Software (Bio-Rad) using the delta/delta CT method.
Table 1. Sequences of primer sets used for Real-time Quantitative PCR.
| Forward primer | Reverse primer | |
|---|---|---|
| NOS2 | 5′-gtt ctc agc cca aca ata caa ga-3′ | 5′-gtg gac ggg tcg atg tca c-3′ |
| Tnfa | 5′-gcc tct tct cat tcc tgc ttg-3′ | 5′-ggg tct ggg cca tag aac tg-3′ |
| Il1b | 5′-aag ggc tgc ttc caa acc ttt gac-3′ | 5′-ata ctg cct gcc tga agc tct tgt-3′ |
| ARG1 | 5′-ctc caa gcc aaa gtc ctt aga g-3′ | 5′-agg agc tgt cat tag gga cat c-3′ |
| CD206 | 5′-ttg gac gga tag atg gag gg-3′ | 5′-cca ggc agt tga gga ggt tc-3′ |
| Chi3l3 | 5′-tca ctt aca cac atg agc aag ac-3′ | 5′- cgg ttc tga gga gta gag acc a-3′ |
| DC-sign | 5′-gaa gag cag aac ttt cta-3′ | 5′-tca tga aac tga gag tca gag-3′ |
| PD-L1 | 5′-caa tga gaa tgc tag atg tg-3′ | 5′-tcc atc ttg agt ctt tgg ac-3′ |
| PD-L2 | 5′-gta ccg ttg cct ggt cat ct-3′ | 5′- gcc agg aca ctt ctg cta gg-3′ |
| Fgr2b | 5′-caa aac tga ggc tga gaa tac-3′ | 5′-aat atc tac agc atc cct tgg-3′ |
| Nrf2 | 5′-cat tcc cga att aca gtg tc-3′ | 5′-gga gat cga tga gta aaa atg g-3′ |
| Sirpa | 5′-aaa taa ccc aga tcc agg ac-3′ | 5′-ttg cat att ctg tgt ggt tg-3′ |
| CD300Lg | 5′-gaa cct cag tca gtc tac ag-3′ | 5′-tct gca att aca cag aga tg-3′ |
| Clec12a | 5′-aca gct gtt att ctc aac tc-3′ | 5′-taa att cca gca cat cct tg-3′ |
| Hif1a | 5′-cga tga cac aga aac tga ag-3′ | 5′-gaa ggt aaa gga gac att gc-3′ |
| Lair1 | 5′-ctg agc ctt ata aaa cag agg-3′ | 5′-caa gat gta tct gag gtt gg-3′ |
| Pirb | 5′-tca gga aag atg tcc aga aag aga-3′ | 5′-gct gtt cag ctc cac tcc at-3′ |
| Trem2 | 5′-tca tct ctt ttc tgc act tc-3′ | 5′-tca taa gta cat gac acc ctc-3′ |
| Trem3 | 5′-cta cct ctc tcc tga caa tg-3′ | 5′-cag aga aag aca aac agg ac-3′ |
| Vtcn1 | 5′-cct tga gta taa gac cgg ag-3′ | 5′-tgg tca cat tct cag agt tc-3′ |
| ICOSLg | 5′-gac aat agc cta ata gac acg-3′ | 5′-ttt cca gtg aaa ctt tct-3′ |
| Siglec-1 | 5′-cta gac ttc tat gct aat gtgg-3′ | 5′-gga tcc ttc cag aag tag ag-3′ |
| HPRT | 5′-agt aca gcc cca aaa tgg tta-3′ | 5′-ctt agg ctt tgt att tgg ctt t-3′ |
In vitro M1 and M2 macrophage polarization
Femur and tibia were harvested from B6 mice, LysMCre Traf6fl/fl or LysMCreMtorfl/fl mice. Bone marrow was isolated, flushed with PBS, lysed with ACK lysis buffer (BD Bioscience), and then cultured in Dulbecco's modified Eagle's medium (containing 10% heat-inactivated fetal bovine serum, 100 U/mL penicillin and 100 μg/mL streptomycin) supplemented with 10 ng/mL murine M-CSF at 37°C, 5% CO2. The medium was replenished on days 3 and 6. On day 6, the obtained BMDMs were stimulated for 24 h with 100 ng/mL LPS and 20 ng/mL IFN-γ for M1 polarization or stimulated with 20 ng/mL IL-4 and 20 ng/mL IL-13 for M2 polarization. Cells were harvested at different time points during and after polarization, and assessed for the expression of M1 and M2 associated markers.
Heterotopic Cardiac Transplantation
The donor heart grafts were harvested from BALB/c mice and then transplanted into the abdominal cavity of recipient mice by anastomosing the ascending aorta and pulmonary artery of the graft end-to-side to the recipient's abdominal aorta and vena cava as previously described (19). Graft survival was monitored by daily trans-abdominal palpation, and graft rejection was defined as complete cessation of palpable heartbeats, and further verified by laparotomy. Recipient mice were left untreated or administered intraperitoneally with 250 μg CTLA4-Ig on days -1 and 2 post-transplantation, or with a course of anti-PD-L1 mAb (500 μg mAb on day 0 and 250 μg mAb on days 2, 4, 6, 8, and 10 post-transplantation) as previously described (21).
Isolation of graft-infiltrating cells, flow cytometry and sorting
Mice bearing heart allografts were sacrificed on days 14 and 28 post-transplant. Grafts were removed and chopped into pieces, washed with PBS, and then digested at 37°C for 30 min in RPMI containing 300 U/mL type II collagenase (Worthington, Lakewood, NJ) and 40 U/mL DNase I (Roche, Indianapolis, IN) before pressing through a 40-μm filter. The collected cells were washed and Fc receptors were blocked with an anti-mouse CD16/CD32 Ab. Cells were then stained for Zombie Aqua cell dye and various fluorochrome-conjugated antibodies, followed by analysis with a BD LSRFortessa cell analyzer (BD Biosciences). Intracellular staining of Foxp3 was performed using the Foxp3 Staining Kit (eBioscience). Data were analyzed by using the FlowJo software (FlowJo LLC, Ashland, OR). For assessing the gene expression in graft-infiltrating macrophages, CD45+CD11b+F4/80+ cells were sorted with a high-speed cell sorter FACSaria (BD Biosciences) prior to quantitative RT-PCR analysis.
Tissue histology and morphometric analysis of graft arteries
The heart grafts were harvested, formalin fixed, and paraffin embedded. Tissue blocks were sectioned at 5 μm. Slides were baked at 60°C for 1 h, de-paraffinized and rehydrated, and then stained with hematoxylin and eosin (H&E) or Verhoeff-Van Gieson (VVG) stain. The tissue sections were evaluated by light microscopy. For morphometric analysis of coronary arteries from the tissue sections, images of arteries larger than 85 μm in diameter were captured digitally with a light microscope (Nikon Eclipse 80i; Nikon, Tokyo, Japan). ImageJ software (NIH, Bethesda, MD) was used to calculate areas of lumen and intima of each artery in VVG stained images. Neointimal index (NI) was used to indicate the degree of lumen occlusion of each artery, which was calculated by neointimal volume (intimal area value − luminal area value)/stent volume (intimal area value) × 100, as previously described (22).
Statistical analysis
Results are represented as mean ± s.e.m. and analyzed with Prism software (ver. 5.0c, GraphPad). Graft survival was compared using the log-rank test. For ex vivo experiments, the significance of between multiple groups was accessed by ANOVA with Dunnett's test. Other measurements were performed using unpaired Student's t-test. P values less than 0.05 were considered statistically significant.
Results
The signaling molecules TRAF6 and mTOR in regulation of M1 and M2 polarization
To generate conditional cell type-specific knockout mice, we crossed Traf6fl/fl and Mtorfl/fl mice with the LysMCre mice in which the Cre recombinase is under the control of the myeloid cell-specific lysozyme M promoter to selectively delete TRAF6 or mTOR in macrophages. LysMCreTraf6fl/fl and LysMCreMtorfl/fl mice were healthy, born at the expected Mendelian frequencies, and did not exhibit overt abnormalities. Western blot analysis confirmed that TRAF6 and mTOR were selectively ablated in bone marrow-derived macrophages (BMDMs), but not in T cells, of LysMCreTraf6fl/fl and LysMCreMtorfl/fl mice (Figure 1), thus demonstrating a cell type-specific deletion of TRAF6 and mTOR in vivo.
Figure 1. Conditional deletion of the signaling molecules TRAF6 and mTOR in macrophages in LysMCreTraf6fl/fl and LysMCreMtorfl/fl mice.
(A) Immunoblotting analysis of TRAF6 expression in BMDMs (Mφ) derived from Wt B6 and LysMCreTraf6fl/fl mice, or in T cells (T) isolated from LysMCreTraf6fl/fl mice. (B) Immunoblotting analysis of mTOR expression in BMDMs derived from Wt B6 and LysMCreMtorfl/fl mice, or in T cells isolated from LysMCreMtorfl/fl mice. Data are representative of three independent experiments.
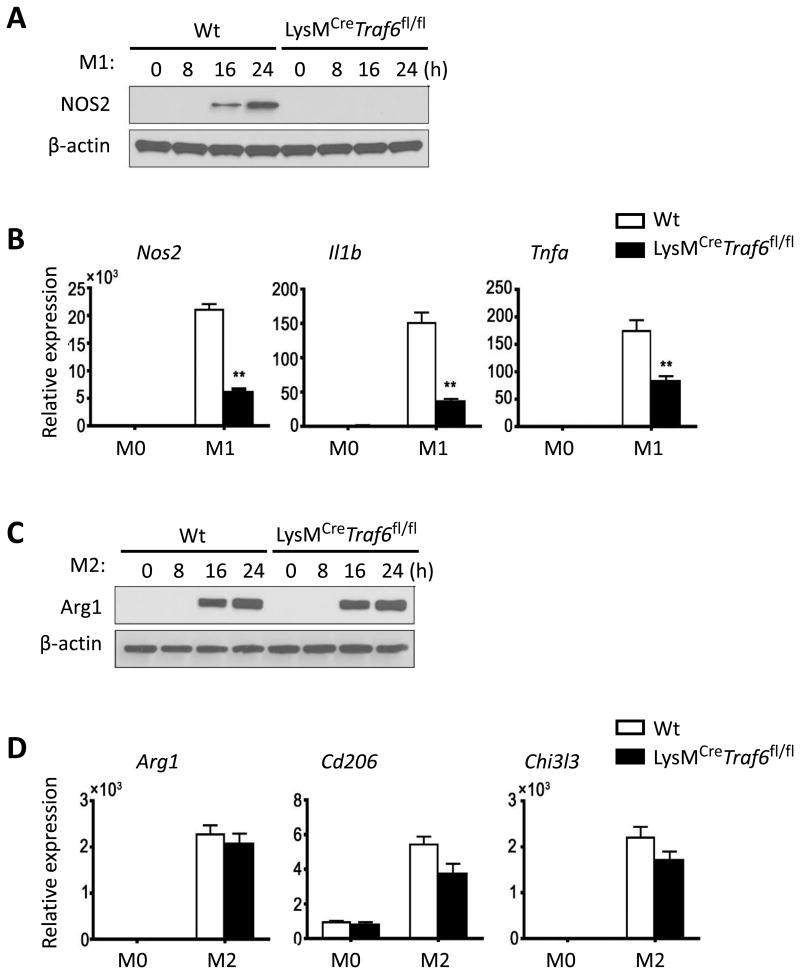
We then examined whether conditional deletion of TRAF6 and mTOR in macrophages would affect M1 and M2 polarization in vitro. As shown in Figure 2, BMDMs from wild type (Wt) B6 mice readily became M1 cells upon LPS and IFN-γ stimulation, as shown by the induction of NOS2 expression (Fig 2A, Western blot), as well as expression of Il1β and Tnfα (Fig 2B, Real-time PCR). Interestingly, BMDMs from LysMCreTraf6fl/fl mice were highly resistant to M1 polarization, as stimulation of such cells with LPS and IFN-γ failed to induce expression of NOS2, nor expression of M1-associated inflammatory cytokine genes, as assessed by Western blot and Real-time PCR (Figs 2A and 2B). Under conditions of M2 polarization in which BMDMs were stimulated with IL-4 and IL-13, BMDMs from both Wt B6 and LysMCreTraf6fl/fl mice were readily polarized into M2 cells. As shown in Figs 2C and 2D, stimulation of BMDMs with IL-4 and IL-13 strongly induced the expression of Arginase-1 (Arg1), a classical M2 marker (23), as well as expression of other M2-associated markers Cd206 and Chi3l3. The expression pattern of such M2 markers was remarkably similar between Wt BMDMs and LysMCreTraf6fl/fl BMDMs (Figures 2C and 2D). These data suggest that conditional deletion of TRAF6 in macrophages preferentially impairs M1 polarization.
Figure 2. Conditional deletion of TRAF6 in macrophages selectively inhibits M1 polarization.
BMDMs derived from Wt B6 and LysMCreTraf6fl/fl mice were stimulated with LPS and IFN-γ for M1 polarization, or stimulated with IL-4 and IL-13 for M2 polarization. Non-polarized BMDMs (M0) were used as controls. (A) NOS2 protein expression in macrophages at indicated time points after initial stimulation with LPS and IFN-γ. (B) Nos2, Tnfa, and Il1b gene expression in macrophages at 24 h after initial stimulation with LPS and IFN-γ. (C) Arg1 protein expression in macrophages at indicated time points after initial stimulation with IL-4 and IL-13. (D) Arg1, CD206, and Chi3l3 gene expression in macrophages at 24 h after initial stimulation with IL-4 and IL-13. Data are representative of three independent experiments. Data are mean ± s.e.m. ** p<0.01; unpaired student's t-test.
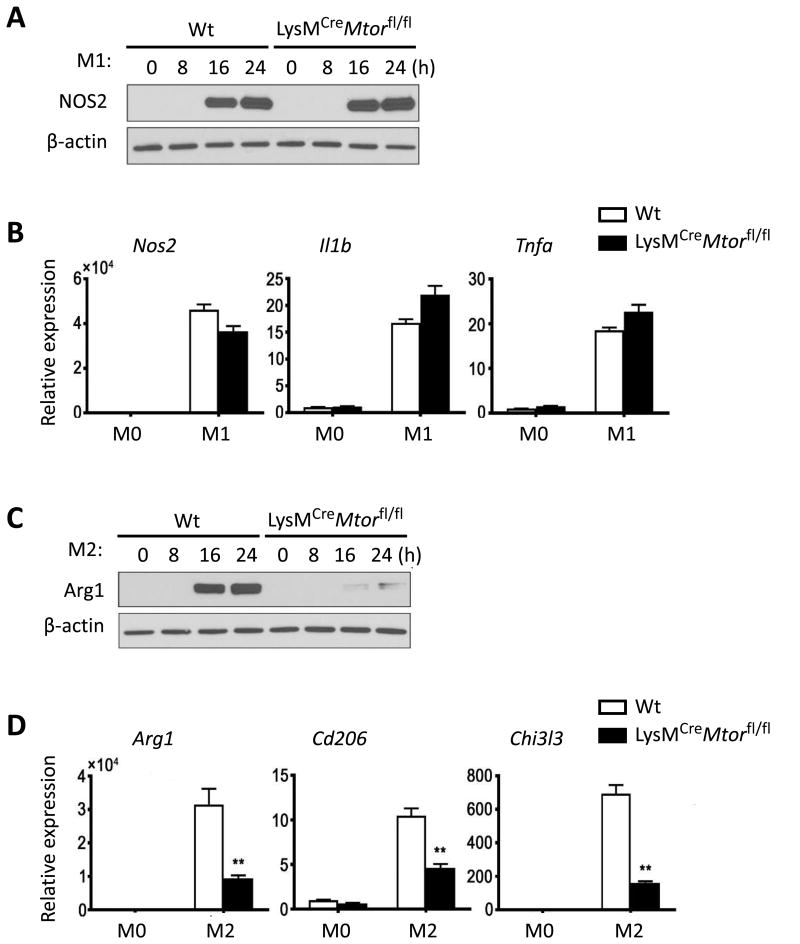
Similarly, side-by-side comparison of M1 and M2 polarization from BMDMs of Wt B6 and LysMCreMtorfl/fl mice revealed that conditional deletion of mTOR in macrophages impaired M2 induction, as induction of Arg1, Cd206, and Chi3l3 by IL-4 and IL-13 was strongly inhibited, whereas induction of M1 cells in response to LPS and IFN-γ was not affected (Figure 3). As compared to Wt B6 BMDMs, BMDMs from LysMCreMtorfl/fl mice expressed similar levels of NOS2, Il1β, and Tnfα in response to LPS and IFN-γ stimulation, in spite of impaired M2 polarization (Figure 3). Thus, conditional deletion of mTOR in macrophages seems to selectively affect M2 induction.
Figure 3. Deletion of mTOR in macrophages selectively inhibits M2 polarization.
BMDMs derived from Wt B6 and LysMCreMtorfl/fl mice were stimulated with LPS and IFN-γ for M1 polarization, or stimulated with IL-4 and IL-13 for M2 polarization. Non-polarized BMDMs (M0) were used as controls. (A) NOS2 protein expression in macrophages at indicated time points after initial stimulation with LPS and IFN-γ. (B) Nos2, Tnfa, and Il1b gene expression in macrophages at 24 h after initial stimulation with LPS and IFN-γ. (C) Arg1 protein expression in macrophages at indicated time points after initial stimulation with IL-4 and IL-13. (D) Arg1, CD206, and Chi3l3 gene expression in macrophages at 24 h after initial stimulation with IL-4 and IL-13. Data are representative of three independent experiments. Data are mean ± s.e.m. ** p < 0.01; unpaired student's t-test.
Conditional deletion of mTOR or TRAF6 in macrophages does not alter acute allograft rejection
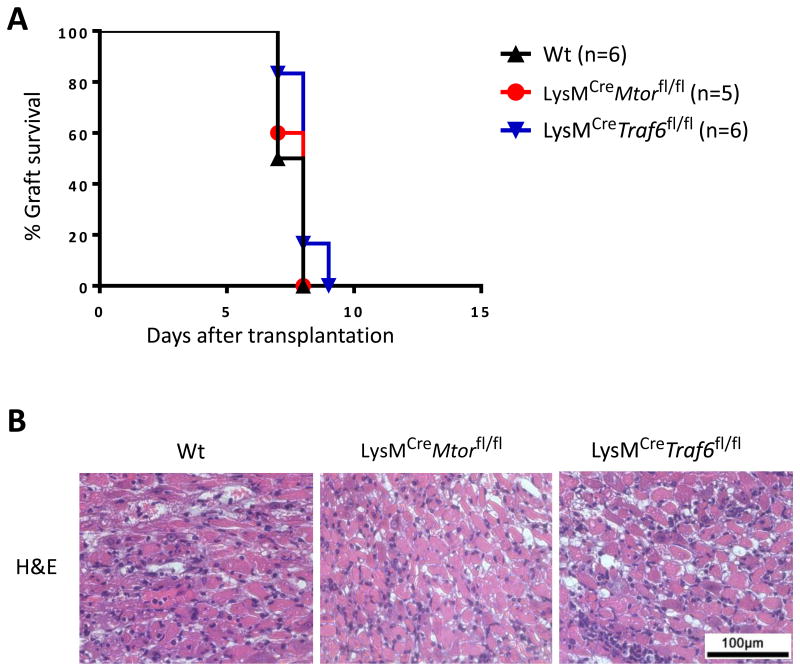
To determine the potential impact of macrophage-specific deletion of TRAF6 and mTOR on allograft rejection, we transplanted the fully MHC-mismatched Balb/c heart allografts into LysMCreMtorfl/fl and LysMCreTraf6fl/fl recipients, and graft survival was compared with that transplanted into Wt B6 recipients in the absence of any immunosuppression. As shown in Figure 4A, all the heart allografts were acutely rejected by all recipient groups with similar kinetics (B6, MST = 7.5 ± 0.55 days; LysMCreMtorfl/fl, MST = 8 ± 0.55 days; LysMCreTraf6fl/fl, MST = 8 ± 0.63 days). Histologic analysis revealed that allografts from all groups displayed severe myocardial cellular infiltration and myocyte damage (Figure 4B). Thus, conditional deletion of mTOR or TRAF6 in macrophages alone does not affect the process of acute allograft rejection.
Figure 4. Conditional deletion of mTOR and TRAF6 in macrophages and the kinetics of acute allograft rejection.
BALB/c hearts were transplanted into Wt B6, LysMCreMtorfl/fl, and LysMCreTraf6fl/fl. (A) Percentage of heart allograft survival after transplantation. (B) Representative images of H&E stained sections of heart allografts harvested from each groups at time of rejection. Scale bar = 100 μm; ×400 magnification.
Conditional deletion of mTOR, but not TRAF6, in macrophages inhibits chronic rejection in CTLA4-Ig treated mice
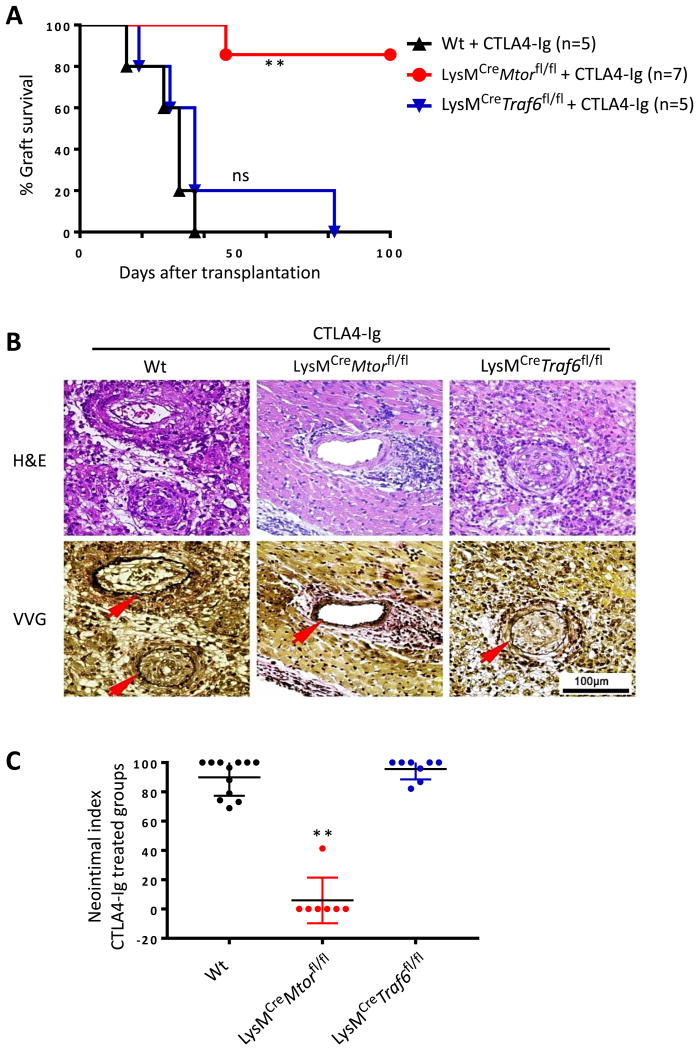
To further examine whether conditional deletion of TRAF6 and mTOR in macrophages would affect transplant outcomes in the presence of immunosuppression, we again transplanted the Balb/c heart allografts into Wt B6, LysMCreTraf6fl/fl, and LysMCreMtorfl/fl mice, and the recipient mice were treated with CTLA4-Ig (250 ug i.p. on days -1 and 2 post-transplant). Graft survival was compared among different groups. As shown in Figure 5A, treatment of Wt B6 recipients with CTLA4-Ig significantly prolonged the heart allograft survival (MST = 32 ± 8.38 days), as compared to untreated controls (MST = 7.5 ± 0.55 days, Fig 4). Histologically, all heart transplants developed chronic rejection in CTLA4-Ig treated mice, characterized by perivascular infiltration and prominent neointima formation (Fig 5B). Similar findings were observed in CTLA4-Ig treated LysMCreTraf6fl/fl recipients in terms of graft survival (MST = 37 ± 24.19 days) and development of chronic graft rejection (Figs 5A and 5B). Interestingly, treatment of LysMCreMtorfl/fl recipients with CTLA4-Ig induced long-term allograft survival, and six of seven, mice accepted the heart transplants for over 100 days. Histological assessments of the heart allografts revealed minimal vascular injury and complete absence of neointima formation (Figs 5A and 5B). Quantitative analysis of neointima index in all CTLA4-Ig treated groups showed strong inhibition of chronic rejection only in conditional mTOR deleted mice (Fig 5C). Therefore, conditional deletion of mTOR, but not TRAF6, in macrophages inhibits transplant vasculopathy and promotes long-term graft acceptance upon costimulatory blockade treatment.
Figure 5. Conditional deletion of mTOR, but not TRAF6, in macrophages inhibits chronic allograft rejection following CLA4-Ig treatment.
Wt B6, LysMCreMtorfl/fl, and LysMCreTraf6fl/fl mice were transplanted with BALB/c hearts, and treated with CTLA4-Ig. (A) Percentage of heart allograft survival after transplantation. ** p < 0.01; log-rank test. (B) Representative images of H&E and VVG stained sections of heart allografts harvested from CTLA4-Ig treated groups at day 28 post-transplant. Scale bar = 100 μm; ×400 magnification. (C) Morphometric quantification of CAV development (neointimal index) in CTLA4-Ig treated groups at day 28 after transplantation. Four grafts per group were analyzed. ** p < 0.01; ANOVA test.
Conditional deletion of mTOR in macrophages expands Foxp3+ Tregs in the allografts
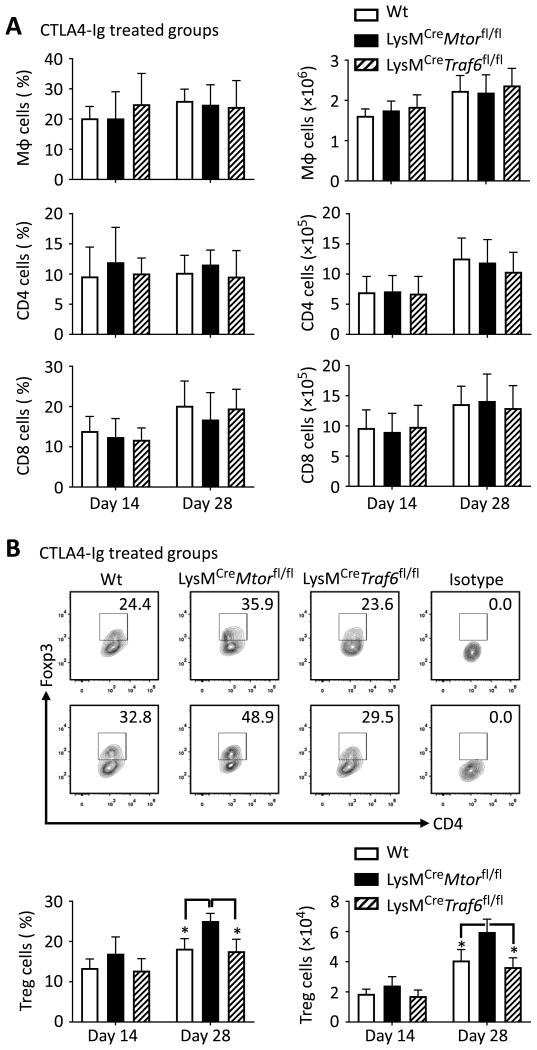
To define the mechanisms by which deletion of mTOR in macrophage promotes long-term allograft survival, we assessed the phenotype of graft-infiltrating cells in CTLA4-Ig treated mice 14 and 28 days post-transplantation. As shown in Fig 6A, among CD45+ cells recovered for heart allografts, the relative percentage and the absolute numbers of macrophages (CD11b+F4/80+), CD4+ T cells, and CD8+ T cells were not significantly different among CTLA4-Ig treated Wt B6, LysMCreMtorfl/fl, and LysMCreTraf6fl/fl recipients. However, the intragraft Foxp3+ Treg cells were significantly increased in CTLA4-Ig treated LysMCreMtorfl/fl recipients in either relative percentage or in absolute cell number, as compared to those from CTLA4-Ig treated Wt B6 and LysMCreTraf6fl/fl recipients (Figure 6B). These data demonstrate that conditional deletion of mTOR in macrophages (not TRAF6) promotes Foxp3+ Tregs in the grafts following costimulatory blockade treatment.
Figure 6. Increased accumulation of Foxp3+ Tregs in graft-infiltrating cells in transplant recipients with conditional deletion mTOR in macrophages.
BALB/c heart allografts were harvested from CTLA4-Ig treated Wt B6, LysMCreMtorfl/fl, and LysMCreTraf6fl/fl mice 14 and 28 days post-transplantation. Graft infiltrating cells were isolated from four mice per group, followed by flow cytometry analysis. (A) Shown are percentages (in CD45+ cells) and numbers of macrophages, CD4+ and CD8+ T cells in grafts. (B) Representative contour plots (top two rows) display percentages of Foxp3-expressing Tregs in grafts, gated on CD4 population. Bar graphs (bottom) exhibit the percentages (in CD4+ cells) and numbers of Foxp3-expressing Treg cells in grafts. Data are mean ± s.e.m. * p < 0.05; ANOVA statistical test.
Conditional deletion mTOR in recipient mice induces increased PD-L1 expression by graft infiltrating macrophages
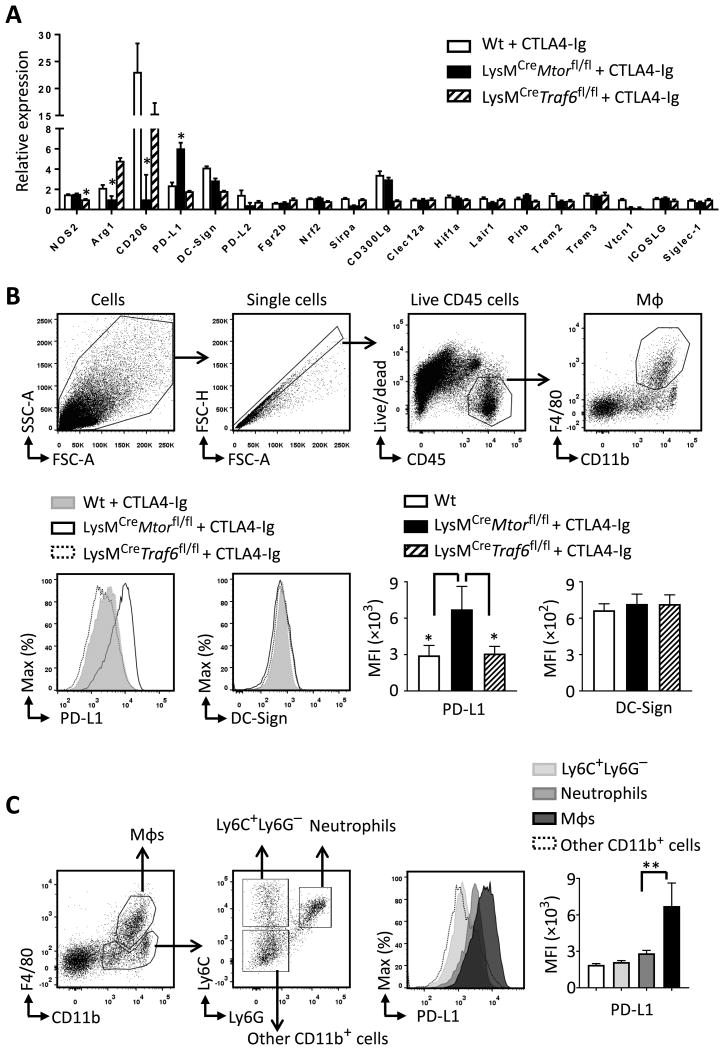
We isolated graft-infiltrating macrophages from CTLA4-Ig treated Wt B6, LysMCreTraf6fl/fl, and LysMCreMtorfl/fl recipients 14 days post-transplantation, and performed gene expression analysis using PCR-based gene array method. We found that as compared to Wt control mice, expression of the M1 marker gene (NOS2) in LysMCreTraf6fl/fl recipients was significantly decreased, while expression of the M2 marker genes (Arg1, Cd206) was markedly reduced in LysMCreMtorfl/fl recipients (Fig 7A), though the number of graft-infiltrating macrophages was similar among all groups (Fig 6A). This is consistent with the in vitro data where deletion of TRAF6 and mTOR in macrophages impairs M1 and M2 polarization, respectively.
Figure 7. Graft infiltrating macrophages in conditional mTOR deleted mice express high levels of PD-L1.
Graft infiltrating cells were isolated from CTLA4-Ig treated Wt B6, LysMCreMtorfl/fl, and LysMCreTraf6fl/fl mice at day 14 post-transplant. (A) Relative expression of indicated genes in graft-infiltrating macrophages isolated from indicated groups. (B) Dot plots in the top row show the gating strategy for flow cytometry analysis of graft-infiltrating macrophages. Histograms and bar graphs in the bottom row display the expression levels of PD-L1 and DC-Sign on graft-infiltrating macrophages. (C) Dot plots show the gating strategy for flow cytometry analysis of macrophages, neutrophils, Ly6C+Ly6G− cells, and other CD11b+ cells in the grafts. The histogram and bar graph display the PD-L1 expression on indicated cell populations in grafts. In B and C, four grafts per group were analyzed. Data are mean ± s.e.m. * p < 0.05; ANOVA statistical test.
In this gene array analysis, we also found that the PD-L1 gene expression was significantly upregulated in graft-infiltrating macrophages from CTLA4-Ig treated LysMCreMtorfl/fl recipients (Figure 7A). We also performed flow cytometry analysis and confirmed that PD-L1 was selectively upregulated on graft-infiltrating macrophages isolated from CTLA4-Ig treated LysMCreMtorfl/fl mice, but not on macrophages from Wt control and LysMCreTraf6fl/fl recipients (Figure 7B). Moreover, among the graft infiltrating cells from LysMCreMtorfl/fl mice, macrophages expressed significantly higher levels of PD-L1 than other cell types in the myeloid linage (Figure 7C), suggesting that conditional mTOR deletion in macrophages upregulates PD-L1 expression by graft-infiltrating macrophages.
PD-L1 blockade restores graft rejection in CTLA4-Ig treated LysMCreMtorfl/fl recipients
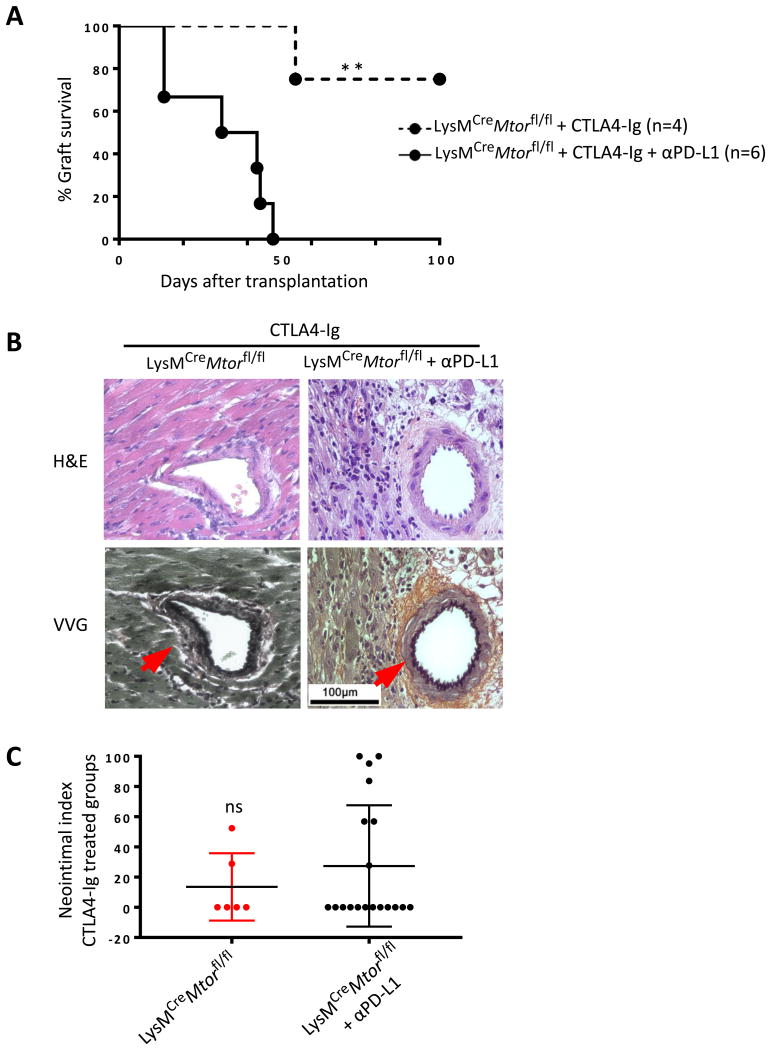
To determine whether the PD-L1 pathway plays any functional roles in long term graft survival in CTLA4-Ig treated LysMCreMtorfl/fl recipients, we transplanted the BALB/c heart allografts into LysMCreMtorfl/fl mice and treated the recipient mice with CTLA4-Ig. Groups of recipients were also treated with a blocking anti-PD-L1 mAb or a control IgG, and graft survival was determined. As shown in Figure 8A, long-term allograft survival was induced in CTLA4-Ig treated LysMCreMtorfl/fl recipients. Strikingly, PD-L1 blockade induced vigorous allograft rejection in all six recipients, demonstrating the involvement of PD-L1 pathway in graft acceptance in LysMCreMtorfl/fl mice.
Figure 8. PD-L1 blockade induces prompt graft rejection in conditional mTOR deleted mice treated with CTLA4-Ig.
LysMCreMtorfl/fl mice were transplanted with BALB/c hearts, and treated with CTLA4-Ig alone or together with a blocking anti-PD-L1 mAb. For assessment of chronic rejection, two surviving grafts were harvested from CTLA4-Ig treated mice at day 28 post-transplantation, and four rejected grafts were harvested from CTLA4-Ig and anti-PD-L1 treated mice on days 36, 43, 44 and 47. (A) Percentage of heart allograft survival after transplantation. ** p < 0.01; log-rank test. (B) Representative images of H&E and VVG stained sections of grafts harvested from indicated groups. Scale bar = 100 μm; ×400 magnification. (C) Morphometric quantification of neointimal index in indicated groups.
Two surviving grafts were harvested from CTLA4-Ig treated mice at day 28 post-transplantation, and four rejected grafts were harvested from CTLA4-Ig/anti-PD-L1 treated mice on days 36, 43, 44 and 47 for histological assessments. We found that in CTLA4-Ig and anti-PD-L1 treated mice, graft rejection was associated extensive cellular infiltration in the grafts, while the vascular changes were not striking (Figure 8B). In fact the difference in neointimal index between two groups was not significant (Figure 8C). Thus, in CTLA4-Ig treated LysMCreMtorfl/fl mice in which long-term graft survival is induced, PD-L1 blockade restores graft rejection with features of acute cellular rejection.
Discussion
In the present study we generated conditional knockout mice in which TRAF6 and mTOR were selectively deleted in macrophages and demonstrated that deletion of TRAF6 and mTOR had profound impact on M1 and M2 polarization, respectively. Though macrophage-specific deletion of TRAF6 and mTOR did not affect acute allograft rejection, treatment of mTOR deleted recipients (LysMCreMtorfl/fl mice), but not TRAF6-deleted mice (LysMCreTraf6fl/fl), with CTLA4-Ig produced long-term heart allograft survival, free from vascular injuries and chronic rejection in the graft, highlighting the importance of M2 cells in chronic graft loss in the presence of costimulatory blockade. Mechanistically, we found that deletion of mTOR in macrophages did not prevent them from infiltrating the grafts, but such graft-infiltrating macrophages upregulated the expression of PD-L1, which plays a critical role in long-term graft survival. This is demonstrated by prompt rejection of otherwise survival heart allograft following PD-L1 blockade in LysMCreMtorfl/fl recipients. Clearly, those features were not observed in TRAF6-deleted macrophages in transplant recipients following costimulatory blockade.
The M1 type of macrophages, also called the classically activated macrophages, are prominently induced by TLR ligands and type 1 T cell responses (12). In theory, during acute rejection, DAMPs released from necrotic or stressed cells in the grafts and IFN-γ secreted by Th1 cells may contribute to the generation of pro-inflammatory M1 macrophages via activating the TLR/NF-κB and Stat1 signaling pathways (16, 24). M1 macrophages then contribute to acute rejection by producing pro-inflammatory cytokines, such as IL-1β, IL-6, IL-12, and TNF-α, which are abundantly expressed in graft biopsies during acute allograft rejection (25, 26). However, acute allograft rejection is primarily a T cell-mediated event, and the robust T cell activation is necessary and sufficient in mediating acute graft loss. Thus, suppression of M1 cells alone, as we shown in this study using TRAF6-deleted mice, provides little effects in setting of acute allograft rejection. Our data are consistent with earlier observations that targeting T cell activation is a prerequisite in preventing acute allograft rejection.
Data from clinical and pre-clinical studies repeatedly demonstrate that inhibition of T cell responses, especially the type 1 T cell immunity, often failed to ensure long-term graft acceptance (27). In fact, graft loss in the presence of broad immunosuppression therapies is mostly associated with the development of chronic allograft rejection, a complex process that involves a multiplicity of cell types (6, 28, 29). In animal models, we and others have highlighted the significance of M2 macrophages in chronic graft loss (6, 19). In kidney and heart transplantation in the clinic, there is a strong correlation between graft-infiltrating M2 cells and signs of interstitial fibrosis, suggesting that M2 macrophages have the potential to promote development of interstitial fibrosis (5, 30, 31). Mechanistically, M2 cells can produce growth factors such as TGF-β and PDGF, which are crucial mediators of vascular changes by inducing smooth muscle cell proliferation, activation of myofibroblasts and extracellular matrix deposition (32, 33). Moreover, a recent report indicates that α-SMA+ myofibroblasts contributes to interstitial fibrosis in chronic renal allograft injury, and approximately 50% of these myofibroblasts are derived from M2 macrophages (34). All these studies suggest the significance of M2 macrophages in mediating chronic allograft rejection. In the present study we found that mTOR deletion in macrophages inhibited M2 polarization in vitro, decreased the expression of M2 marker genes in graft-infiltrating macrophages, and prevented the development of transplant vasculopathy following CTLA4-Ig treatment. Thus, when primary T cell activation is inhibited by costimulatory blockade, activation of the mTOR pathway in macrophages appears to be important in M2 induction in transplant recipients. Clearly, our findings highlight the importance of mTOR in polarization of M2 cells and M2-mediated chronic allograft rejection. In certain transplant models, the mTOR inhibitor rapamycin has been shown to inhibit neointimal formation and chronic graft rejection (17, 35, 39) and our data argue for the importance of M2 suppression by rapamycin, in addition to its effects on T cells, in chronic rejection. However, mechanisms of acute and chronic rejection are so different in that some form of immunosuppression therapies to inhibit T cells is often required for chronic rejection to develop, but how T cell suppression reagents, such as CTLA4-Ig, are inherently linked to chronic rejection are currently unknown and certainly require further investigation. In our studies, the functional differentiation of M2 cells in CTLA4-Ig treated transplant recipients is clearly involved in the development of chronic rejection, and under such conditions, this M2 response requires mTOR signaling. However, chronic rejection in the clinical settings is far more complex likely involving other mechanisms, as donor specific antibodies, drug toxicities, infections, as well as obesity and diabetes are all known risk factors in chronic rejection.
Another interesting finding of our study is that in CTLA4-Ig treated LysMCreMtorfl/fl mice, graft infiltrating macrophages expressed high levels of PD-L1, which is functionally involved in graft acceptance. These PD-L1 expressing macrophages in the grafts are accompanied by an increased presence of Foxp3+ Tregs. We thus suspect that the PD-L1−dependant graft acceptance in LysMCreMtorfl/fl mice may relies on the immune regulatory function of mTOR-deleted macrophages. It is well known that mTOR signals via two distinct signaling complexes, mTORC1 and mTORC2 (36). Upon mTOR deletion in macrophages, both mTORC1 and mTORC2 complexes are disrupted. Interestingly, inhibition of mTORC2 has been shown to upregulate PD-L1 expression on DCs, as well as on a human lung carcinoma cell line (37, 38). Given these findings, it is possible that in polarizing macrophages, mTOR activation inhibits PD-L1expression, and its absence or inhibition favors PD-L1 expression by macrophages. This notion warrants further investigation in future studies.
In summary, conditional deletion of mTOR in macrophages exhibits profound effects on graft survival under conditions of costimulatory blockade. We provide data that mTOR deletion suppresses M2 polarization and inhibits chronic allograft rejection. Moreover, mTOR deleted macrophages overexpress PD-L1 and exert potent immune regulatory function in mediating long-term graft survival. Our data demonstrate that the potential impact of macrophage subpopulations on chronic rejection versus graft acceptance is significant, especially in the presence of costimulatory blockade treatment.
Acknowledgments
This study was supported by grants from the National Institutes of Health (R01AI080779) and the Kleberg Foundation (X.C.L). We thank the flow cytometry and the pathology core facilities at Houston Methodist for excellent services.
Abbreviations
- Arg1
arginase 1
- BMDM
bone marrow-derived macrophage
- CAV
cardiac allograft vasculopathy
- CTLA4-Ig
CTLA4 immunoglobulin fusion protein
- IFN-γ
interferon-γ
- LPS
lipopolysaccharide
- M-CSF
macrophage colony-stimulating factor
- MFI
mean fluorescence intensity
- mTOR
mammalian target of rapamycin
- MST
mean survival time
- NOS2
nitric oxide synthase 2
- PD-L1
programmed cell death protein ligand 1
- RT-PCR
reverse transcriptase polymerase chain reaction
- SEM
standard error of the mean
- TNF-α
tumor necrosis factor α
- TRAF6
tumor necrosis factor receptor-associated factor 6
- Treg
T regulatory cell
- VVG
Verhoeff-Van Gieson
Footnotes
Disclosure: The authors of this manuscript have no conflicts of interest to disclose as described by the American Journal of Transplantation.
References
- 1.Sawinski D, Trofe-Clark J, Leas B, et al. Calcineurin Inhibitor Minimization, Conversion, Withdrawal, and Avoidance Strategies in Renal Transplantation: A Systematic Review and Meta-Analysis. Am J Transplant. 2016;16:2117–2138. doi: 10.1111/ajt.13710. [DOI] [PubMed] [Google Scholar]
- 2.Kwun J, Knechtle SJ. Overcoming Chronic Rejection-Can it B? Transplantation. 2009;88:955–961. doi: 10.1097/TP.0b013e3181b96646. [DOI] [PubMed] [Google Scholar]
- 3.Li XC. The significance of non-T-cell pathways in graft rejection: implications for transplant tolerance. Transplantation. 2010;90:1043–1047. doi: 10.1097/TP.0b013e3181efcfe9. [DOI] [PMC free article] [PubMed] [Google Scholar]
- 4.Mannon RB. Macrophages: contributors to allograft dysfunction, repair, or innocent bystanders? Curr Opin Organ Transplant. 2012;17:20–25. doi: 10.1097/MOT.0b013e32834ee5b6. [DOI] [PMC free article] [PubMed] [Google Scholar]
- 5.Toki D, Zhang W, Hor KL, et al. The role of macrophages in the development of human renal allograft fibrosis in the first year after transplantation. Am J Transplant. 2014;14:2126–2136. doi: 10.1111/ajt.12803. [DOI] [PubMed] [Google Scholar]
- 6.Kaul AM, Goparaju S, Dvorina N, et al. Acute and chronic rejection: compartmentalization and kinetics of counterbalancing signals in cardiac transplants. Am J Transplant. 2015;15:333–345. doi: 10.1111/ajt.13014. [DOI] [PMC free article] [PubMed] [Google Scholar]
- 7.Kitchens WH, Chase CM, Uehara S, et al. Macrophage depletion suppresses cardiac allograft vasculopathy in mice. Am J Transplant. 2007;7:2675–2682. doi: 10.1111/j.1600-6143.2007.01997.x. [DOI] [PubMed] [Google Scholar]
- 8.Thornley TB, Fang Z, Balasubramanian S, et al. Fragile TIM-4-expressing tissue resident macrophages are migratory and immunoregulatory. J Clin Invest. 2014;124:3443–3454. doi: 10.1172/JCI73527. [DOI] [PMC free article] [PubMed] [Google Scholar]
- 9.Conde P, Rodriguez M, van der Touw W, et al. DC-SIGN(+) Macrophages Control the Induction of Transplantation Tolerance. Immunity. 2015;42:1143–1158. doi: 10.1016/j.immuni.2015.05.009. [DOI] [PMC free article] [PubMed] [Google Scholar]
- 10.Garcia MR, Ledgerwood L, Yang Y, et al. Monocytic suppressive cells mediate cardiovascular transplantation tolerance in mice. J Clin Invest. 2010;120:2486–2496. doi: 10.1172/JCI41628. [DOI] [PMC free article] [PubMed] [Google Scholar]
- 11.Dal-Secco D, Wang J, Zeng Z, et al. A dynamic spectrum of monocytes arising from the in situ reprogramming of CCR2+ monocytes at a site of sterile injury. J Exp Med. 2015;212:447–456. doi: 10.1084/jem.20141539. [DOI] [PMC free article] [PubMed] [Google Scholar]
- 12.Martinez FO, Sica A, Mantovani A, Locati M. Macrophage activation and polarization. Front Biosci. 2008;13:453–461. doi: 10.2741/2692. [DOI] [PubMed] [Google Scholar]
- 13.Mosser DM, Edwards JP. Exploring the full spectrum of macrophage activation. Nat Rev Immunol. 2008;8:958–969. doi: 10.1038/nri2448. [DOI] [PMC free article] [PubMed] [Google Scholar]
- 14.Martinez FO, Gordon S. The M1 and M2 paradigm of macrophage activation: time for reassessment. F1000Prime Rep. 2014;6:13. doi: 10.12703/P6-13. [DOI] [PMC free article] [PubMed] [Google Scholar]
- 15.O'Neill LA, Hardie DG. Metabolism of inflammation limited by AMPK and pseudo-starvation. Nature. 2013;493:346–355. doi: 10.1038/nature11862. [DOI] [PubMed] [Google Scholar]
- 16.Murray PJ, Allen JE, Biswas SK, et al. Macrophage activation and polarization: nomenclature and experimental guidelines. Immunity. 2014;41:14–20. doi: 10.1016/j.immuni.2014.06.008. [DOI] [PMC free article] [PubMed] [Google Scholar]
- 17.Paschoal VA, Amano MT, Belchior T, et al. mTORC1 inhibition with rapamycin exacerbates adipose tissue inflammation in obese mice and dissociates macrophage phenotype from function. Immunobiology. 2017;222:261–271. doi: 10.1016/j.imbio.2016.09.014. [DOI] [PubMed] [Google Scholar]
- 18.Hallowell RW, Collins SL, Craig JM, et al. mTORC2 signalling regulates M2 macrophage differentiation in response to helminth infection and adaptive thermogenesis. Nat Commun. 2017;8:14208. doi: 10.1038/ncomms14208. [DOI] [PMC free article] [PubMed] [Google Scholar]
- 19.Wu C, Zhao Y, Xiao X, et al. Graft-Infiltrating Macrophages Adopt an M2 Phenotype and Are Inhibited by Purinergic Receptor P2X7 Antagonist in Chronic Rejection. Am J Transplant. 2016;16:2563–2573. doi: 10.1111/ajt.13808. [DOI] [PMC free article] [PubMed] [Google Scholar]
- 20.Xiao X, Balasubramanian S, Liu W, et al. OX40 signaling favors the induction of T(H)9 cells and airway inflammation. Nat Immunol. 2012;13:981–990. doi: 10.1038/ni.2390. [DOI] [PMC free article] [PubMed] [Google Scholar]
- 21.Tanaka K, Albin MJ, Yuan X, et al. PDL1 is required for peripheral transplantation tolerance and protection from chronic allograft rejection. J Immunol. 2007;179:5204–5210. doi: 10.4049/jimmunol.179.8.5204. [DOI] [PMC free article] [PubMed] [Google Scholar]
- 22.Armstrong AT, Strauch AR, Starling RC, Sedmak DD, Orosz CG. Morphometric analysis of neointimal formation in murine cardiac allografts. Transplantation. 1997;63:941–947. doi: 10.1097/00007890-199704150-00006. [DOI] [PubMed] [Google Scholar]
- 23.Sica A, Bronte V. Altered macrophage differentiation and immune dysfunction in tumor development. J Clin Invest. 2007;117:1155–1166. doi: 10.1172/JCI31422. [DOI] [PMC free article] [PubMed] [Google Scholar]
- 24.Huen SC, Cantley LG. Macrophage-mediated injury and repair after ischemic kidney injury. Pediatr Nephrol. 2015;30:199–209. doi: 10.1007/s00467-013-2726-y. [DOI] [PMC free article] [PubMed] [Google Scholar]
- 25.Patella M, Anile M, Del Porto P, et al. Role of cytokine profile in the differential diagnosis between acute lung rejection and pulmonary infections after lung transplantationdagger. Eur J Cardiothorac Surg. 2015;47:1031–1036. doi: 10.1093/ejcts/ezu395. [DOI] [PubMed] [Google Scholar]
- 26.Chadban SJ, Wu H, Hughes J. Macrophages and kidney transplantation. Semin Nephrol. 2010;30:278–289. doi: 10.1016/j.semnephrol.2010.03.009. [DOI] [PubMed] [Google Scholar]
- 27.Li XC, Strom TB, Turka LA, Wells AD. T cell death and transplantation tolerance. Immunity. 2001;14:407–416. doi: 10.1016/s1074-7613(01)00121-2. [DOI] [PubMed] [Google Scholar]
- 28.Hirohashi T, Chase CM, Della Pelle P, et al. A novel pathway of chronic allograft rejection mediated by NK cells and alloantibody. Am J Transplant. 2012;12:313–321. doi: 10.1111/j.1600-6143.2011.03836.x. [DOI] [PMC free article] [PubMed] [Google Scholar]
- 29.Zeng Q, Ng YH, Singh T, et al. B cells mediate chronic allograft rejection independently of antibody production. J Clin Invest. 2014;124:1052–1056. doi: 10.1172/JCI70084. [DOI] [PMC free article] [PubMed] [Google Scholar]
- 30.Ikezumi Y, Suzuki T, Yamada T, et al. Alternatively activated macrophages in the pathogenesis of chronic kidney allograft injury. Pediatr Nephrol. 2015;30:1007–1017. doi: 10.1007/s00467-014-3023-0. [DOI] [PubMed] [Google Scholar]
- 31.Salehi S, Reed EF. The divergent roles of macrophages in solid organ transplantation. Curr Opin Organ Transplant. 2015;20:446–453. doi: 10.1097/MOT.0000000000000209. [DOI] [PMC free article] [PubMed] [Google Scholar]
- 32.Nykanen AI, Krebs R, Tikkanen JM, et al. Combined vascular endothelial growth factor and platelet-derived growth factor inhibition in rat cardiac allografts: beneficial effects on inflammation and smooth muscle cell proliferation. Transplantation. 2005;79:182–189. doi: 10.1097/01.tp.0000147199.60464.f9. [DOI] [PubMed] [Google Scholar]
- 33.Zegarska J, Paczek L, Pawlowska M, et al. Extracellular matrix proteins, proteolytic enzymes, and TGF-beta1 in the renal arterial wall of chronically rejected renal allografts. Transplant Proc. 2003;35:2193–2195. doi: 10.1016/s0041-1345(03)00789-9. [DOI] [PubMed] [Google Scholar]
- 34.Wang YY, Jiang H, Pan J, et al. Macrophage-to-Myofibroblast Transition Contributes to Interstitial Fibrosis in Chronic Renal Allograft Injury. J Am Soc Nephrol. 2017;28:2053–2067. doi: 10.1681/ASN.2016050573. [DOI] [PMC free article] [PubMed] [Google Scholar]
- 35.Mercalli A, Calavita I, Dugnani E, et al. Rapamycin unbalances the polarization of human macrophages to M1. Immunology. 2013;140:179–190. doi: 10.1111/imm.12126. [DOI] [PMC free article] [PubMed] [Google Scholar]
- 36.Weichhart T, Hengstschlager M, Linke M. Regulation of innate immune cell function by mTOR. Nat Rev Immunol. 2015;15:599–614. doi: 10.1038/nri3901. [DOI] [PMC free article] [PubMed] [Google Scholar]
- 37.Rosborough BR, Raich-Regue D, Matta BM, et al. Murine dendritic cell rapamycin-resistant and rictor-independent mTOR controls IL-10, B7-H1, and regulatory T-cell induction. Blood. 2013;121:3619–3630. doi: 10.1182/blood-2012-08-448290. [DOI] [PMC free article] [PubMed] [Google Scholar]
- 38.Lastwika KJ, Wilson W, 3rd, Li QK, et al. Control of PD-L1 Expression by Oncogenic Activation of the AKT-mTOR Pathway in Non-Small Cell Lung Cancer. Cancer Res. 2016;76:227–238. doi: 10.1158/0008-5472.CAN-14-3362. [DOI] [PubMed] [Google Scholar]
- 39.Ikonen TS, Gummert JF, Hayase M, et al. Sirolimus (rapamycin) halts and reverses progression of allograft vascular diseases in non-human primates. Transplantation. 2000;70:969–975. doi: 10.1097/00007890-200009270-00015. [DOI] [PubMed] [Google Scholar]


