

Abstract
Pituitary tumors of the gonadotrope lineage are often large and invasive, resulting in hypopituitarism. No medical treatments are currently available. Using a combined genetic and genomic screen of individual human gonadotrope pituitary tumor samples, we recently identified the mammalian sterile-20 like kinase 4 (MST4) as a protumorigenic effector, driving increased pituitary cell proliferation and survival in response to a hypoxic microenvironment. To identify novel inhibitors of the MST4 kinase for potential future clinical use, computational-based virtual library screening was used to dock the SelleckChem kinase inhibitor library into the ATP-binding site of the MST4 crystal structure. Several inhibitor candidates were identified with the potential to bind with high affinity. Using a TR-FRET in vitro recombinant kinase assay, hesperadin, initially described as an Aurora kinase inhibitor, exhibited potent inhibition of the MST4 kinase at nanomolar concentrations. The LβT2 gonadotrope pituitary cell hypoxic model was used to test the ability of this inhibitor to antagonize MST4 actions. Under short-term severe hypoxia (1% O2), MST4 protection from hypoxia-induced apoptosis was abrogated in the presence of hesperadin. Similarly, under chronic hypoxia (5%), hesperadin blocked the proliferative and colony-forming actions of MST4 as well as the ability to activate specific downstream signaling and hypoxia-inducible factor-1 effectors. Together, these data identify hesperadin as the first potent, selective inhibitor of the MST4 kinase with the capacity to block pituitary tumor cell growth in a hypoxic microenvironment.
Introduction
Pituitary tumors are the most common type of brain tumor, detected clinically in 1/10,000 persons, but present at autopsy in up to 20% of the population (1, 2). These tumors are usually derived from one of the five different pituitary cell types, including prolactin, growth hormone, gonadotrope, corticotrope, and thyrotrope. Gonadotrope, often called non-functioning or null cell tumors, represent 35% of pituitary tumors, and are identified by expression of follicle-stimulating hormone, luteinizing hormone, and/or alpha-subunit mRNAs or protein by immunohistochemistry (3). These tumors present clinically more commonly in men than in women, with hypogonadism due to low testosterone and tumor mass effects causing visual disturbances, and compromise to normal pituitary function, often resulting in hypopituitarism (3). Local invasion into adjacent structures and dura occurs in approximately 50% of patients, leading to increased risk of residual tumor regrowth in ~30% after transsphenoidal surgical resection and need for additional surgery or radiation treatment (4). There are no widely accepted prognostic biomarkers and no medical therapies for gonadotrope pituitary tumors. Thus, new treatment options are needed.
The underlying pathogenesis of pituitary tumors is poorly understood due to a limited access to human tissue, lack of human cell lines, and/or optimal animal models (5, 6). Prior studies by our group and others have used gene expression microarray profiling of individual human pituitary tumor samples to identify and characterize candidate genes involved in pituitary tumor promotion or maintenance (7–10). Using copy-number variation analysis and DNA microarray profiling of individual human gonadotrope pituitary tumors and normal pituitaries, we recently identified the mammalian Ste20-like kinase 4 (MST4) as a genetically and genomically dysregulated gene (11).
Originally identified in yeast pheromone signaling, upstream of MAPK, Sterile 20 (Ste20) is a serine threonine kinase (12, 13). Mammalian Ste20-like kinases comprise a large family grouped into two structurally distinct subfamilies: the p21-activated kinase family (PAK) and the germinal center kinase (GCK) family (12). There are 8 subfamilies in the GCK group (GCKI to VIII; refs. 14–16). MST4, MST3, and SOK1 compromise the GCKIII subfamily, which share approximately 90%of the amino acid sequence in the kinase domain, but have less than 20% alignment in the C-terminal domain (12, 17). This GCK subfamily has shown a broad array of cellular functions. SOK1 has a reported role in cell migration, and MST3 can play a proapoptotic role (18–20). Depending on cell type, MST4 can play multiple roles in the cell. For example, MST4 is proapoptotic in breast cancer cells (21), but in embryonic kidney cells, cerebral cavernous modulator-3 (CCM3) shuttles MST4 from the Golgi to the plasma membrane to interact with Ezrin/Radixin/Moesin (ERM) proteins to promote cell survival (17). In HeLa cells, MST4 may also be involved in regulation of cell migration via its interaction with the Golgi protein GM130 (22). Together, these data imply that MST4 serves a diversity of roles and cell-specific functions.
The role of MST4 in tumor development or maintenance has not been extensively studied. Prior to our study, only one report showed that MST4 induces anchorage-independent growth and increases in vitro proliferation as well as in vivo tumorigenesis using prostate cancer cell lines (23), suggesting a role in prostate cancer progression. Our recent study demonstrated that MST4 has the potential to promote pituitary tumorigenesis by modulation of cell proliferation and survival in response to a hypoxic microenvironment (11). The functional effects of MST4 in pituitary tumor cells were dependent on the MST4 kinase sequence and downstream signaling pathways (11). Additional data in our laboratory suggest the kinase is upregulated in all pituitary tumor cell types, which support future efforts to target this kinase as a potential new medical therapy for all types of human pituitary tumors and other tumors where MST4 is overexpressed.
In the present study, we utilized a computational-based and experimental screening approach to screen a database of small molecule compounds for potential MST4 inhibitors. Specifically, a virtual library screen was used to dock the commercially available SelleckChem kinase inhibitor library into the ATP-binding site of the MST4 crystal structure. This approach identified several candidate MST4 kinase inhibitors with the potential to bind MST4 with high affinity. This docking analysis combined with an MST4 TR-FRET in vitro kinase assay identified hesperadin as a candidate MST4 kinase inhibitor. Accordingly, functional studies using hesperadin demonstrated nanomolar inhibition of the multiple functional roles of MST4, including blocking survival, growth, and tumorigenicity and activation of cell-specific downstream signaling pathways in a hypoxic LβT2 gonadotrope pituitary cell model. Together, these data identify the first potent inhibitor of the MST4 kinase active at nanomolar concentrations with the capacity to selectively abrogate MST4 kinase effects under a hypoxic microenvironment and support future studies of its ability to modulate pituitary tumor growth in rodent models and other cancers where the kinase is dysregulated.
Materials and Methods
Computational-based library screen
Computational modeling was performed using Accelrys Discovery Studio 3.5 (Acclerys Inc.) and Molsoft ICM-Pro 3.8 (Molsoft Inc.). Crystal structure coordinates for MST4 were downloaded from the protein data bank (PDB ID: 3GGF, www.pdb.org). The protein structure was typed with the CHARMM force-field (24) and energy minimized with the smart minimizer protocol within Discovery Studio using the Generalized-Born with simple switching implicit solvent model to a root mean square gradient (RMS) convergence <0.001 kcal/mol prior to use in the docking studies. The commercially available (24) SelleckChem kinase inhibitor library (SelleckChem, Inc.) was docked into the ATP-binding site of the MST4 crystal structure using the library docking tools in both Accelrys Discovery Studio 3.5 and Molsoft ICM-Pro 3.8. The top 20 compounds that scored highest in both sets of simulations were then docked again into MST4 using the flexible docking protocol in Discovery Studio (25). The final ranking of the docked poses was performed via consensus scoring, combining the predicted binding energy with the Jain (26), PLP2 (27), and Ludi3 (28) scoring functions.
Reagents
The open reading frame of mMst4 was inserted into pcDNA3 vector as described (11). MST4 TR-FRET biochemical assay kit was purchased from Perkin Elmer. Hesperadin, PKI-587, and volasertib were purchased from SelleckChem.
TR-FRET kinase assay
LANCE (Perkin Elmer) Europium TR-FRET kinase binding assays were performed in white 384-well plates (Perkin Elmer, OptiPlate #6007299) using recombinant MST4 kinase (Carna Biosciences #07-119), ULight PKC substrate (Perkin Elmer #TRF0108), ATP (Sigma Aldrich #A26209) and LANCE Eu-anti-PKC (Ala25Ser) antibody (Perkin Elmer #TRF0207). Assays were performed at 25°C in a reaction mixture consisting of 2 µL serially diluted drug solution, 4 µL MST4 solution, 2 µL ULight PKC substrate solution, and 2 µL ATP solution. All reagents were prepared as solutions in 1 × kinase buffer (50 mmol/L HEPES, 1 mmol/L EGTA, 10 mmol/L MgCl2, 1 mol/L DTT, 0.1% Tween, pH 7.5). Hesperadin solutions (0.02 nmol/L to 5 µmol/L final concentration) were prepared from a DMSO stock solution through serial dilution into kinase buffer such that final DMSO concentrations did not exceed 0.5%, and this was shown to have no effect on kinase activity. Required MST4 kinase and ATP concentrations, determined via titration, were 1.5 nmol/L and 17 µmol/L, respectively. ULight PKC substrate was used at a final concentration of 50 nmol/L. All reagents were incubated together for 1 hour, before the reaction was halted through the addition of 5 µL 10 mmol/L EDTA solution in 1 × LANCE detection buffer (Perkin Elmer #CR97-100) followed by 5 µL LANCE Eu-anti-PKC (Ala25Ser) antibody solution to a final concentration of 2 nmol/L in 1 × LANCE detection buffer. The plate was incubated in the dark for 1 hour, before being read using a PerkinElmer Envision 2104 Multilabel Reader enabled for TR-FRET (excitation = 340 nm; tracer emission = 665 nm; antibody emission = 615 nm; delay = 100 µs; integration = 200 µs). Emission ratios (665/615 nm) were determined for each inhibitor concentration (n = 6), and the data were analyzed using a nonlinear regression analysis of the log dose–response curve to afford an IC50 value.
Cell culture
LβT2 gonadotrope cells from P. Mellon (University of California, San Diego, San Diego, CA) were cultured as previously described (11). There are no human gonadotrope cell lines available and these cells, immortalized with simian virus 40 T-antigen, are the only functional gonadotrope tumor cell lines available and used widely in the field. Cells were cultured in DMEM (Invitrogen) supplemented with 10% fetal bovine serum (FBS; Gemini), 100 U/mL penicillin, and 100 µg/mL streptomycin at 37°C in humidified 5% CO2 incubation chamber. LβT2 stable transfectants, including vector pcDNA3 and MST4 wildtype, were generated using Lipofectamine 2000 (Invitrogen) following the manufacturer's protocol. Selection of stably overexpressing pcDNA3 and MST4-WT cells were generated from the population of clones under geneticin selection (600 µg/mL; Gemini). In prior studies, we saw no effect of the MST4 kinase in response to growth factors or in response to normoxia (11). The pituitary cell hypoxia model was created based upon the hypoxic microenvironment that pituitary tumors grow within as described (11). Briefly, short-term experiments were performed in 1% hypoxia. Long-term experiments for proliferation and colony formation were performed under 5% hypoxia as no cells will survive under more stringent conditions.
Colony formation assay
Anchorage-dependent growth of tumor cells was investigated by a standard colony formation assay. LβT2 transfectant cells were plated in triplicate in a 6-well plate (1.0 × 10⁶ per well) and incubated at 37°C under humidified 5% CO2. Twenty-four hours later, the transfectants were placed under hypoxia (5% O2) in growth medium for 7 days in the absence or presence of hesperadin (20 nmol/L). Media were aspirated and replaced with fresh media containing hesperadin (20 nmol/L) or control media every 2 days during the incubation. Surviving colonies were stained with Crystal Violet for 10 minutes after methanol fixation for 5 minutes, and visible colonies (≥50 cells) were counted.
BrdUrd proliferation assay
The proliferation assay was performed by plating 20,000 cells in a 24-well plate containing microscope coverslips in growth medium. Cells were grown under norrmoxic conditions for 24 hours before adding hesperadin at various concentrations (0, 5, 10, 20, 40 nmol/L). After 3 hours of preincubation with hesperadin, cells were placed in a hypoxic environment (5% O2) for 7 days. Due to the half-life of hesperidin, it was added every 2 days in fresh hypoxic media. For BrdUrd staining, on day 6 the LβT2 transfectants were incubated with serum-free and antibiotic-free (SFAF) DMEM containing BrdUrd (Sigma-Aldrich; 10 µmol/L) under 5%O2 for 24 hours. Cells were washed with PBS three times and fixed in 4% paraformaldehyde for 20 minutes. To increase permeability, cells were incubated in a buffer of 0.3% Triton X-100 in PBS for 15 minutes. Cells were then blocked in a solution of 10% bovine serum albumin (BSA) in PBS for 10 minutes. Anti-BrdUrd antibody (100 µL; BD Pharmingen) in 0.5% Tween-20 in PBS was added at a 1:100 concentration and incubated in a humidified chamber for 1 hour. After washing with PBS three times, cells were incubated for 30 minutes with rhodamine-conjugated goat anti-mouse IgG, according to the supplier protocol (Life Technologies). Cells were washed with PBS three times, then incubated with 0.5 µg/mL of diamidino-2-phenylindole (DAPI; Invitrogen) in methanol for 6 minutes. Prior to microscopic examination, cells were washed with H2O, and coverslips were applied using Flo-Texx mounting medium. A total of 500 cells per cover slip were counted and the percentage of BrdUrd-positive cells for each treatment condition was recorded. Replicate cover slips were averaged, and the experiment was repeated three times (N = 3).
Apoptosis assay in response to a hypoxic microenvironment
To analyze apoptosis, terminal deoxynucleotidyl transferase dUTP nick end labeling (TUNEL) was performed. A total of 50,000 cells were plated in a 24-well plate containing microscope coverslips in growth medium and allowed to grow for 24 hours. The cells were then starved overnight, treated with hesperadin (0, 5, 10, 20, 40 nmol/L) for 3 hours, then placed in a hypoxia chamber (1% O2) for 17 hours. Cells were then washed 3 times with PBS and were fixed with 4% paraformaldehyde for 25 minutes at 4°C. After being washed three times with PBS, the cell membranes were permeabilized with 0.2% Triton X-100 in PBS for 5 minutes. TUNEL reaction mixture was made according to the manufacturer's protocol (Promega), and 50 µL of the TUNEL reaction mixture was added to the cells, then allowed to incubate for 1 hour at 37°C in a humidified chamber. After washing with PBS 3 times, coverslips were mounted with DAPI ProLong Gold antifade reagent (Invitrogen). Using fluorescence microscopy (Nikon Elipse E600), 500 cell nuclei were visualized and the green fluorescence of apoptotic cells was counted. Counts between replicate coverslips were averaged and reported as a percentage of the 500 cells counted.
Immunoblot analysis
Immunoblotting was performed as previously described (11). The bicinchoninic acid assay (BCA; Pierce) was performed to quantify protein concentrations in cell lysates, and equal amounts of protein (25 µg) were separated by SDS-PAGE. Using the mini-transblotter system (Bio-Rad), the gels were blotted to polyvinyl difluoride membranes (PVDF). After blocking in a 3% BSA solution, membranes were incubated with primary antibodies at 4°C overnight. Antibodies against mouse AKT, p38, ERK, phospho-AKT, phospho-p38, and phospho-ERK (Cell Signaling Technology) were used at 1:1,000 dilutions. GAPDH (Millipore) was used at a 1:2,000 dilution. The membranes were then washed with TBST and incubated for 1 hour with horseradish peroxidase–conjugated secondary antibodies (Bio-Rad). Proteins were visualized by enhanced chemiluminescence according to the manufacturer's protocol (Pierce).
Statistical analysis
Data are presented as means±SEM from three or more separate experiments. The P-value calculations were conducted using an unpaired Student t test for two-group comparison or ANOVA (with Bonferroni posttest analysis for multiple comparisons). All data were analyzed and presented by using GraphPad Prism software (version 5.0; GraphPad Software Inc.).
Results
Computational docking analysis identifies inhibitor candidates
In order to identify potential inhibitors of the MST4 kinase as a potential therapeutic target in pituitary tumors, we performed a virtual screen of the commercially available SelleckChem kinase inhibitor library consisting of 242 structurally diverse inhibitors designed to target a variety of cellular kinases. Compounds were docked into the ATP binding site of MST4 and an overall ranking was generated according to predicted binding affinity as described in Materials and Methods (see Table 1).
Table 1.
Predicted MST4 inhibitors as determined by computational modelling
| Consensus ranking | Name | Structure | Intended targeta | Intended target IC50a |
|---|---|---|---|---|
| 1 | PKI-587 |
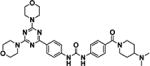
|
PI3Kα, γ, and mTOR | 0.4, 5.4, and 1.6 nmol/L |
| 2 | Hesperadin |

|
Aurora kinase B | 250 nmol/L |
| 3 | Apatinib |

|
VEGFR2 | 1 nmol/L |
| 4 | PHA-793887 |

|
CDK2, 5, and 7 | 8, 5, and 10 nmol/L |
| 5 | Volasertib |

|
PLK1 | 0.87 nmol/L |
| 6 | KU-60019 |

|
ATM | 6.3 nmol/L |
| 7 | GSK1363089 |

|
HGFR and VEGFR2 | 0.4 and 0.9 nmol/L |
| 8 | Motesanib |

|
VEGFR1, 2, and 3 | 2, 3 and 6 nmol/L |
| 9 | SNS-314 |

|
Aurora kinase A, B, and C | 9, 31, and 3 nmol/L |
| 10 | Tivozanib |

|
VEGFR1, 2, and 3 | 30, 6.5, and 15 nmol/L |
Intended target and relevant IC50 obtained from Selleck Chemicals inventory (http://www.selleckchem.com).
Identification of MST4 protein expression levels in pituitary adenomas
MST4 protein expression was detected using immunoblot analysis of normal pituitary and multiple types of pituitary adenomas [gonadotrope, as well as prolactin (PRL), adrenocorticotropin (ACTH) and growth hormone; Fig. 1A]. MST4 was consistently upregulated in all pituitary tumor samples analyzed. To create a model of gonadotrope tumorigenesis, MST4 was stably overexpressed in LβT2 gonadotrope cells at levels equal to or less than that seen in gonadotrope adenomas (Fig. 1B).
Figure 1.

Hypoxia model confirms the effects of selected inhibitor candidates on cell survival under severe hypoxia. A, immunoblot analysis of MST4 protein levels in normal pituitary and pituitary adenomas [gonadotrope, prolactin (PRL), ACTH, and growth hormone]. GAPDH was used as a loading control. B, immunoblot analysis shows overexpression of MST4 in pcDNA3-MST4–stable transfectants. C, percentage of nonviable cells in vector control and MST4 cells in the presence of the mammalian target of rapamycin (mTOR) inhibitor PKI-587 (0, 0.1, 1, 10, 100, and 1,000 nmol/L). D, percentage of nonviable cells in vector control and MST4 cells in the presence of the Polo-like kinase 1 (PLK-1) inhibitor volasertib (0, 0.1, 1, 10, 100, and 1,000 nmol/L). E, percentage of nonviable cells in control and MST4 transfectants in the presence of hesperadin (0, 0.1, 1, 10, 100, and 1000 nmol/L). *, P < 0.01; #, P < 0.0001, MST4 transfectants compared with pcDNA3 vector control cells.
Comparison of the effects of selected inhibitor candidates in hypoxic cell model
The computational modeling analysis revealed a list of 10 top-ranked molecules that were predicted to bind the ATP-binding site of MST4 (see Table 1). Based upon review of the literature and a goal of identifying novel inhibitors, 3 out of 10 inhibitor candidates were selected and investigated in the pituitary cell model: the mTOR inhibitor PKI-587, the Aurora kinase B inhibitor hesperadin and the Polo-like kinase 1 (PLK-1) inhibitor volasertib. The mTOR/PI3K pathway is a signal transduction cascade involved in cell growth and metabolism and has been previously shown to play a role in pituitary tumorigenesis (29). As expected, PKI-587 abolished MST4 protected cell survival effects at less than 10 nmol/L (Fig. 1C), which was within the compounds IC50 range against mTOR (30). Volasertib is a well-known small molecule inhibitor of PLK-1 (31). It did not show any effects on the ability of MST4 to protect cells from hypoxia-induced apoptosis (Fig. 1D). In contrast, incubation with hesperadin, an inhibitor initially described as an Aurora kinase B inhibitor, abolished MST4-induced cell survival (Fig. 1E). MST4 cells displayed decreased rates of hypoxia-induced apoptosis compared with vector controls (3.21-fold, P < 0.01). Incubation with hesperadin diminished the antiapoptotic effects of MST4 in a dose-dependent manner (2.6-fold at 0.1 nmol/L; 1.84-fold at 1 nmol/L; 1.49-fold at 10 nmol/L; 1.07-fold at 100 nmol/L and 1,000 nmol/L, compared with vector controls *, P < 0.05 by one-way ANOVA). These data suggest that hesperadin may be a highly selective inhibitor of the MST4 kinase.
Determination of the in vitro inhibitory activity of hesperadin against MST4
Hesperadin is an indole-based compound (Fig. 2A) that is a known ATP-competitive Aurora B kinase inhibitor. From our computational screen, hesperadin displayed multiple binding interactions in the ATP-binding domain of MST4 (Fig. 2B). The inhibitory activity of hesperadin against recombinant human MST4 was subsequently determined in an in vitro kinase time-resolved fluorescence resonance energy transfer (TR-FRET) assay (Fig. 2C). Potent inhibition of MST4 kinase activity was observed with hesperadin (IC50 = 6.18 ± 2.2 nmol/L, n = 6). Importantly, this IC50 is significantly lower than the published IC50 value (250 nmol/L) of hesperadin to inhibit Aurora kinase B (32). PKI-587 and volasertib were also tested in the TR-FRET assay and neither compound inhibited MST4 within the range of the assay (up to 5 µmol/L; Fig. 2B), confirming that the effects PKI-587 on hypoxia-induced apoptosis of MST4 transfectants was not via actions through MST4. The TR-FRET assay results confirmed the data derived from the computational-based screen and the effects of hesperadin in the hypoxic cell model. Collectively, these data support hesperadin as the first selective nanomolar inhibitor of MST4 and supported further analysis of hesperadin and its inhibitory effects on MST4 in the hypoxic pituitary tumor cell model.
Figure 2.

Hesperadin is identified as a potent inhibitor of MST4. A, the chemical structure of hesperadin. B, small molecule docking depicting the predicted interaction of hesperadin (cyan) with the ATP-binding domain of MST4. C, in vitro TR-FRET recombinant kinase assay demonstrates direct inhibition of the MST4 kinase by hesperadin at low nanomolar concentrations. PKI-587 and volasertib were also screened in the TR-FRET recombinant kinase assay and show no direct inhibition of MST4.
Hesperadin abolishes MST4-protected cell survival in response to hypoxia
The computational modeling data and in vitro kinase assay revealed hesperadin as an MST4 kinase inhibitor. To further evaluate this compound, hesperadin was investigated for its ability to abrogate the protective effect of MST4 in response to hypoxic stress. To mimic a hypoxic milieu, control and stable MST4 LβT2 transfectants were exposed to severe hypoxia (1% O2) for 17 hours in the absence or presence of hesperadin in various doses, and cell death was assessed by TUNEL staining (Fig. 3). Decreased rates of apoptosis were detected in MST4 cells in response to hypoxia compared with those observed in vector controls (2.67-fold at 17 hours; P < 0.001). Incubation with hesperadin abolished the MST4-protective effects on cell survival in a dose-dependent fashion with an EC50 of 10 nmol/L. Treatment with hesperadin (40 nmol/L) completely blocked MST4 protection against hypoxia-induced apoptosis with rates of cell death similar to that of vector controls (0.93-fold, P = 0.69). These data confirm that hesperadin inhibits the ability of MST4 to promote pituitary tumor cell survival in a hypoxic microenvironment.
Figure 3.

Hesperadin blocks the effects of MST4 on cell survival under acute hypoxia (1% O2). A, representative immunocytochemistry of apoptotic cells as assessed by TUNEL in the presence or absence of hesperadin (40 nmol/L) under hypoxia for 17 hours. B, rates of apoptosis were expressed as a percentage of TUNEL-positive cells to total cells in the absence or presence of various concentrations of hesperadin (5, 10, 20, and 40 nmol/L). *, P = 0.01 (at 10 nmol/L); #, P = 0.04 (at 20 nmol/L); **, P < 0.001, MST4 transfectants compared with pcDNA3 control cells.
Hesperadin blocks MST4 promotion of proliferation and colony formation in pituitary tumor cells under long-term hypoxic stress
To further explore the ability of hesperadin to modulate MST4 effects, we examined its impact on gonadotrope cell proliferation and tumorigenicity. Cell proliferation was assessed by BrdUrd incorporation under chronic hypoxia (5% O2) for 7 days in the absence or presence of hesperadin (Fig. 4A and B). Incubation with hesperadin inhibited the ability of MST4 transfectants to increase the rates of proliferation in a dose-dependent fashion, compared with controls (Fig. 4A and B; 2.60-fold at 5 nmol/L, P < 0.001; 2.41-fold at 10 nmol/L, P = 0.002; 1.38-fold at 20 nmol/L, P = 0.12; 2.16-fold at 40 nmol/L, P = 0.91). To examine if hesperadin would modulate the rates of colony formation, LβT2-MST4 or vector controls were grown under chronic hypoxic conditions (5% O2) for 14 days (Fig. 4C and D). Under hypoxia, an increased number of colonies were observed in MST4 transfectants (7,837 ± 401 colonies per well in MST4 cells compared with 3,917 ± 135 colonies/well in vector control cells, a 2.0-fold increase, P < 0.001; Fig. 4C). In contrast, incubation with hesperadin (20 nmol/L) completely blocked the promotion of colony formation induced by MST4 overexpression (2,941 ± 253 colonies per well in MST4 transfectants compared with 3,031 ± 622 colonies per well in vector cells, 0.97-fold, P = 0.91; Fig. 4D). These results confirm that the hesperadin blocks MST4-induced cell proliferation and colony formation of gonadotrope pituitary tumor cells in a hypoxic microenvironment.
Figure 4.

Hesperadin blocks the effects of MST4 on proliferation and colony formation under chronic hypoxic stress (5% O2). A, representative immunocytochemistry of the rates of BrdUrd incorporation in pcDNA3 control and MST4 transfectants in the absence and presence of hesperadin (40 nmol/L) under chronic hypoxia (5% O2) for 7 days. B, hesperadin abolishes MST4 increased cell proliferation. In the absence or presence of various doses of hesperadin (0, 5, 10, 20, and 40 nmol/L), cell proliferation was measured by BrdUrd after exposure to chronic hypoxia (5% O2) for 7 days. C, photomicrograph of colony formation in vector and MST4 transfectants incubated with DMSO or hesperadin (20 nmol/L). D, hesperadin decreases the ability of MST4 to promote increased colony formation. Numbers of pcDNA3 and MST4 transfectant colonies were counted after exposure to chronic hypoxia (5%O2) for 7 days. *, P = 0.002; **, P < 0.001, MST4 transfectants compared with pcDNA3 vector cells; #, P < 0.01, MST4 transfectants with hesperadin treatment (20 nmol/L) compared with the cells treated with DMSO.
MST4-regulated signaling is blocked by hesperadin
We have previously demonstrated that the MST4 kinase regulates pituitary cell proliferation and survival via p38 MAPK and AKT signaling cascades (see the model in Fig. 5A; ref. 11). To investigate the inhibitory effect of hesperadin on MST4 signaling, LβT2 transfectants were incubated in the absence or presence of hesperadin for 3 hours (20 or 40 nmol/L), and lysates were used for immunoblots to analyze the expression and activation of p38 MAPK and AKT pathways (Fig. 5B). In the absence of hesperadin, activated p-p38 MAPK and p-AKT were detected in MST4 transfectant compared with vector controls. In contrast, incubation with hesperadin attenuated this MST4-increased activation of p38 MAPK and AKT. These data support the assertion that hesperadin blocks pathways downstream of the MST4 kinase.
Figure 5.

A, illustration of MST4 signaling pathways in response to hypoxic stress. B, hesperadin blocks MST4 downstream signaling effectors. Phosphorylation of AKT, p38 MAPK, and ERK were determined by immunoblot in the presence or absence of hesperadin (0, 20, and 40 nmol/L). C, MST4-induced HIF-1 activity is blocked by hesperadin. Control or MST4 cells were transfected with HRE-luciferase reporter constructs. After 24 hours of transfection, cells were subjected to normoxia or hypoxia (1% O2) for 17 hours. HRE-luciferase values were detected and normalized to Renilla control luciferase values. *, P < 0.001, MST4 transfectants compared with pcDNA3 vector cells; #, P = 0.002, MST4 transfectants with hesperadin treatment compared with DMSO-treated controls.
Hesperadin blocks MST4 activation of the hypoxia-inducible factor (HIF-1) pathway
Our prior studies demonstrated that in addition to activation of the p38 MAPK and PI3K/AKT signaling pathways, MST4 activates HIF-1 and its downstream effectors (11). To confirm that hesperadin may also interrupt this pathway, control and MST4 cells were exposed to hypoxia (1% O2) for 17 hours in the absence or presence of hesperadin (20 or 40 nmol/L) and activation of HIF-1 was assessed by a HIF-1 reporter construct (Fig. 5C, inset). Control cells exposed to DMSO showed a nonsignificant activation of the HRE-luciferase construct (1.95-fold, P = 0.2) in the presence of hypoxia. In contrast, the MST4 transfectants hyper-responded to hypoxia activating the HIF-1 reporter, with the HRE-luciferase activity increasing by 29.8-fold (P < 0.001). Coincubation with hesperadin decreased this activity in a dose-dependent fashion (0.8-fold at 20 nmol/L, P = 0.22; 0.49-fold at 40 nmol/L, P = 0.002), compared with untreated MST4 cells. These results again confirm the potent ability of hesperadin to limit the effects of MST4 to drive the hyper-responsiveness of downstream targets containing a HIF-1 response element.
Discussion
A computational-based virtual screen of the Selleckchem kinase inhibitor library against the MST4 crystal structure identified several potential inhibitors of MST4. Following the computational screen, several inhibitors were identified with optimal docking scores to bind to the ATP binding site of the MST4 crystal structure. We examined the mTOR inhibitor PKI-587, the Aurora kinase inhibitor hesperadin, and the Polo kinase inhibitor volasertib in our hypoxic cell model, and hesperadin diminished the antiapoptotic effects of MST4 in a dose-dependent manner. We then examined inhibition of MST4 kinase activity using a TR-FRET in vitro kinase assay and found potent low nanomolar inhibition with hesperadin (IC50 = 6.18 ± 2.2 nmol/L). This is in comparison to the reported cell-free inhibitory activity of the compound against Aurora B at 250 nmol/L (32). These data support that hesperadin is a potent inhibitor of MST4, demonstrate greater selectivity for MST4 compared with Aurora B kinase, and suggest that hesperadin might be more appropriately termed an MST4 inhibitor.
These studies strengthened the rationale to analyze the ability of hesperadin to block the proliferative, tumorigenic, and prosurvival effects of MST4 in the hypoxic pituitary cell model. Pituitary tumors enlarge within a restricted space and blood supply and are exposed to a hypoxic microenvironment (33, 34). We developed both a short-term severe hypoxia model and a longer term pituitary tumor cell hypoxia model (11) to analyze the function of MST4 and to test the ability of hesperadin to antagonize MST4 actions. In a chronic hypoxic microenvironment, hesperadin blocked the ability of MST4 to promote colony formation in soft agar, and inhibited MST4 increased cell proliferation. Under short-term severe hypoxia, MST4 pituitary cell transfectants incubated with hesperadin lost their survival advantage. We then demonstrated that the activation of the downstream effectors of MST4, including p-p38, p-AKT, and HIF-1, was abrogated in the presence of hesperadin. Together, these data support efforts to further investigate hesperadin as a potential MST4 inhibitor in vivo, toward a future goal to utilize the compound as a potential novel medical therapy for patients with pituitary tumors.
Limitations of the studies include the lack of human pituitary cell lines and that currently available mouse gonadotrope cell lines are SV40 immortalized. However, the effects of immortalization would be expected to be similar in both vector control and MST4 transfectants and not the major mediator of the differential effects observed. In addition to Aurora kinase B, hesperadin has been shown to block several other kinases, including AMPK, Lck, MKK1, MAPKAP-K1, CHK1, and PHK (32); however, these were observed at doses of 1 µmol/L, far in excess of the low nanomolar doses used in our studies. Future studies will be needed to examine if there are any off-target effects of hesperadin on other kinases in the low nanomolar range.
What about dysregulation of the MST4 kinase in other cancers? To date, only one report suggested that MST4 is overexpressed in prostate cancer samples and cell lines, and that ectopic expression of wild-type, but not kinase dead, MST4 induced cell proliferation and in vivo tumorigenesis in nude mice (28). In a recent evaluation of 110 prostate biopsy cores, MST4 was not expressed in benign prostatic hypertrophy samples, but was detected at high levels by immunohistochemistry in 39% of prostate cancer samples (35). Using the Bioportal website, analysis of The Cancer Genome Atlas of cancer tissues suggests that 4% to 5% of prostate cancers in their dataset have a genetic amplification of the MST4 locus as a mechanism for overexpression (36, 37). These data suggest that prostate cancer is a potential area of interest. MST4 is also amplified in ovarian, stomach, and esophageal cancers and some head and neck cancers (36, 37). Further studies are needed to determine if MST4 is a biomarker for disease activity or plays a tumorigenic role in these cancers, and if hesperadin as a single agent or in combination therapy may be a novel therapeutic approach for the treatment of pituitary tumors and in additional cancer types.
Acknowledgments
This work was supported by VA Merit Review 001 (to M.E. Wierman), NIH K12CA086913-12 (to K. Kiseljak-Vassiliades), and the University of Colorado Cancer Center (P30-CA046934). Molecular modeling studies were conducted at the University of Colorado Computational Chemistry and Biology Core Facility, which is supported in part by NIH/NCATS Colorado CTSA Grant Number UL1 TR001082.
Footnotes
Disclosure of Potential Conflicts of Interest
No potential conflicts of interest were disclosed.
Authors' Contributions
Conception and design: W. Xiong, C.J. Matheson, M. Xu, M.E. Wierman
Development of methodology: W. Xiong, C.J. Matheson, M. Xu, D.S. Backos
Acquisition of data (provided animals, acquired and managed patients, provided facilities, etc.): W. Xiong, C.J. Matheson, D.S. Backos, M.E. Wierman
Analysis and interpretation of data (e.g., statistical analysis, biostatistics, computational analysis): W. Xiong, C.J. Matheson, M. Xu, D.S. Backos, S. Salian-Mehta, K. Kiseljak-Vassiliades, P. Reigan, M.E. Wierman
Writing, review, and/or revision of the manuscript: W. Xiong, C.J. Matheson, M. Xu, D.S. Backos, T.S. Mills, S. Salian-Mehta, K. Kiseljak-Vassiliades, P. Reigan, M.E. Wierman
Administrative, technical, or material support (i.e., reporting or organizing data, constructing databases): W. Xiong, M. Xu, M.E. Wierman
Study supervision: P. Reigan, M.E. Wierman
References
- 1.Ezzat S, Asa SL, Couldwell WT, Barr CE, Dodge WE, Vance ML, et al. The prevalence of pituitary adenomas: a systematic review. Cancer. 2004;101:613–9. doi: 10.1002/cncr.20412. [DOI] [PubMed] [Google Scholar]
- 2.Melmed S. Update in pituitary disease. J Clin Endocrinol Metab. 2008;93:331–8. doi: 10.1210/jc.2007-1409. [DOI] [PubMed] [Google Scholar]
- 3.Molitch ME. Nonfunctioning pituitary tumors. Handb Clin Neurol. 2014;124:167–84. doi: 10.1016/B978-0-444-59602-4.00012-5. [DOI] [PubMed] [Google Scholar]
- 4.Freda PU, Beckers AM, Katznelson L, Molitch ME, Montori VM, Post KD, et al. Pituitary incidentaloma: an endocrine society clinical practice guideline. J Clin Endocrinol Metab. 2011;96:894–904. doi: 10.1210/jc.2010-1048. [DOI] [PMC free article] [PubMed] [Google Scholar]
- 5.Herman V, Fagin J, Gonsky R, Kovacs K, Melmed S. Clonal origin of pituitary adenomas. J Clin Endocrinol Metab. 1990;71:1427–33. doi: 10.1210/jcem-71-6-1427. [DOI] [PubMed] [Google Scholar]
- 6.Alexander JM, Biller BM, Bikkal H, Zervas NT, Arnold A, Klibanski A. Clinically nonfunctioning pituitary tumors are monoclonal in origin. J Clin Invest. 1990;86:336–40. doi: 10.1172/JCI114705. [DOI] [PMC free article] [PubMed] [Google Scholar]
- 7.Shorts-Cary L, Xu M, Ertel J, Kleinschmidt-Demasters BK, Lillehei K, Matsuoka I, et al. Bone morphogenetic protein and retinoic acid-inducible neural specific protein-3 is expressed in gonadotrope cell pituitary adenomas and induces proliferation, migration, and invasion. Endocrinology. 2007;148:967–75. doi: 10.1210/en.2006-0905. [DOI] [PubMed] [Google Scholar]
- 8.Xu M, Shorts-Cary L, Knox AJ, Kleinsmidt-DeMasters B, Lillehei K, Wierman ME. Epidermal growth factor receptor pathway substrate 8 is overexpressed in human pituitary tumors: role in proliferation and survival. Endocrinology. 2009;150:2064–71. doi: 10.1210/en.2008-1265. [DOI] [PubMed] [Google Scholar]
- 9.Michaelis KA, Knox AJ, Xu M, Kiseljak-Vassiliades K, Edwards MG, Geraci M, et al. Identification of growth arrest and DNA-damage-inducible gene beta (GADD45beta) as a novel tumor suppressor in pituitary gonadotrope tumors. Endocrinology. 2011;152:3603–13. doi: 10.1210/en.2011-0109. [DOI] [PMC free article] [PubMed] [Google Scholar]
- 10.Xu M, Knox AJ, Michaelis KA, Kiseljak-Vassiliades K, Kleinschmidt-DeMasters BK, Lillehei KO, et al. Reprimo (RPRM) is a novel tumor suppressor in pituitary tumors and regulates survival, proliferation, and tumorigenicity. Endocrinology. 2012;153:2963–73. doi: 10.1210/en.2011-2021. [DOI] [PMC free article] [PubMed] [Google Scholar]
- 11.Xiong W, Knox AJ, Xu M, Kiseljak-Vassiliades K, Colgan SP, Brodsky KS, et al. Mammalian Ste20-like kinase 4 promotes pituitary cell proliferation and survival under hypoxia. Mol Endocrinol. 2015;29:460–72. doi: 10.1210/me.2014-1332. [DOI] [PMC free article] [PubMed] [Google Scholar]
- 12.Ling P, Lu TJ, Yuan CJ, Lai MD. Biosignaling of mammalian Ste20-related kinases. Cell Signal. 2008;20:1237–47. doi: 10.1016/j.cellsig.2007.12.019. [DOI] [PubMed] [Google Scholar]
- 13.Leberer E, Dignard D, Harcus D, Thomas DY, Whiteway M. The protein kinase homologue Ste20p is required to link the yeast pheromone response G-protein beta gamma subunits to downstream signalling components. EMBO J. 1992;11:4815–24. doi: 10.1002/j.1460-2075.1992.tb05587.x. [DOI] [PMC free article] [PubMed] [Google Scholar]
- 14.Dan I, Watanabe NM, Kusumi A. The Ste20 group kinases as regulators of MAP kinase cascades. Trends Cell Biol. 2001;11:220–30. doi: 10.1016/s0962-8924(01)01980-8. [DOI] [PubMed] [Google Scholar]
- 15.Pombo CM, Force T, Kyriakis J, Nogueira E, Fidalgo M, Zalvide J. TheGCKII and III subfamilies of the STE20 group kinases. Front Biosci. 2007;12:850–9. doi: 10.2741/2107. [DOI] [PubMed] [Google Scholar]
- 16.Strange K, Denton J, Nehrke K. Ste20-type kinases: evolutionarily conserved regulators of ion transport and cell volume. Physiology (Bethesda) 2006;21:61–8. doi: 10.1152/physiol.00139.2005. [DOI] [PubMed] [Google Scholar]
- 17.Sugden PH, McGuffin LJ, Clerk A. SOcK, MiSTs, MASK and STicKs: the GCKIII (germinal centre kinase III) kinases and their heterologous proteinprotein interactions. Biochem J. 2013;454:13–30. doi: 10.1042/BJ20130219. [DOI] [PubMed] [Google Scholar]
- 18.Lin CY, Wu HY, Wang PL, Yuan CJ. Mammalian Ste20-like protein kinase 3 induces a caspase-independent apoptotic pathway. Int J Biochem Cell Biol. 2010;42:98–105. doi: 10.1016/j.biocel.2009.09.012. [DOI] [PubMed] [Google Scholar]
- 19.Wu HY, Lin CY, Chen TC, Pan ST, Yuan CJ. Mammalian Ste20-like protein kinase 3 plays a role in hypoxia-induced apoptosis of trophoblast cell line 3A-sub-E. Int J Biochem Cell Biol. 2011;43:742–50. doi: 10.1016/j.biocel.2011.01.015. [DOI] [PubMed] [Google Scholar]
- 20.Chen XD, Cho CY. Downregulation of SOK1 promotes the migration of MCF-7 cells. Biochem Biophys Res Commun. 2011;407:389–92. doi: 10.1016/j.bbrc.2011.03.031. [DOI] [PubMed] [Google Scholar]
- 21.Dan I, Ong SE, Watanabe NM, Blagoev B, Nielsen MM, Kajikawa E, et al. Cloning of MASK, a novel member of the mammalian germinal center kinase III subfamily, with apoptosis-inducing properties. J Biol Chem. 2002;277:5929–39. doi: 10.1074/jbc.M110882200. [DOI] [PubMed] [Google Scholar]
- 22.Preisinger C, Short B, De Corte V, Bruyneel E, Haas A, Kopajtich R, et al. YSK1 is activated by the Golgi matrix protein GM130 and plays a role in cell migration through its substrate 14-3-3zeta. J Cell Biol. 2004;164:1009–20. doi: 10.1083/jcb.200310061. [DOI] [PMC free article] [PubMed] [Google Scholar]
- 23.Sung V, Luo W, Qian D, Lee I, Jallal B, Gishizky M. The Ste20 kinase MST4 plays a role in prostate cancer progression. Cancer Res. 2003;63:3356–63. [PubMed] [Google Scholar]
- 24.Brooks BR, Brooks CL, 3rd, Mackerell AD, Jr, Nilsson L, Petrella RJ, Roux B, et al. CHARMM: the biomolecular simulation program. J Comput Chem. 2009;30:1545–614. doi: 10.1002/jcc.21287. [DOI] [PMC free article] [PubMed] [Google Scholar]
- 25.Koska J, Spassov VZ, Maynard AJ, Yan L, Austin N, Flook PK, et al. Fully automated molecular mechanics based induced fit protein-ligand docking method. J Chem Inf Model. 2008;48:1965–73. doi: 10.1021/ci800081s. [DOI] [PubMed] [Google Scholar]
- 26.Jain AN. Scoring noncovalent protein–ligand interactions: a continuous differentiable function tuned to compute binding affinities. J Comput Aided Mol Des. 1996;10:427–40. doi: 10.1007/BF00124474. [DOI] [PubMed] [Google Scholar]
- 27.Gehlhaar DKB, Bouzida D, Rejto P. In: Rational drug design: novel methodology and practical applications. Parrill L, Reddy MR, editors. Washington, DC: 1999. [Google Scholar]
- 28.Bohm HJ. On the use of LUDI to search the Fine Chemicals Directory for ligands of proteins of known three-dimensional structure. J Comput Aided Mol Des. 1994;8:623–32. doi: 10.1007/BF00123669. [DOI] [PubMed] [Google Scholar]
- 29.Monsalves E, Juraschka K, Tateno T, Agnihotri S, Asa SL, Ezzat S, et al. The PI3K/AKT/mTOR pathway in the pathophysiology and treatment of pituitary adenomas. Endocr Relat Cancer. 2014;21:R331–44. doi: 10.1530/ERC-14-0188. [DOI] [PubMed] [Google Scholar]
- 30.Venkatesan AM, Dehnhardt CM, Delos Santos E, Chen Z, Dos Santos O, Ayral-Kaloustian S, et al. Bis(morpholino-1,3,5-triazine) derivatives: potent adenosine 5′-triphosphate competitive phosphatidylinositol-3-kinase/mammalian target of rapamycin inhibitors: discovery of compound 26 (PKI-587), a highly efficacious dual inhibitor. J Med Chem. 2010;53:2636–45. doi: 10.1021/jm901830p. [DOI] [PubMed] [Google Scholar]
- 31.Gjertsen BT, Schoffski P. Discovery and development of the Polo-like kinase inhibitor volasertib in cancer therapy. Leukemia. 2015;29:11–9. doi: 10.1038/leu.2014.222. [DOI] [PMC free article] [PubMed] [Google Scholar]
- 32.Hauf S, Cole RW, LaTerra S, Zimmer C, Schnapp G, Walter R, et al. The small molecule hesperadin reveals a role for Aurora B in correcting kinetochore-microtubule attachment and in maintaining the spindle assembly checkpoint. J Cell Biol. 2003;161:281–94. doi: 10.1083/jcb.200208092. [DOI] [PMC free article] [PubMed] [Google Scholar]
- 33.Vidal S, Scheithauer BW, Kovacs K. Vascularity in nontumorous human pituitaries and incidental microadenomas: a morphometric study. Endocr Pathol. 2000;11:215–27. doi: 10.1385/ep:11:3:215. [DOI] [PubMed] [Google Scholar]
- 34.Kristof RA, Aliashkevich AF, Hans V, Haun D, Meyer B, Thees C, et al. The regional oxygen saturation of pituitary adenomas is lower than that of the pituitary gland: microspectrophotometric study with potential clinical implications. Neurosurgery. 2003;53:880–5. doi: 10.1227/01.neu.0000083604.09901.f6. discussion 5–6. [DOI] [PubMed] [Google Scholar]
- 35.Zhang H, Ma X, Peng S, Nan X, Zhao H. Differential expression of MST4, STK25 and PDCD10 between benign prostatic hyperplasia and prostate cancer. Int J Clin Exp Pathol. 2014;7:8105–11. [PMC free article] [PubMed] [Google Scholar]
- 36.Gao J, Aksoy BA, Dogrusoz U, Dresdner G, Gross B, Sumer SO, et al. Integrative analysis of complex cancer genomics and clinical profiles using the cBioPortal. Sci Signal. 2013;6:pl1. doi: 10.1126/scisignal.2004088. [DOI] [PMC free article] [PubMed] [Google Scholar]
- 37.Cerami E, Gao J, Dogrusoz U, Gross BE, Sumer SO, Aksoy BA, et al. The cBio cancer genomics portal: an open platform for exploring multidimensional cancer genomics data. Cancer Discov. 2012;2:401–4. doi: 10.1158/2159-8290.CD-12-0095. [DOI] [PMC free article] [PubMed] [Google Scholar]