Abstract
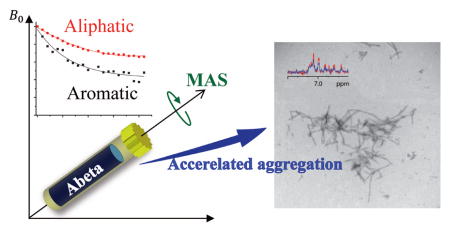
Proton magic-angle-spinning NMR used for real-time analysis of amyloid aggregation reveals that the mechanical rotation of Aβ1–40 monomers increases the rate of formation of aggregates, and that the increasing lag-time with peptide concentration suggests the formation of growth-incompetent species. EGCG’s ability to shift off-pathway aggregation is also demonstrated.
Graphical Abstract
The accumulation of misfolded proteins is the hallmark of numerous aging-related amyloid diseases including Alzheimer’s disease (AD),1,2 type II diabetes,3 and Parkinson’s disease.4 These disorders are called amyloidosis, which are major threats to quality of life in modern society and global economy.5,6 It is believed that the aggregation process starts from monomers, followed by the formation of oligomers and then ends with long fibrous end products.7 Biophysical methods such as thioflavin T (ThT) fluorescence, Circular Dichroism (CD), Dynamic Light Scattering (DLS), and Transmission Electron Microscopy (TEM) are typically used to study the aggregation process.5,8 While these measurements are highly valuable in providing the rate, secondary structure, and the size of aggregates in a time course manner, they cannot reveal specific molecular-level interactions that drive the aggregation process, and the formation of oligomeric intermediates cannot be detected. Due to lack of appropriate detection tools, a detailed knowledge of the aggregation process at molecular-level is still missing, which is of crucial importance to understand the pathogenic mechanism of amyloid proteins and to develop potential therapeutic treatments for amyloidosis. As aggregation progressively develops, a variety of species can coexist with conversions between them.8 The heterogeneous and transient nature of these oligomeric species pose tremendous challenges to traditional high-resolution techniques. Commonly used biophysical techniques fall short in probing residue specific changes; and although solution NMR spectroscopy is suitable for tracking the aggregation in real time, and molecular level interactions,9,10 the aggregation doesn’t usually proceed efficiently for most unseeded samples under quiescent and small-concentration conditions.11–13 Although physical effects such as shear stress,14 pressure jump15 and centrifugation16 during the course of measurement enables real-time analysis with NMR, they are still difficult to apply to monitor a real-time aggregation process. In addition, solution NMR spectroscopy has limitations in detecting species that undergo slow motion such as semi-solids or solid aggregates. On the other hand, solid-state MAS NMR provided valuable insights into the formation of oligomers and fibers for amyloid proteins.
In this study, we report the use of 1H MAS NMR experiments to monitor the aggregation kinetics of amyloid-forming proteins. By measuring the reduction in peak intensities in the 1H NMR spectrum due to Aβ1–40 aggregation (Figure S1), the rate of change in the mobility for each functional group of the peptide in real time was estimated. To test if this method can be used to monitor amyloid aggregation in presence of inhibitors, experiments were performed by monitoring the effect of EGCG (Figure S2), and found that the binding of EGCG to Aβ1–40 resulted in the formation of unstructured oligomers by inhibiting the formation of fibers which is in accordance to previous studies.17–19
1H NMR spectra of Aβ1–40 in pH 7.4 phosphate buffer were collected in a time-course manner under 5 kHz MAS (Figure S3). Peak intensities for different chemical groups of the peptide as a function of aggregation time were measured (Figure S4); two representative plots are shown in Figure 1. The total signal intensity of Aβ1–40 was found to decrease over time, and the rates of intensity decays were found to be similar for both aromatic and aliphatic protons under the experimental conditions employed as shown in Figure 1. The observed decrease in the signal intensity is attributed to peptide aggregation under the mechanical rotation of the sample. Dipolar interactions among protons associated with large non-monomeric species must increase sufficiently to be the major cause for the fast spin-spin relaxation as reflected in the line broadening, and thus contributing to the loss of signal intensities. The total weights of the MAS rotor (with the sample) measured before and after NMR experiments were found to be identical suggesting that the loss of signal intensities cannot be due to water evaporation or leakage of Aβ40 solution. At the same time, no changes were observed from 1D 1H NMR spectra (Figure S5) and 2D 1H/15N SOFAST-HMQC or 2D 1H/15N HSQC spectra of the Aβ40 peptide solution suggesting that the peptide does not aggregate at least for 24 hours under room temperature for a peptide concentration at least up to 50 μM under quiescent conditions, which has reported in previous studies.12,13 Therefore, our experimental results shown in Figure 1 indicate that Aβ1–40 aggregation is accelerated with the mechanical rotation of the sample under MAS condition. Since the MAS rotor was fully occupied by the Aβ1–40 solution sample without any air-water interface and the entire sample was spun at the magic angle, it is less likely that the rate of collision among monomers in the MAS rotor is different from that in a static sample. But, the fact that aggregation of monomers was observed only under spinning suggests that the initial sample (i.e., at time zero) might have contained a small amount of non-monomeric species. Even though the sample preparation was strictly and reproducibly followed to produce monomers and proven to be successful (based on ThT experiments, TEM images and solution NMR experiments), our results suggest that the presence of even a very small amount of non-monomeric aggregates can influence the rate of collision among monomers under spinning.20–22
Figure 1.
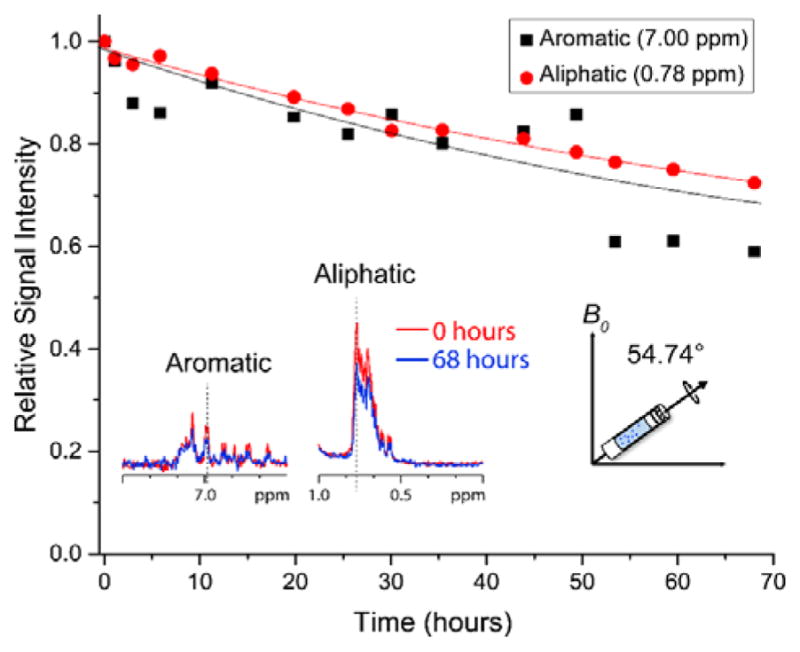
Real-time monitoring of Aβ1–40 monomer depletion under MAS. Experimentally measured 1H NMR signal intensities for selected aliphatic and aromatic resonances of freshly prepared 50 μM Aβ40 as a function of time under 5 kHz MAS and 298 K. Additional experimental results showing the decay of monomer peaks are shown in Figure S4. Time=0 was the starting time of NMR data acquisition, which is <10 minutes from the fresh sample preparation.
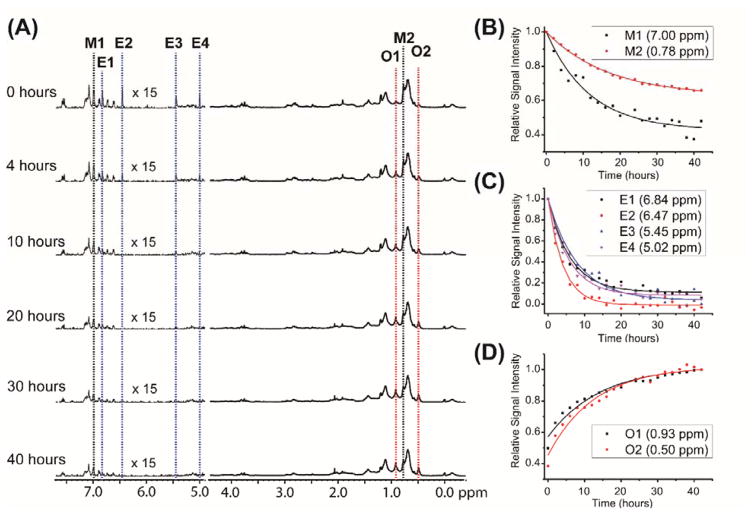
Next, we investigated the aggregation of Aβ1–40 in presence of EGCG (1:1 Aβ1–40 to EGCG molar ratio) using 1H MAS experiment as explained above. 1D 1H NMR spectra acquired at several different time points are shown in Figures 2 and S6. The KD value for the binding between Aβ1–40 monomer and EGCG has been reported as 47 μM23 and the analysis of chemical shift perturbation indicates that most of EGCG binds to Aβ1–40 under the condition used in this study.24 Similar to the observation for Aβ1–40 without EGCG presented above, signal intensities of Aβ1–40 decreased with time, however, in the presence of EGCG the signal from aromatic protons decreased faster than that from aliphatic protons of the peptide (Figure 2B). In addition, the signals from EGCG decreased in intensity rapidly with time (Figure 2C), which suggests the interaction between Aβ1–40 and EGCG is stronger than the interactions driving the self-aggregation of Aβ1–40. This observation is in agreement with a previous study that showed EGCG’s ability to push Aβ1–40 to form off-pathway oligomers.17 At the same time, it is interesting to note that the aromatic protons of Aβ1–40 showed a higher rate of decrease in signal intensity in the presence of EGCG than in its absence suggesting that the interactions between Aβ1–40 and EGCG are predominantly π-π interactions. This observation is in agreement with a previously reported study on the role of π-π interaction on the amyloid aggregation of amyloid-beta.25
Figure 2. Aβ1–40 monomer depletion promoted by EGCG.
(A) 1D 1H NMR spectra of 50 μM Aβ1–40 in presence of 50 μM EGCG obtained at the indicated times under 5 kHz MAS and 298 K. (B, C, D) Change in 1H signal intensities for selected aliphatic and aromatic resonances of Aβ1–40 (B), EGCG (C), and the newly appeared peaks (indicated as O1 and O2) (D). Additional experimental results on the changes in peak intensities are shown in Figures S6 and S7.
Another noteworthy observation is the appearance of new peaks (marked as O1 and O2 in Figure 2A), which were not observed for 50 μM Aβ1–40 without EGCG. These peaks exhibited a significant increase in intensity with time (Figure 2D). It is likely that these new peaks originate from Aβ1–40 due to the binding with EGCG or could be due to the formation of oligomeric species. To clarify the origin of these peaks, we examined various concentrations of Aβ1–40 samples in the absence of EGCG. To our surprise, these peaks appeared for Aβ1–40 only at lower concentrations (5 μM Aβ1–40 shown in Figure S7). Therefore, the appearance of the new rising peaks (labeled as O in Figure 2A) may not be due to the binding between Aβ1–40 and EGCG.
TEM images were obtained to check the morphologies of different Aβ1–40 samples after NMR measurements. As shown in Figure 4, Aβ1–40 samples in the absence and presence of EGCG display distinct morphologies. Oligomers and small fibers were observed for 50 μM Aβ1–40 in the absence of EGCG (Figure 3A), whereas amorphous structures were observed in the presence of EGCG (Figure 3B), suggesting that EGCG effectively inhibits Aβ1–40 fibril formation in agreement with previous studies.26 Similar amorphous structures were also observed for 5 μM Aβ1–40 although no EGCG was present in the sample (Figure 3C). Since all new rising peaks (labeled as O in Figure 2) were detected only for amorphous Aβ1–40 samples, we can assign these peaks to unstructured oligomers which are precursors of amorphous aggregates observed in the TEM images.
Figure 4.
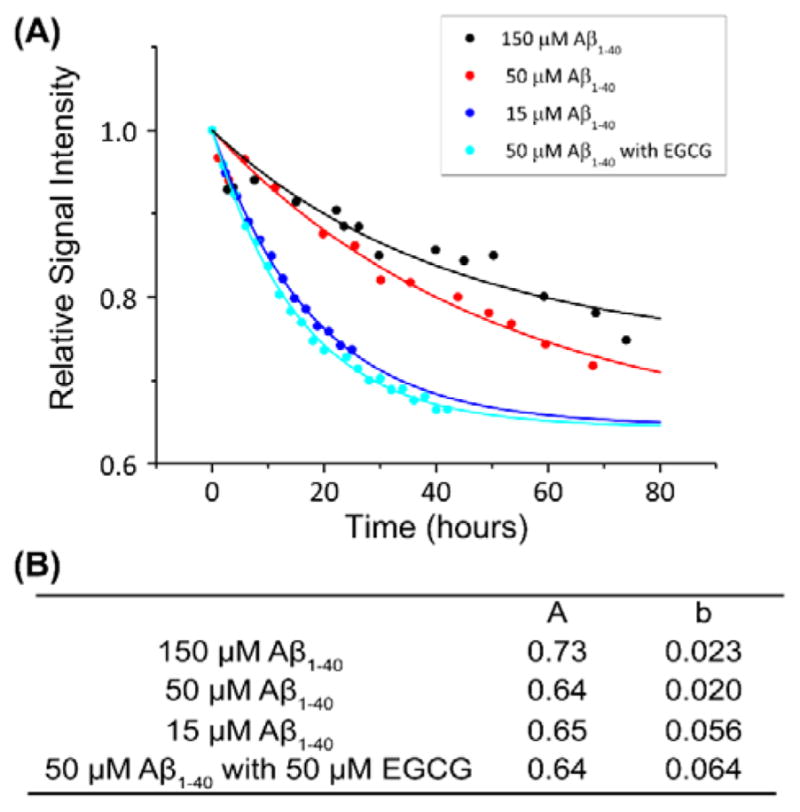
Concentration dependent monomer decay for Aβ40. (A) Aggregation kinetics of Aβ1–40 measured from 1H NMR signal intensity of methyl resonance (0.78 ppm) under 5 kHz MAS for various peptide concentrations. The monomer decay curve was fitted using the equation, y=(1−A)*exp(−b*x)+A. The parameters used for the monomer decay curves are given in (B). Additional experimental results on the changes in the peak intensities are shown in Figures S8 and S9 and Table S1.
Figure 3.
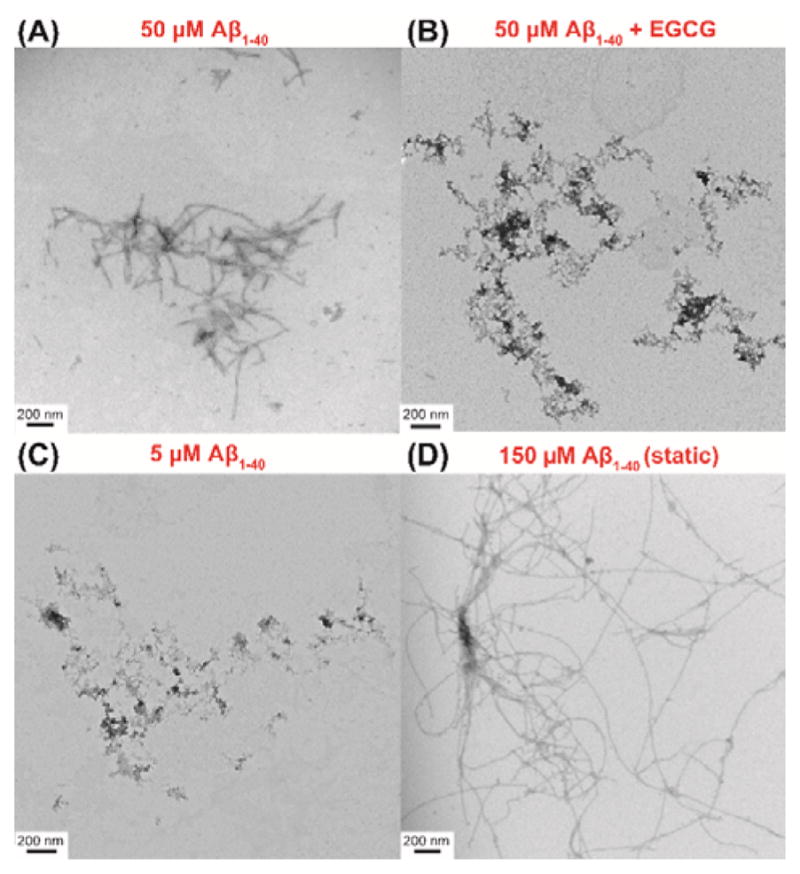
TEM images of Aβ1–40 aggregates. TEM images of 50 μM Aβ1–40 after spinning for 68 hours in the absence (A) and presence of 50 μM EGCG (1:1 Aβ1–40:EGCG molar ratio) after spinning for 42 hours (B). TEM images of 5 μM Aβ1–40 after spinning for 80 hours (C) and 150 μM Aβ1–40 under static condition after 48 hours (D).
In order to understand the effect of peptide concentration on two different types of aggregate formation, experiments were performed to monitor the aggregation kinetics at various concentrations of Aβ1–40 (Figure 4A). The dephasing rate was analyzed based on exponential fitting equation (y=(1−A)*exp(−b*x)+A). In this equation, parameters A and b are the asymptotic value which stands for the proportion that remains as monomer after saturation, and the rate of decay which stands for the rate of aggregation, respectively. The parameters under each condition is shown in Figure 4B. The observed concentration dependence under MAS is contrary to the conventional understanding of amyloid aggregation; the decreasing rate of signal intensity is higher for a lower concentration of the peptide, where the formation of amorphous aggregates is preferred; this is similar to the previously reported disordered oligomers of Aβ1–40.27 This observation could be due to the formation of growth incompetent off pathway aggregates as reported for other amyloid systems.28–30
In conclusion, we have shown that 1H MAS NMR can be used to monitor the real-time aggregation process of an amyloid protein. In this approach, the experimentally measured rates of signal intensity decays caused by the un-averaged dipolar couplings among protons provided a measurement of the rate of peptide aggregation under different conditions. Some residue-specific kinetic information was obtained through the aggregation time courses, and the role of strong π-π interaction between EGCG and Aβ1–40 in shifting Aβ1–40 aggregation off-pathway is also reported. Therefore, this simple NMR approach could be used to distinguish the specific molecular interactions contributing to the aggregation process. In addition, we believe that the small amount of peptide required and the fast data collection would enable high-resolution structural studies on amyloid proteins, especially the short-lived oligomeric intermediates that exhibit the maximum cellular toxicity.
Supplementary Material
Acknowledgments
This study was supported by funds from NIH (AG048934 to A. R.). T.Y. was supported by NIH funds and overseas Postdoctoral Fellowship from Uehara Memorial Foundation.
Footnotes
Electronic Supplementary Information (ESI) available: Experimental procedure, The sequence of Aβ40 peptide, chemical structure of EGCG, 1D 1H spectrum and detailed signal decay obtained in 1H NMR experiment. See DOI: 10.1039/x0xx00000x
Conflicts of interest
The authors declare no competing financial interests.
Notes and references
- 1.Jakob-Roetne R, Jacobsen H. Angew Chem Int Ed. 2009;48:3030. doi: 10.1002/anie.200802808. [DOI] [PubMed] [Google Scholar]
- 2.Hardy J, Selkoe DJ. Science. 2002;297:353. doi: 10.1126/science.1072994. [DOI] [PubMed] [Google Scholar]
- 3.Stumvoll M, Goldstein BJ, van Haeften TW. The Lancet. 2005;365:1333. doi: 10.1016/S0140-6736(05)61032-X. [DOI] [PubMed] [Google Scholar]
- 4.Spillantini MG, Schmidt ML, Lee VM-Y, Trojanowski JQ, Jakes R, Goedert M. Nature. 1997;388:839. doi: 10.1038/42166. [DOI] [PubMed] [Google Scholar]
- 5.Chiti F, Dobson CM. Annu Rev Biochem. 2006;75:333. doi: 10.1146/annurev.biochem.75.101304.123901. [DOI] [PubMed] [Google Scholar]
- 6.Stefani M, Dobson CMJ. Mol Med. 2003;81:678. doi: 10.1007/s00109-003-0464-5. [DOI] [PubMed] [Google Scholar]
- 7.Benilova I, Karran E, De Strooper B. Nat Neurosci. 2012;15:349. doi: 10.1038/nn.3028. [DOI] [PubMed] [Google Scholar]
- 8.Levine H., 3rd Protein Sci. 1993;2:404. doi: 10.1002/pro.5560020312. [DOI] [PMC free article] [PubMed] [Google Scholar]
- 9.Balbach J, Forge V, van Nuland NA, Winder SL, Hore PJ, Dobson C. Nat Struct Mol Biol. 1995;2:865. doi: 10.1038/nsb1095-865. [DOI] [PubMed] [Google Scholar]
- 10.Killick TR, Freund SM, Fersht AR. Protein Sci. 1999;8:1286. doi: 10.1110/ps.8.6.1286. [DOI] [PMC free article] [PubMed] [Google Scholar]
- 11.Suzuki Y, Brender JR, Soper MT, Krishnamoorthy J, Zhou Y, Ruotolo BT, Kotov NA, Ramamoorthy A, Marsh NG. Biochemistry. 2013;52:1903. doi: 10.1021/bi400027y. [DOI] [PMC free article] [PubMed] [Google Scholar]
- 12.Fawzi NL, Ying J, Torchia DA, Clore GM. J Am Chem Soc. 2010;132:9948. doi: 10.1021/ja1048253. [DOI] [PMC free article] [PubMed] [Google Scholar]
- 13.Yan Y, Wang CA. J Mol Biol. 2006;364:853. doi: 10.1016/j.jmb.2006.09.046. [DOI] [PubMed] [Google Scholar]
- 14.Morimoto D, Walinda E, Iwakawa N, Nishizawa M, Kawata Y, Yamamoto A, Shirakawa M, Scheler U, Sugase K. Anal Chem. 2017;89:7286. doi: 10.1021/acs.analchem.7b01816. [DOI] [PubMed] [Google Scholar]
- 15.Kamatari Y, Yokoyama S, Tachibana H, Akasaka K. J Mol Biol. 2005;349:916. doi: 10.1016/j.jmb.2005.04.010. [DOI] [PubMed] [Google Scholar]
- 16.Bertini I, Gallo G, Korsak M, Luchinat C, Mao J, Ravera E. Chembiochem. 2013;14:1891. doi: 10.1002/cbic.201300141. [DOI] [PubMed] [Google Scholar]
- 17.Ehrnhoefer DE, Bieschke J, Boeddrich A, Herbst M, Masino L, Lurz R, Engemann S, Pastore A, Wanker EE. Nat Struct Mol Biol. 2008;15:558. doi: 10.1038/nsmb.1437. [DOI] [PubMed] [Google Scholar]
- 18.Amo J, Fink U, Dasari M, Grelle G, Wanker EE, Bieschke J, Reif B. J Mol Biol. 2012;421:517. doi: 10.1016/j.jmb.2012.01.013. [DOI] [PubMed] [Google Scholar]
- 19.Suzuki Y, Brender JR, Hartman K, Ramamoorthy A, Marsh NG. Biochemistry. 2012;51:8154. doi: 10.1021/bi3012548. [DOI] [PMC free article] [PubMed] [Google Scholar]
- 20.Nag S, Sarkar B, Bandyopadhyay A, Sahoo B, Sreenivasan VKA, Kombrabail M, Muralidharan C, Maiti S. J Biol Chem. 2011;286:13827. doi: 10.1074/jbc.M110.199885. [DOI] [PMC free article] [PubMed] [Google Scholar]
- 21.Lomakin A, Chung DS, Benedek GB, Kirschner DA, Teplow DB. Proc Natl Acad Sci USA. 1996;93:1125. doi: 10.1073/pnas.93.3.1125. [DOI] [PMC free article] [PubMed] [Google Scholar]
- 22.Brender JR, Krishnamoorthy J, Sciacca MFM, Vivekanandan S, D’Urso L, Chen J, La Rosa C, Ramamoorthy A. J Phys Chem B. 2015;119:2886. doi: 10.1021/jp511758w. [DOI] [PMC free article] [PubMed] [Google Scholar]
- 23.Hyung S-J, DeToma AS, Brender JR, Lee S, Vivekanandan S, Kochi A, Choi J-S, Ramamoorthy A, Ruotolo BT, Lim MH. Proc Natl Acad Sci USA. 2013;110:3743. doi: 10.1073/pnas.1220326110. [DOI] [PMC free article] [PubMed] [Google Scholar]
- 24.Ahmed R, VanSchouwen B, Jafari N, Ni X, Ortega J, Melacini G. J Am Chem Soc. 2017;139:13720. doi: 10.1021/jacs.7b05012. [DOI] [PubMed] [Google Scholar]
- 25.Cohen T, Frydman-Marom A, Rechter M, Gazit E. Biochemistry. 2006;45:4727. doi: 10.1021/bi051525c. [DOI] [PubMed] [Google Scholar]
- 26.Choi Y-T, Jung C-H, Lee S-R, Bae J-H, Baek W-K, Suh M-H, Park J, Park C-W, Suh S-I. Life Sci. 2001;70:603. doi: 10.1016/s0024-3205(01)01438-2. [DOI] [PubMed] [Google Scholar]
- 27.Kotler SA, Brender JR, Vivekanandan S, Suzuki Y, Yamamoto K, Monette M, Krishnamoorthy J, Walsh P, Cauble M, Holl MMB, Marsh ENG, Ramamoorthy A. Sci Rep. 2015;5:11811. doi: 10.1038/srep11811. [DOI] [PMC free article] [PubMed] [Google Scholar]
- 28.Kashchiev D. J Phys Chem B. 2017;121:35. doi: 10.1021/acs.jpcb.6b09302. [DOI] [PubMed] [Google Scholar]
- 29.Kamgar-Parsi K, Hong L, Naito A, Brooks CL, Ramamoorthy A. J Biol Chem. 2017;292:14963. doi: 10.1074/jbc.M117.791236. [DOI] [PMC free article] [PubMed] [Google Scholar]
- 30.Young LJ, Schierle GSK, Kaminski C. Phys Chem Chem Phys. 2017;19:27987. doi: 10.1039/c7cp03412a. [DOI] [PMC free article] [PubMed] [Google Scholar]
Associated Data
This section collects any data citations, data availability statements, or supplementary materials included in this article.


