

Abstract
We evaluated use of a program to improve blood pressure measurement at 6 primary care clinics over a 6‐month period. The program consisted of automated devices, clinical training, and support for systems change. Unannounced audits and electronic medical records provided evaluation data. Clinics used devices in 81.0% of encounters and used them as intended in 71.6% of encounters, but implementation fidelity varied. Intervention site systolic and diastolic blood pressure with terminal digit “0” decreased from 32.1% and 33.7% to 11.1% and 11.3%, respectively. Improvement occurred uniformly, regardless of sites’ adherence to the measurement protocol. Providers rechecked blood pressure measurements less often post‐intervention (from 23.5% to 8.1% of visits overall). Providers at sites with high protocol adherence were less likely to recheck measurements than those at low adherence sites. Comparison sites exhibited no change in terminal digit preference or repeat measurements. This study demonstrates that clinics can apply a pragmatic intervention to improve blood pressure measurement. Additional refinement may improve implementation fidelity.
Keywords: blood pressure measurement, chronic disease, hypertension, implementation science, primary care, quality improvement
1. INTRODUCTION
Clinic‐based blood pressure (BP) measurement, which guides clinicians’ decisions for diagnosing and treating hypertension, has not changed substantively over the past century.1 Recommended BP measurement procedures are difficult to perform in real‐world settings and sensitive to technique‐related errors.2, 3 Although hypertension guidelines derive treatment thresholds from studies linking specific BP values with different levels of cardiovascular risk,4, 5, 6 most practicing clinicians recognize that clinic‐based BP measurements are not equivalent to those obtained in research studies.7, 8, 9, 10 Clinic BP measurement procedures are commonly characterized by flaws including using substandard measurement technique11 and terminal digit preference (TDP; ie, rounding BP readings to a value ending in zero),12 which in turn leads to both under‐ and overestimation of the “true” BP.13, 14 Indeed, studies suggest that primary care physicians (PCPs) may treat hypertension at different thresholds than those recommended by guidelines15, 16 or delay treatment due to uncertainty about a patient's “true” BP.17 Furthermore, many PCPs routinely repeat BP measurements obtained by medical assistants, even though they would not do so for more reliable measures such as temperature or body weight.18
Prior authors have suggested reeducating health professionals in recommended measurement techniques, but education alone does not improve the quality of BP measurement.19 Others have called for increased regulatory oversight to ensure compliance with BP measurement standards,20 but compliance programs would be logistically difficult to implement and sustain, as many components of BP measurement are challenging to routinely observe.18
A key issue hindering the effectiveness of these strategies is that recommended BP measurement techniques are often viewed as time‐consuming and too impractical to apply routinely in real‐world practice.11, 21, 22 Thus, a more promising approach is a multi‐component “quality‐improvement bundle” that supports staff training in BP measurement by combining the use of automated BP measurement devices with workflow redesign informed by human factors/ergonomic principles.18 Automated monitors require less staff training to use reliably and many devices allow patients to receive multiple BP measurements without staff presence.23 Additionally, changes in clinical workflow or in the layout of exam rooms can support staff training in BP measurement guidelines by “making it easy to do the right thing.”
We conducted this study to evaluate the adoption, implementation, and effectiveness of a BP measurement bundle that combines staff training with automated BP measurement devices and a redesigned workflow.
2. METHODS
2.1. Context and setting
The BP measurement intervention occurred as part of Project ReD CHiP (Reducing Disparities and Controlling Hypertension in Primary Care), a multi‐level pragmatic trial of system‐level interventions for improving BP control and reducing hypertension‐related racial disparities.24 The Johns Hopkins Medicine Institutional Review Board (IRB) and the Clinical Research Committee of Johns Hopkins Community Physicians (JHCP) approved this study. The IRB waived patient informed consent.
Intervention clinics were selected based on their proximity to Baltimore, Maryland, and on the racial and ethnic diversity of their patient populations. Four clinics were in medically underserved areas. To minimize risk for selection bias due to the non‐randomized study design, comparison clinics were selected using propensity score matching with one‐to‐one nearest‐neighbor matching from among the 18 other network clinics, which were similar in characteristics and probability of participation to the 6 intervention clinics.25, 26, 27, 28, 29 The propensity model included site‐level patient characteristics (average age, % aged 65 years or older, % African‐American, and an overall race distribution index, calculated as the sum of the squares of each race's proportion), practice characteristics (number of family practice and internal medicine physicians and number of other specialists), and neighborhood characteristics (% African‐American residents and median income in the practice's county). One matched comparison clinic was particularly small; therefore, we included the first and second closest match for its corresponding intervention site to obtain a comparable patient sample size in the comparison group.
Intervention sites employed an average of 9 PCPs (range: 3‐18 per clinic) and 8.8 certified medical assistants (CMAs; range: 4‐15 per clinic). Comparison clinics employed an average of 6.4 PCPS (range: 2‐15 per clinic) and 8.9 CMAs (range: 3‐14 per clinic). As part of JHCP's routine organizational procedures, nurses from the practice network's central staff‐training department ensured BP measurement quality by assessing all CMAs with a written and practical test at the time of hire and with direct observation of technique annually thereafter. Prior to the intervention, clinic staff measured BP manually using wall‐mounted aneroid sphygmomanometers. Consistent with other real‐world practices, clinical staff at intervention and comparison clinics did not consistently provide patients with a pre‐measurement rest period and did not routinely calculate the average of multiple BP readings, as recommended in BP measurement guidelines.
2.2. Intervention bundle
The research team implemented the BP measurement bundle at one intervention site per month between April 19, 2011 and September 9, 2011. The bundle consisted of three components (see Box 1 and Appendix S1). First, we provided intervention sites with 1 Omron HEM‐907XL (Kyoto, Japan) automated device per rooming staff member, plus 1 back‐up device for every 10 PCPs at the site. Omron devices are validated to international standards30, 31 for measuring BP. In contrast to manual sphygmomanometers, automated devices measure BP use the oscillometric method, which minimizes the potential for technique‐related errors.32, 33, 34 Key features of this device include a digital readout of BP values and a dial to toggle between “Single mode” (which takes one measurement only) and a programmable “Average mode” (which takes multiple measurements and calculates the average BP value). Using the device in Average mode—described henceforth as “the protocol”—promoted adherence to BP measurement guidelines by adding a 3‐minute delay between device activation and cuff inflation (thus promoting a “rest period”), automatically obtaining 3 BP readings at 30‐second intervals, and displaying the mean value of all BP readings so that users did not have to calculate an average reading. At the time of this study, each Omron device cost $530.
Box 1. Components of ReD CHiP blood pressure measurement intervention.
1.
-
1
Automated blood pressure measurement device (Omron HEM‐907XL)
Mounted on rolling stand with basket that ensures full range of cuff sizes, tubing, thermometer, and other necessary items are immediately available
Oscillometry method avoids common deficiencies associated with manual BP measurement, including rapid cuff deflation and incorrectly identifying Korotkoff sounds
Programmed to automatically provide timed rest period and then obtain 3 consecutive measurements without presence of healthcare worker
-
2
BP measurement protocol
Comfortably seat patient in chair with back support
Use appropriate cuff size on upper arm
Ensure patient's arm is supported at heart level
Ensure patient's legs are uncrossed
Ensure patient's feet are supported by floor or step‐stool
Ask patient to rest quietly throughout all 3 measurements
Use automated device to obtain 3 consecutive measurements
-
3
Weekly follow‐up with clinical staff (participatory action research)
Engaged clinical staff in identifying barriers to implementing the intervention
Helped clinical staff develop solutions relevant to their local context
Served as clearinghouse for disseminating one clinic's solutions to other sites
Although AHA guidelines recommend obtaining 2 or more BP measurements ≥1‐minute apart, the evidence cited for this recommendation addresses the value for obtaining multiple measurements not the interval between them. Additionally, the U.S. National Center for Health Statistics measured BP at 30‐second intervals when validating the Omron HEM‐907 for use in the National Health and Nutrition Examination Survey.34 Thus we used the shorter interval to facilitate clinical workflow.
Other commercially available devices offer similar features. We selected this device with input from JHCP clinical leaders because it provided clinic staff members with flexibility in whether or not to use the automated, but time‐consuming, features by toggling between Single and Average mode. Comparison clinics continued to use routine BP measurement practices throughout the study period.
Second, PCPs and CMAs received role‐specific training in the new process during 60‐minute educational sessions prior to implementation. After the initial training sessions, PCPs and CMAs received no additional education beyond what JHCP normally required as part of its annual competency evaluation. PCPs received a presentation from an American Society of Hypertension‐certified physician (GPP) and a physician with quality improvement expertise (RTB), who briefly presented the intervention, summarized American Heart Association (AHA) guidelines for BP measurement,2 described evidence for the oscillometric method's validity, and emphasized the potential for the intervention to reduce PCP workload. Following the presentation, the PCPs participated in an extended discussion, in which investigators addressed concerns PCPs raised (eg, uncertainty about automated devices’ accuracy and the protocol's potential to hinder workflow).
Certified medical assistants received training from a nurse trainer with expertise in blood pressure measurement (JMC). CMA training combined didactic and hands‐on learning. It focused on using the Omron device and stressed the importance of proper patient positioning, with specific emphasis on ensuring that the patient is seated comfortably with back supported, arm supported at heart level, legs uncrossed, and feet flat on the floor or a step stool. Clinic managers directly observed each CMA performing the new techniques and certified them to use the devices based on a checklist. Implementation training occurred at one site per month until all intervention sites had received the intervention.
Primary care clinics have multiple options for estimating blood pressure including office‐based measurement with an automated device, in which health care workers use an automated device to measure blood pressure; and “automated office blood pressure” (AOBP), in which a patient's BP is measured with a fully automated device without the presence of a health care worker.35 In this study, we evaluated the use of office‐based BP measurement, as intervention clinics lacked the space necessary to provide AOBP to all patients and this approach was the closest fit to the clinics’ existing workflow. Although we informed CMAs that they could leave the room to perform other tasks such as preparing vaccines, we did not require their absence during BP measurement. Additionally, all intervention clinics continued to use BP ≥ 140/90 mm Hg as the treatment cutoff since lower thresholds are recommended only for AOBP, home BP monitoring, and 24‐hour ambulatory BP monitoring.35
Third, members of the research team visited each site weekly for at least 24 weeks after implementation. In this capacity, research assistants acted as quality improvement facilitators to address barriers to adopting the intervention. For example, in order to ensure that CMAs had immediate access to a full range of cuff sizes, research staff helped clinic administrators obtain replacement BP cuffs if any were lost or damaged. When a CMA at an intervention site generated an idea for overcoming an implementation issue, research staff also helped to disseminate the CMA's idea to other intervention sites if it was appropriate to share.
2.3. Evaluation framework
We applied four of five RE‐AIM domains to guide evaluation of this intervention (Figure 1).36 This evaluation framework categorizes outcomes into 5 domains, (1), Reach, defined as the proportion of a target population that participates in a program; (2), Efficacy, defined as the impact of a program on relevant outcomes; (3), Adoption, defined as the uptake of a program by a target population; (4), Implementation, defined as the degree to which participants apply a program as intended; and (5), Maintenance, defined as the extent to which a program becomes institutionalized as part of organizational practice. We hypothesized that after introduction of this intervention, (1), CMAs would use the Omron device (“Adoption”); (2), adhere to the protocol when using it (“Implementation”); (3), TDP would decrease and PCPs would perceive CMA's BP readings as credible enough to defer remeasuring BP during clinic visits (“Effectiveness”); and (4), clinics of varying sizes and patient populations would successfully adopt and implement the intervention bundle (“Reach”). Given the limited follow‐up time in this study, we did not assess “Maintenance.”
Figure 1.
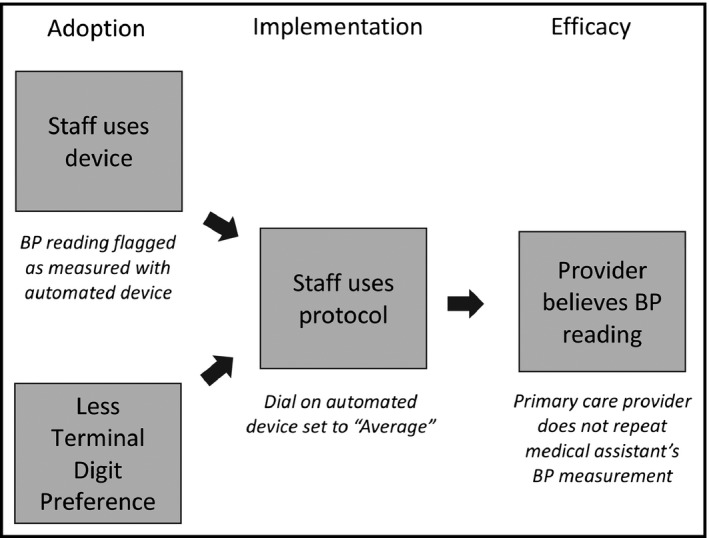
Evaluation framework. The model shows outcomes we anticipated if the blood pressure (BP) measurement bundle were adopted and implemented as intended by clinical staff. If clinical staff adopted the intervention, medical assistants (MAs) would use the automated BP measurement devices, as determined by high rates of flagging visits as having “electronic BP measurements,” and terminal digit preference (TDP) would also decrease. If clinical staff implemented the intervention as intended, medical assistants would use the automated devices in accordance with protocol, as determined by high rates of BP measurement devices with dials set to Average mode. If primary care providers perceived that MA‐measured BP readings as credible, they would repeat BP measurements less often, as determined by lower rates of repeated BP readings recorded in the electronic medical record
2.4. Assessing use of device and adherence to intervention protocol
To assess use of the automated devices, a check box labeled, “electronic blood pressure” was added to the electronic medical record (EMR). When CMAs recorded vital signs in the EMR, they flagged the visit if they measured BP with the device.
To assess adherence to the protocol, (ie, use of the device in Average mode), research staff covertly recorded whether each device was in‐use and whether it was set to “Single” or “Average” mode during weekly follow‐up visits. We then calculated the overall proportion of in‐use devices that were set to Average mode as a proxy for protocol adherence. Follow‐up visits occurred at different times of the day and on different days of the week, with sites receiving a median of 23.5 visits (range 20‐26 visits) during the 24‐week post‐implementation period.
2.5. Assessing intervention effect on quality of BP readings
To assess the intervention's effect on BP readings, we obtained BP data from the EMR for the period 24 weeks prior to the implementation of the intervention until 24 weeks after the implementation at the 6 intervention sites and a similar time period for the 7 comparison sites (24 weeks prior to, and after the week of, July 6, 2011). Measurements taken during the week of implementation were excluded from the analysis. We determined a priori that systolic BPs (SBPs) that were <30 mm Hg or >300 mm Hg, and diastolic BPs (DBPs) that were <30 mm Hg or >150 mm Hg would be deemed invalid and coded as “missing.” In total, we excluded no SBP values and 16 of 122 967 (0.01%) DBP values.
Certified medical assistants at all JHCP clinics routinely measure and record BP readings in the EMR during patient intake, prior to the PCP visit. If a PCP personally remeasures their patient's BP, they record their measurement in a second data field in the EMR instead of replacing the CMA's measurement. When a visit included more than one BP measurement, the first was assigned to the CMA and the second was assigned to the PCP.
2.6. Statistical methods
We summarized patient and practice characteristics at the intervention and comparison sites using means and standard deviations (SDs), medians and ranges, or frequencies and percentages. We compared these measures using t tests, Wilcoxon rank sum tests, or chi‐square tests. Bar charts of SBP and DBP measures were plotted pre‐ and post‐implementation and by intervention or comparison site. We calculated and compared the percent of SBP and DBP readings ending in zero, both pre‐and post‐implementation and by intervention or comparison site, using chi‐square tests. We calculated the proportion of encounters where BP measurement was repeated pre‐ and post‐implementation and the change for all sites. We also ranked the six intervention sites by adherence to the BP measurement protocol based on the percent of observations where automated BP measurement devices were set to Average instead of Single mode. We used Spearman correlation to compare the adherence with the change in BP measures, change in repeated measurements taken across sites, and proportion of patients with BP above goal pre‐intervention who then had BP below goal in the post‐intervention period. Analyses were performed using SAS version 9.3 (SAS Institute, Inc., Cary, NC, USA) and Stata IC 11.2 (Stata Corp., College Station, TX, USA). Because of concerns related to the large number of comparisons, we set significance at P < .001, except for the Spearman correlations (n = 6 sites) and the comparison of site characteristics, where significance was set at P < .05. All reported P values are two‐sided.
3. RESULTS
Table 1 compares patient characteristics at the intervention and comparison sites. During the study period, 45 357 patients received care during 123 511 encounters at intervention sites, while 40 131 patients received care during 105 209 encounters at comparison sites. Patients at intervention sites were also more likely to be African American and to be diagnosed with hypertension.
Table 1.
Characteristics of the patients seen at the intervention and comparison sites during the study perioda
| Characteristic | Intervention sites | Comparison sites | P valueb |
|---|---|---|---|
| Patients, N | 45 357 | 40 131 | |
| Clinics, N | 6 | 7 | |
| % African American in county | 42.4 | 39.1 | .511c |
| Median income in county, $ | 51 543.50 | 66 100.60 | .049c |
| Patients with more than one visit, N (%) | 29 160 (64.3) | 25 580 (63.7) | .096 |
| Age, mean (SD), years | 48.4 (17.0) | 47.7 (16.4) | <.001d |
| Female gender, N (%) | 28 261 (62.3) | 24 650 (61.4) | .008 |
| Ethnicity, N (%) | |||
| Hispanic | 1061 (2.3) | 1519 (3.8) | <.001 |
| Non‐Hispanic | 40 293 (88.8) | 33 934 (84.6) | |
| Other or undetermined | 4003 (8.8) | 4678 (11.7) | |
| Race, N (%) | |||
| African American | 18 943 (41.8) | 9352 (23.3) | <.001 |
| Asian or Pacific Islander | 863 (1.9) | 2137 (5.3) | |
| Native American | 116 (0.3) | 149 (0.4) | |
| White | 23 158 (51.1) | 24 031 (59.9) | |
| Other/multiracial | 1385 (3.0) | 1835 (4.6) | |
| Unknown | 892 (2.0) | 2627 (6.6) | |
| Diagnosis of, N (%) | |||
| Hypertension | 16 112 (35.5) | 10 695 (26.6) | <.001 |
| Diabetes | 6474 (14.3) | 4384 (10.9) | <.001 |
| Chronic kidney disease | 2843 (6.3) | 2033 (5.1) | <.001 |
| Cardiovascular disease | 9610 (21.2) | 6942 (17.3) | <.001 |
| Coronary artery disease | 2370 (5.2) | 1656 (4.1) | <.001 |
| Hyperlipidemia | 2445 (5.4) | 4200 (10.5) | <.001 |
For the intervention sites the study period was 24 wk before intervention implementation (range of April 19, 2011 to September 9, 2011) and 24 wk after implementation. For the comparison sites, the study period was 24 wk before and 24 wk after July 6, 2011.
P values are from chi‐square tests unless otherwise indicated.
P value from Wilcoxon rank sum test.
P value from two‐sample t test.
Table 2 shows uptake of the automated device and adherence to the protocol by intervention clinic site. Overall, intervention clinics used the automated devices in 81.0% of encounters and adhered to the protocol 71.6% of the time. However, uptake of the device and adherence to the protocol varied widely among sites.
Table 2.
Adoption and implementation rates for the blood pressure measurement bundle
| Site | Use of automated blood pressure measurement devicea, N (%) | Adherence to intervention protocolb, N (%) |
|---|---|---|
| Overall | 50 085/61 861 (81.0) | 788/1100 (71.6) |
| Site C | 17 247/19 870 (86.8) | 208/246 (84.6) |
| Site B | 6241/11 379 (54.8) | 211/278 (75.9) |
| Site F | 6120/6761 (90.5) | 88/118 (74.6) |
| Site A | 11 183/12 610 (88.7) | 196/264 (74.2) |
| Site D | 6706/7372 (91.0) | 67/102 (65.7) |
| Site E | 2588/3869 (66.9) | 18/92 (19.6) |
Adoption of the intervention defined as proportion of times that first blood pressure measurement recorded for each office visit was tagged as measured with an automated BP measurement device.
Adherence to intervention protocol defined as proportion of each clinic's automated BP measurement devices that were in‐use and set to “Average” mode during weekly, unannounced audits.
Figure 2 displays the distributions of SBP and DBP readings at the intervention sites, pre‐ and post‐implementation. It shows a preference for recording BP values ending in zero prior to the intervention and more normal BP distributions post‐implementation.
Figure 2.
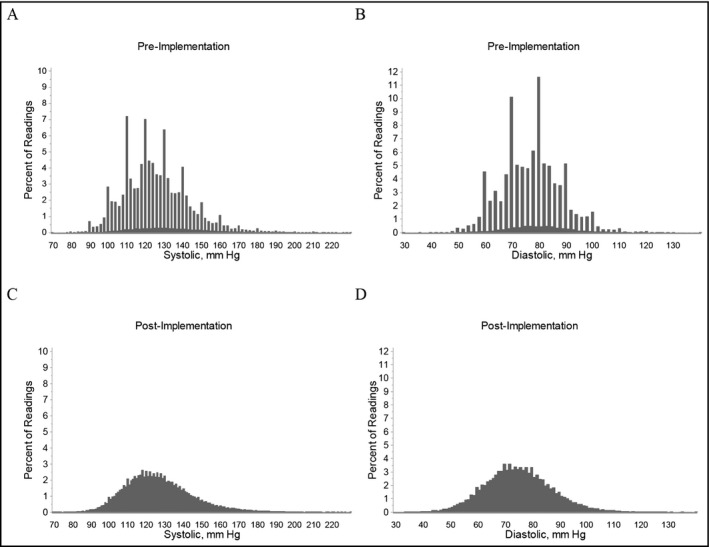
Distribution of blood pressure (BP) measurements pre‐ and post‐implementation at the six intervention sites. Frequency distribution of blood pressure (BP) measurements taken during the 24 wk prior to the implementation and the 24 wk after the implementation of the intervention. Upper panels demonstrate (A) systolic and (B) diastolic BP prior to the implementation. Lower panels demonstrate (C) systolic and (D) diastolic BP measurements after the implementation. Nearly all BP values prior to implementation were obtained using wall‐mounted aneroid device; nearly all BP values after implementation were obtained with the Omron HEM‐907XL
Figure 3 shows the intervention's effect on TDP. Prior to the intervention, most BP measurements were obtained with auscultatory sphygmomanometers, which are calibrated to provide BP measurements in 2 mm Hg increments; thus 20% of pre‐intervention BP readings were expected to end in zero. However, 32.1% of pre‐intervention SBP and 33.7% of pre‐intervention DBP readings ended in zero. BP measurements obtained with automated devices are calibrated to display BP readings in 1‐mm Hg increments; thus 10% of post‐intervention BP readings were expected to end in zero. Following the intervention, TDP among CMA‐recorded BP measurements decreased at all intervention sites; overall 11.1% of SBP and 11.3% of DBP readings ended in zero (upper panels, Figure 3). At comparison sites, the percent of SBP and DBP readings that ended in zero remained above 40% during both periods. Notably, in instances where PCPs at intervention sites repeated BP measurements, TDP remained constant in both periods, suggesting that for the most part, PCPs did not use the automated devices to repeat CMAs’ measurements (lower panels, Figure 3).
Figure 3.
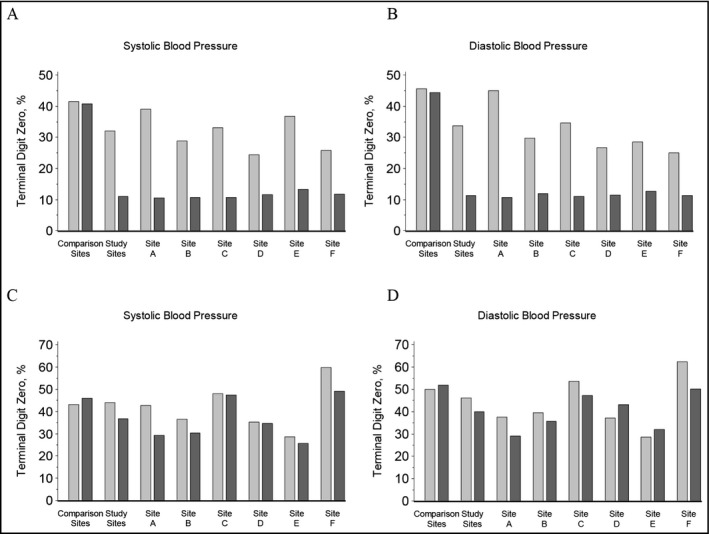
Percent of terminal digit blood pressure readings at the intervention and comparison sites. Blood pressure (BP) readings obtained by medical assistants (MAs) and (if performed) repeat BP readings obtained by primary care providers (PCPs) before and after the intervention. Upper panels demonstrate percent of (A) systolic and (B) diastolic BP readings obtained by MAs with terminal digit of zero at the comparison sites and intervention sites. Lower panels demonstrate percent of (C) systolic and (D) diastolic BP readings obtained by PCPs after an initial reading had been obtained by a MA at comparison and intervention sites. Light gray bars represent pre‐implementation readings and dark gray bars represent post‐implementation readings
The change in proportion of visits where PCPs repeated BP measurement and its association between site adherence to the protocol are shown in Table 3. Overall PCPs at intervention sites repeated CMAs’ initial BP measurement during 23.5% of pre‐intervention encounters and 8.1% of post‐intervention encounters. After implementation of the bundle, PCPs repeated BP measurements on higher initial readings than prior to implementation (data not shown). At intervention sites, adherence to the protocol was inversely correlated with the change in proportion of repeated BP measurements. At comparison sites, PCPs repeated BP measurements during 8.6% of pre‐intervention encounters and 7.9% of post‐intervention encounters.
Table 3.
Clinics’ adherence to the protocol and proportion of encounters where PCPs repeated BP measurements
| Site | Adherence to intervention protocola, N (%) | BP measurement repeated at encounter | Change, %b | |
|---|---|---|---|---|
| Pre‐intervention, % | Post‐intervention, % | |||
| Overall | 788/1100 (71.6) | 23.5 | 8.1 | −15.5 |
| Site C | 208/246 (84.6) | 30.5 | 7.5 | −23.0 |
| Site B | 211/278 (75.9) | 26.8 | 12.0 | −14.8 |
| Site F | 88/118 (74.6) | 17.2 | 5.5 | −11.7 |
| Site A | 196/264 (74.2) | 20.0 | 5.5 | −14.5 |
| Site D | 67/102 (65.7) | 19.2 | 8.8 | −10.4 |
| Site E | 18/92 (19.6) | 6.6 | 10.8 | +4.3 |
PCP, primary care provider; CMA, certified medical assistant; BP, blood pressure.
Adherence to intervention protocol defined as proportion of each clinic's automated BP measurement devices that were in‐use and set to “Average” mode during weekly, unannounced audits.
Spearman rank r = −.94, P = .005 for change in repeated blood pressure measurement with adherence to protocol.
4. DISCUSSION
This study describes an intervention to promote adherence to AHA recommendations for BP measurement.2 Prior studies have evaluated the effects of clinical education,37 automated devices,38 and workflow redesign on BP measurement quality.39 However, to our knowledge, this study is the first to combine these mutually reinforcing approaches into a bundled intervention.
Overall, clinics achieved robust, but imperfect, adoption and implementation of the intervention bundle. As measured by rates with which medical assistants flagged BP readings as “electronic reading,” clinics used the automated device in over four‐fifths of encounters, while unannounced audits found that 5 of 6 intervention clinics used the devices as intended at least two‐thirds of the time. Nevertheless, PCPs exhibited greater confidence in CMAs’ BP measurements after the intervention, as average rates of repeated BP measurements at intervention clinics decreased 15.5%. Furthermore, the change in rates of repeat measurements correlated inversely with the extent to which clinics’ adhered to the measurement protocol.
Taken together, the study findings have three important implications. First, they demonstrate it is possible to improve clinic‐based BP measurement in real‐world settings. Second, they suggest that isolated interventions are likely to be inadequate for achieving this goal. Ensuring that clinics measure BP reliably and accurately requires significant modifications to the workflow in “typical” primary care practices. Finally, they highlight how improving BP measurements quality can improve clinical efficiency, as well as patient care.
Giles and Egan previously estimated the time needed to perform each component of a BP measurement that adhered to AHA guidelines.21 Based on their estimates, performing a single, high‐quality BP measurement requires approximately 5 minutes. Thus a full‐time PCP who sees 20 patients per day would save nearly 1.5 hours per week if they relied on their CMA's BP reading instead of personally repeating the measurement. In reality, most PCPs do not measure BP as rigorously as the AHA recommends,11 which likely contributes to wide variability of readings recorded in real‐world settings.13 However, this estimate provides a starting point for comparing costs of this intervention against costs of measuring BP under usual care conditions. As we continue to refine this intervention, a key issue that must be overcome is the time pressure faced by primary care clinics. During weekly follow up visits, we provided CMAs and PCPs with a variety of strategies for integrating the BP measurement intervention into their workflow, yet staff repeatedly brought up concerns with the intervention's effect on clinical throughput. A study published after we introduced this program reported that single BP measurements pose little risk for misclassifying hypertensive patients as normotensive but frequently misclassify non‐hypertensive patients as hypertensive.40 It is possible that updating the protocol—so that clinics “screen” most patients’ BP in Single mode, and only “confirm” hypertension using Average mode when patients have high initial BPs—may improve implementation fidelity without reducing the intervention's clinical value.
As with every study, several limitations must be noted. First, the bundle was designed for use in clinic‐based settings, not emergency departments, or hospitals. However, primary care clinics, where hypertension is managed as a chronic condition, are much more likely to need precise blood pressure measurements than acute care settings. Second, this study was conducted in a single primary care network. Although it may not be generalizable to all primary care settings, we included clinics of varying sizes and from communities with a range of demographic and socioeconomic characteristics. Third, although we attempted to minimize the risk that unmeasured variables influenced our findings, intervention and propensity‐matched comparison clinics differed in terms of some size and patient characteristics. Thus, our evaluation cannot exclude the possibility that health care workers at comparison sites were less attuned to detecting and treating hypertension, as their patients were at lower baseline risk for cardiovascular disease. Indeed, PCPs at comparison clinics were less likely to repeat CMAs’ BP measurements at baseline, thus changes in repeat BP measurements at intervention sites may simply be explained by regression to mean. However, physicians repeating staff BP measurements is often described in the literature,18, 41 thus, we have reason to believe our intervention had a practical effect on standardizing medical practice. Finally, the overall value of our efforts remains uncertain, as a formal cost‐benefit analysis was beyond the scope of this study. Although implementing this program as described would require clinics to purchase automated BP measurement devices, allocate 1 hour of training time for all PCPs and clinical staff, and assign a quality improvement facilitator to offer follow‐up support, these costs are at least partially offset by time saved when PCPs forego rechecking CMAs’ BP readings and improved treatment decisions associated with having more reliable BP measurements.
5. CONCLUSIONS
Rigorous, standardized BP measurements are a critical component of team‐based hypertension care, yet the techniques used in typical primary care settings are often suboptimal. Our intervention, which bundles commercially available technology (automated BP measurement devices) with systems redesign, is readily adopted and can be used as intended in a variety of primary care settings. The intervention improves the quality of clinical BP measurements, as evidenced by nearly complete elimination of TDP, as well as the clinical credibility of BP readings, as evidenced by PCPs willingness to accept CMA‐measured BP without personally obtaining their own readings. Refinements to this bundle of interventions may further improve healthcare workers’ willingness and ability to implement the intervention as intended, thereby increasing its potential to improve hypertension care.
TRIAL REGISTRATION
ClinicalTrials.gov, NCT01566864, http://clinicaltrials.gov/ct2/show/NCT01566864.
Registration retrospectively received March 22, 2012, Enrollment April 19, 2011.
ETHICS APPROVAL AND CONSENT TO PARTICIPATE
The Johns Hopkins Medicine institutional review board (IRB) and the Clinical Research Committee of Johns Hopkins Community Physicians approved this study. The IRB waived patient informed consent.
CONSENT FOR PUBLICATION
LaPricia Lewis Boyer, depicted in Exhibit 3 of the Appendix S1, and Sarah J. Flynn, depicted in Exhibit 6 of the Appendix S1, have both signed consent for publication of their likenesses.
AVAILABILITY OF DATA AND MATERIAL
The datasets generated and/or analyzed in this study are not publicly available because they were clinical data abstracted from the electronic medical record using a HIPAA waiver. The corresponding author can facilitate submission of reasonable applications for summarized or de‐identified data from the clinics that participated in this study.
CONFLICT OF INTEREST STATEMENT
The authors declare that they have no competing interests.
AUTHOR CONTRIBUTIONS
RTB, KAC, and LAC designed the study. LAC obtained funding for the study and supervised its conduct through all stages of design, implementation, analysis, interpretation, and report writing. RTB, KAC, JAM, GJN, JMC, GPP, ERM, and LAC developed and refined the study protocol and refined it with contributions from all other co‐authors (KBD, YH, and SJF). RTB, KBD, GJN, SJF, JMC, and GPP implemented the study protocol. RTB, KAC, KBD, YH, and SJF collected data. RTB, KAC, JAM, YH, and LAC analyzed the data with contributions from other co‐authors (KBD, GJN, SJF, and ERM). RTB, KAC, and YH drafted the manuscript with critical review and editing contributed by all other co‐authors (KAM, KBD, GJN, SJF, JMM, GPP, ERM, and LAC). All authors read and approved the final manuscript.
Supporting information
ACKNOWLEDGMENTS
The authors thank all of the workgroup members, trainees, research staff and administrative staff at the Johns Hopkins Center for Health Equity (formerly the Johns Hopkins Center to Eliminate Cardiovascular Health Disparities), as well as all of the participating providers, staff members, organizational leaders and patients at participating Johns Hopkins Community Physicians sites for making the completion of this study possible. The authors also wish to acknowledge Crystal Salcido for her assistance with data collection, the members of the Johns Hopkins Center for Health Equity Community Advisory Board for guidance throughout the project; and Mary Twomley for her project management during early stages of the project. At the time this study was conducted, Dr. Noronha was Office Medical Director for Wyman Park Internal Medicine and Director of Research at Johns Hopkins Community Physicians.
Boonyasai RT, Carson KA, Marsteller JA, et al. A bundled quality improvement program to standardize clinical blood pressure measurement in primary care. J Clin Hypertens. 2018;20:324–333. 10.1111/jch.13166
Funding information
National Heart, Lung, and Blood Institute, Grant/Award Numbers: P50HL0105187 and K24HL083113). NHLBI had no role in the design and conduct of the study; collection, management, analysis, and interpretation of the data; preparation or approval of the manuscript; or decision to submit the manuscript for publication.
REFERENCES
- 1. Crenner CW. Introduction of the blood pressure cuff into U.S. medical practice: technology and skilled practice. Ann Intern Med. 1998;128:488‐493. [DOI] [PubMed] [Google Scholar]
- 2. Pickering TG, Hall JE, Appel LJ, et al. Recommendations for blood pressure measurement in humans and experimental animals: part 1: blood pressure measurement in humans: a statement for professionals from the Subcommittee of Professional and Public Education of the American Heart Association Council on High Blood Pressure Research. Circulation. 2005;111:697‐716. [DOI] [PubMed] [Google Scholar]
- 3. Parati G, Stergiou G, O'Brien E, et al. European Society of Hypertension practice guidelines for ambulatory blood pressure monitoring. J Hypertens. 2014;32:1359‐1366. [DOI] [PubMed] [Google Scholar]
- 4. Paul O, Lepper MH, Phelan WH, et al. A longitudinal study of coronary heart disease. Circulation. 1963;28:20‐31. [DOI] [PubMed] [Google Scholar]
- 5. Veterans Administration Cooperative Study Group on Antihypertensive Agents . Effects of treatment on morbidity in hypertension. Results in patients with diastolic blood pressures averaging 115 through 129 mm Hg. JAMA. 1967;202:1028‐1034. [PubMed] [Google Scholar]
- 6. Kannel WB, Wolf PA, Verter J, McNamara PM. Epidemiologic assessment of the role of blood pressure in stroke. The Framingham study. JAMA. 1970;214:301‐310. [PubMed] [Google Scholar]
- 7. Kim JW, Bosworth HB, Voils CI, et al. How well do clinic‐based blood pressure measurements agree with the mercury standard? J Gen Intern Med. 2005;20:647‐649. [DOI] [PMC free article] [PubMed] [Google Scholar]
- 8. Manzoli L, Simonetti V, D'Errico MM, et al. (In)accuracy of blood pressure measurement in 14 Italian hospitals. J Hypertens. 2012;30:1955‐1960. [DOI] [PubMed] [Google Scholar]
- 9. McKay DW, Campbell NR, Parab LS, Chockalingam A, Fodor JG. Clinical assessment of blood pressure. J Hum Hypertens. 1990;4:639‐645. [PubMed] [Google Scholar]
- 10. Villegas I, Arias IC, Botero A, Escobar A. Evaluation of the technique used by health‐care workers for taking blood pressure. Hypertension. 1995;26(Pt 2):1204‐1206. [DOI] [PubMed] [Google Scholar]
- 11. Kallioinen N, Hill A, Horswill MS, Ward HE, Watson MO. Sources of inaccuracy in the measurement of adult patients’ resting blood pressure in clinical settings: a systematic review. J Hypertens. 2017;35:421‐441. [DOI] [PMC free article] [PubMed] [Google Scholar]
- 12. Kim ES, Samuels TA, Yeh HC, et al. End‐digit preference and the quality of blood pressure monitoring in diabetic adults. Diabetes Care. 2007;30:1959‐1963. [DOI] [PubMed] [Google Scholar]
- 13. Powers BJ, Olsen MK, Smith VA, Woolson RF, Bosworth HB, Oddone EZ. Measuring blood pressure for decision‐making and quality reporting: where and how many measures? Ann Intern Med. 2011;154:781‐788, W‐289‐790. [DOI] [PubMed] [Google Scholar]
- 14. Sebo P, Pechere‐Bertschi A, Herrmann FR, Haller DM, Bovier P. Blood pressure measurements are unreliable to diagnose hypertension in primary care. J Hypertens. 2014;32:509‐517. [DOI] [PubMed] [Google Scholar]
- 15. Oliveria SA, Lapuerta P, McCarthy BD, L'Italien GJ, Berlowitz DR, Asch SM. Physician‐related barriers to the effective management of uncontrolled hypertension. Arch Intern Med. 2002;162:413‐420. [DOI] [PubMed] [Google Scholar]
- 16. Hyman DJ, Pavlik VN. Self‐reported hypertension treatment practices among primary care physicians: blood pressure thresholds, drug choices, and the role of guidelines and evidence‐based medicine. Arch Intern Med. 2000;160:2281‐2286. [DOI] [PubMed] [Google Scholar]
- 17. Kerr EA, Zikmund‐Fisher BJ, Klamerus ML, Subramanian U, Hogan MM, Hofer TP. The role of clinical uncertainty in treatment decisions for diabetic patients with uncontrolled blood pressure. Ann Intern Med. 2008;148:717‐727. [DOI] [PubMed] [Google Scholar]
- 18. Umscheid CA, Townsend RR. Is it time for a blood pressure measurement “bundle”? J Gen Intern Med. 2012;27:615‐617. [DOI] [PMC free article] [PubMed] [Google Scholar]
- 19. Glynn LG, Murphy AW, Smith SM, Schroeder K, Fahey T. Interventions used to improve control of blood pressure in patients with hypertension. Cochrane Database Syst Rev. 2010:CD005182. [DOI] [PubMed] [Google Scholar]
- 20. Appel LJ, Miller ER 3rd, Charleston J. Improving the measurement of blood pressure: is it time for regulated standards? Ann Intern Med. 2011;154:838‐840. [DOI] [PubMed] [Google Scholar]
- 21. Giles TD, Egan P. Pay (adequately) for what works: the economic undervaluation of office and ambulatory blood pressure recordings. J Clin Hypertens. 2008;10:257‐259. [DOI] [PMC free article] [PubMed] [Google Scholar]
- 22. Myers MG, Godwin M, Dawes M, Kiss A, Tobe SW, Kaczorowski J. Measurement of blood pressure in the office: recognizing the problem and proposing the solution. Hypertension. 2010;55:195‐200. [DOI] [PubMed] [Google Scholar]
- 23. Campbell NR, Berbari AE, Cloutier L, et al. Policy statement of the world hypertension league on noninvasive blood pressure measurement devices and blood pressure measurement in the clinical or community setting. J Clin Hypertens. 2014;16:320‐322. [DOI] [PMC free article] [PubMed] [Google Scholar]
- 24. Cooper LA, Marsteller JA, Noronha GJ, et al. A multi‐level system quality improvement intervention to reduce racial disparities in hypertension care and control: study protocol. Implement Sci. 2013;8:60. [DOI] [PMC free article] [PubMed] [Google Scholar]
- 25. D'Agostino RB. Propensity score methods for bias reduction in the comparison of a treatment to a non‐randomized control group. Stat Med. 1998;17:2265‐2281. [DOI] [PubMed] [Google Scholar]
- 26. Fraser MW. Intervention research in social work: recent advances and continuing challenges. Res Soc Work Pract. 2004;14:210‐222. [Google Scholar]
- 27. Guo SY, Barth RP, Gibbons C. Propensity score matching strategies for evaluating substance abuse services for child welfare clients. Child Youth Serv Rev. 2006;28:357‐383. [Google Scholar]
- 28. Rubin DB. Estimating causal effects from large data sets using propensity scores. Ann Intern Med. 1997;127:757‐763. [DOI] [PubMed] [Google Scholar]
- 29. Stuart EA. Developing practical recommendations for the use of propensity scores: discussion of ‘A critical appraisal of propensity score matching in the medical literature between 1996 and 2003’ by Peter Austin, statistics in medicine. Stat Med. 2008;27:2062‐2065. [DOI] [PubMed] [Google Scholar]
- 30. Association for the Advancement of Medical Instrumentation . American National Standard. Manual, Electronic, or Automated Sphygmomanometers ANSI/AAMI SP10‐2002/A1. Arlington, VA: AAMI; 2003. [Google Scholar]
- 31. O'Brien E, Pickering T, Asmar R, et al. Working group on blood pressure monitoring of the European Society of Hypertension International Protocol for validation of blood pressure measuring devices in adults. Blood Press Monit. 2002;7:3‐17. [DOI] [PubMed] [Google Scholar]
- 32. Myers MG, Valdivieso M, Kiss A, Tobe SW. Comparison of two automated sphygmomanometers for use in the office setting. Blood Press Monit. 2009;14:45‐47. [DOI] [PubMed] [Google Scholar]
- 33. Ogedegbe G, Pickering T. Principles and techniques of blood pressure measurement. Cardiol Clin. 2010;28:571‐586. [DOI] [PMC free article] [PubMed] [Google Scholar]
- 34. Ostchega Y, Zhang G, Sorlie P, et al. Blood pressure randomized methodology study comparing automatic oscillometric and mercury sphygmomanometer devices: National Health and Nutrition Examination Survey, 2009‐2010. Natl Health Stat Report. 2012;59:1‐15. [PubMed] [Google Scholar]
- 35. Leung AA, Nerenberg K, Daskalopoulou SS, et al. Hypertension Canada's 2016 Canadian hypertension education program guidelines for blood pressure measurement, diagnosis, assessment of risk, prevention, and treatment of hypertension. Can J Cardiol. 2016;32:569‐588. [DOI] [PubMed] [Google Scholar]
- 36. Glasgow RE, McKay HG, Piette JD, Reynolds KD. The RE‐AIM framework for evaluating interventions: what can it tell us about approaches to chronic illness management? Patient Educ Couns. 2001;44:119‐127. [DOI] [PubMed] [Google Scholar]
- 37. Curb JD, Labarthe DR, Cooper SP, Cutter GR, Hawkins CM. Training and certification of blood pressure observers. Hypertension. 1983;5:610‐614. [DOI] [PubMed] [Google Scholar]
- 38. Myers MG, Godwin M, Dawes M, Kiss A, Tobe SW, Kaczorowski J. Conventional versus automated measurement of blood pressure in the office (CAMBO) trial. Fam Pract. 2012;29:376‐382. [DOI] [PubMed] [Google Scholar]
- 39. Chapman JA, Johnson JA. On the spot! Peer validation of BP measurement competence. Nurs Manage. 2013;44:22‐24. [DOI] [PubMed] [Google Scholar]
- 40. Handler J, Zhao Y, Egan BM. Impact of the number of blood pressure measurements on blood pressure classification in US adults: NHANES 1999‐2008. J Clin Hypertens (Greenwich). 2012;14:751‐759. [DOI] [PMC free article] [PubMed] [Google Scholar]
- 41. Clark CE, Horvath IA, Taylor RS, Campbell JL. Doctors record higher blood pressures than nurses: systematic review and meta‐analysis. Br J Gen Pract. 2014;64:e223‐e232. [DOI] [PMC free article] [PubMed] [Google Scholar]
Associated Data
This section collects any data citations, data availability statements, or supplementary materials included in this article.
Supplementary Materials
Data Availability Statement
The datasets generated and/or analyzed in this study are not publicly available because they were clinical data abstracted from the electronic medical record using a HIPAA waiver. The corresponding author can facilitate submission of reasonable applications for summarized or de‐identified data from the clinics that participated in this study.