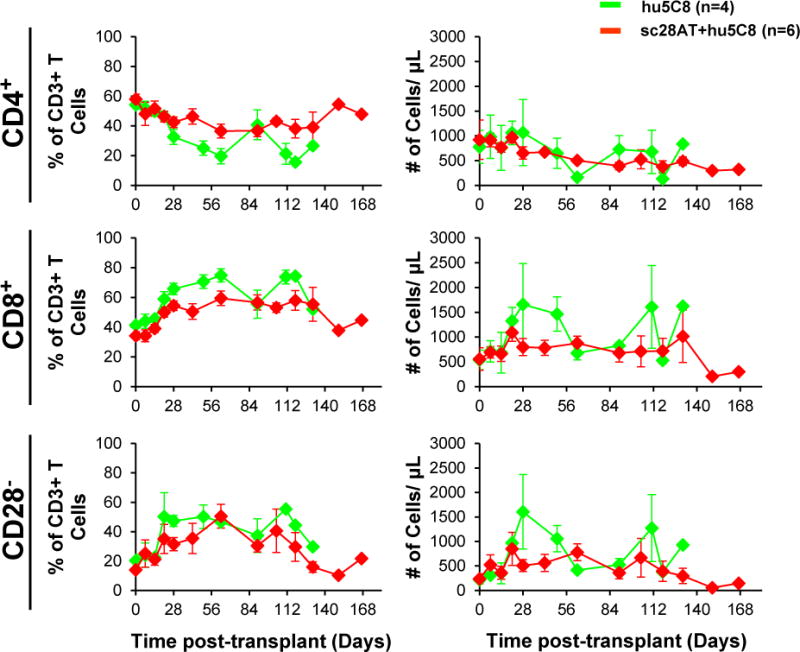
Figure 3. Peripheral blood T lymphocyte phenotype.

The mean (±SEM) of proportions (%) of CD4+ (top), CD8+ (middle), and CD28− (bottom) among CD3+ lymphocytes are shown on the left panels, and absolute numbers in the right panels. Animals treated with sc28AT+hu5C8 (red) maintained lower proportion of CD8+ T cells (p=0.002) and CD28− CD3+ T cells (p=0.046) compared to hu5C8-treated animals (green) during the second month after transplant. Absolute numbers of these 3 T cell populations were similar between the 2 groups.
