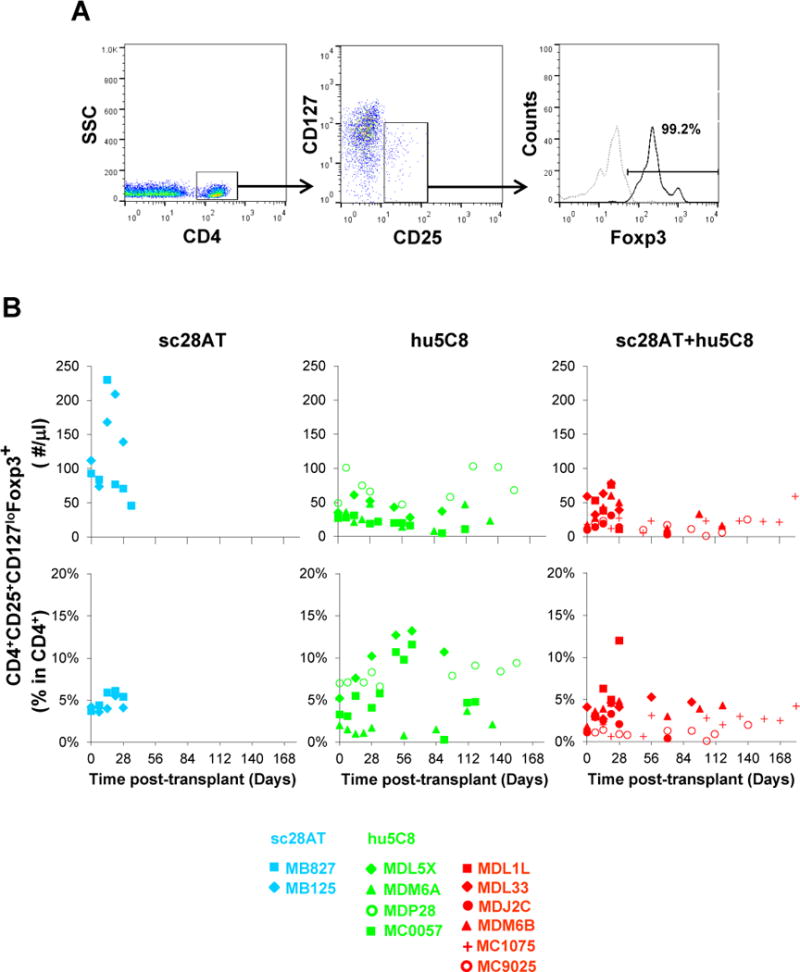
Figure 4. Quantification of circulating CD4+CD25+CD127lo Foxp3+ Tregs by flow cytometry.

(A) Representative flow cytometry analysis of blood putative Tregs in a recipient treated with sc28AT+hu5C8 (MDM6B) at 4 weeks after transplantation when CD4+CD25+CD127loFoxP3+ subset representes 4.8% of total CD4+ cells. Dotted gray line represents the isotype control. (B) Treg absolute numbers (upper panel) and Treg proportion (CD25+CD127loFoxp3+ Tregs as a % among CD4+ cells) (lower panel) generally rose in most animals during the first weeks of treatment, but were similar (not significantly different) between hu5C8 and sc28AT+hu5C8 groups. Color coding (blue, sc28AT; green, hu5C8; red, sc28AT+hu5C8) and recipient-specific symbols are as in Figure 1.
