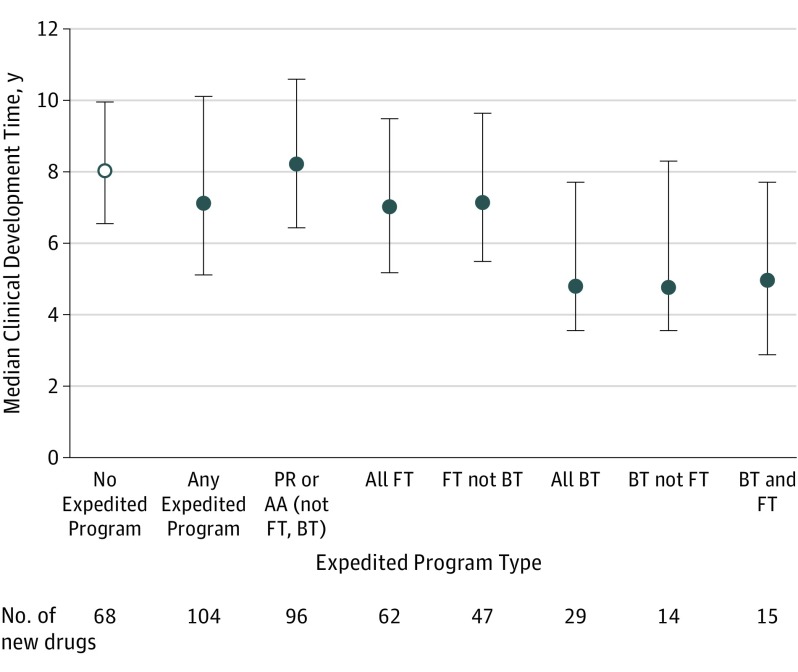
Figure. Median Clinical Development Times for New Drugs Approved by the FDA, 2012-2016.
AA indicates accelerated approval; BT, breakthrough therapy; FDA, US Food and Drug Administration; FT, fast-track; PR, priority review. Clinical development times were calculated from the date of the Investigational New Drug (IND) application to the date of FDA approval. Any expedited program means any of PR, AA, FT, or BT. Development times were not available for 2 drugs in the study cohort. Error bars indicate interquartile ranges.

