Abstract
This population-based study examines the change in the rates of inferior cava filter placement in US inpatients from 2005 to 2014.
Although a mortality benefit from inferior vena cava (IVC) filters has never been demonstrated, their use in the United States increased from 2000 in 1979 to 104 114 in 2005. This study examines trends in inpatient IVC filter placement overall and by indication from 2005 to 2014.
Methods
We used discharge data for adults (aged >18 years) from the Nationwide Inpatient Sample (January 1, 2005, to December 31, 2011) and the National Inpatient Sample (January 1, 2012, to December 31, 2014), Healthcare Cost and Utilization Project, Agency for Healthcare Research and Quality (https://www.hcup-us.ahrq.gov/nisoverview.jsp). Inferior vena cava filter placement was identified by International Classification of Diseases, Ninth Revision, Clinical Modification procedure code 38.7. Contraindications to anticoagulation were as defined by Moore et al. The Washington University Office of Human Research Protection granted this study a waiver from institutional review board oversight.
We plotted weighted rates of total IVC filter placement, filter placement by venous thromboembolism (VTE) diagnosis (deep vein thrombosis [DVT] or pulmonary embolism [PE]), and filter placement by contraindication to anticoagulation. We calculated rates of DVT and PE per 100 000 hospital discharges by year. A map of IVC filter placement rates per 100 000 hospital discharges by US census division in 2014 was created to analyze geographic variation. SAS Enterprise Guide, version 7.1 (SAS Institute Inc) was used for all analyses.
Results
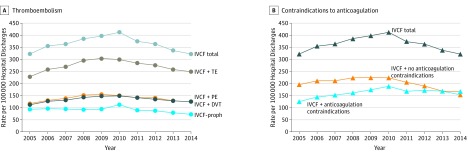
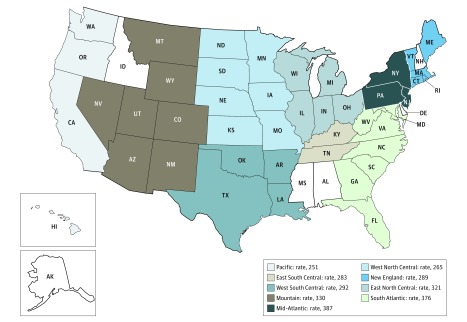
The IVC filter placement rate per 100 000 hospitalizations increased from 322.1 (n = 99 779) in 2005 to 412.0 (n = 129 026) in 2010, decreased to 374.1 (n = 117 731) in 2011, and continued declining to 321.8 (n = 95 735) in 2014 (Figure 1A). The percentage of prophylactic IVC filter placement decreased from 28.9% in 2005 to 22.6% in 2014. Rates of IVC filter placement with a contraindication to anticoagulation per 100 000 hospitalizations decreased from 188.2 (n = 58 946) in 2010 to 167.3 (n = 49 775) in 2014; the rates of filter placement without coding for contraindication to anticoagulation per 100 000 hospitalizations decreased from 223.8 (n = 70 080) in 2010 to 154.5 (n = 45 960) in 2014 (Figure 1B). The rate of DVT per 100 000 hospitalizations increased from 852.1 (n = 263 978) in 2005 to 935.0 (n = 299 757) in 2008 and then decreased to 841.3 (n = 250 300) in 2014. The rate of PE increased from 719.0 (n = 222 732) in 2005 to 1138.6 (n = 338 770) in 2014. The Mid-Atlantic census division had the highest rate of IVC filter placement in 2014; the Pacific division had the lowest rate (Figure 2).
Figure 1. Rates of Inpatient Inferior Vena Cava Filter (IVCF) Placement.
A, Rates with and without thromboembolism (TE) per 100 000 hospital discharges by year. B, Rates with and without contraindications to anticoagulation (eg, intracranial bleeding, other major bleeding, thrombocytopenia, active gastrointestinal tract ulcer, hemophilia, von Willebrand disease, cerebral aneurysm, aortic dissection, pericardial disease, bacterial endocarditis, preeclampsia or eclampsia, malignant hypertension, brain surgery, spinal surgery, or eye surgery) per 100 000 hospital discharges by year. DVT indicates deep vein thrombosis without pulmonary embolism; PE, pulmonary embolism; and proph, prophylactic.
Figure 2. Inpatient Inferior Vena Cava Filter Placement Rates per 100 000 Hospital Discharges .
Data from 2014 US Census Division. New England: Connecticut, Maine, Massachusetts, New Hampshire,a Rhode Island, and Vermont. Mid-Atlantic: New Jersey, New York, and Pennsylvania. South Atlantic: Delaware,a District of Columbia, Florida, Georgia, Maryland, North Carolina, South Carolina, Virginia, and West Virginia. East North Central: Illinois, Indiana, Michigan, Ohio, and Wisconsin. West North Central: Iowa, Kansas, Minnesota, Missouri, Nebraska, North Dakota, and South Dakota. East South Central: Alabama,a Kentucky, Mississippi,a and Tennessee. West South Central: Arkansas, Louisiana, and Oklahoma, and Texas. Mountain: Arizona, Colorado, Idaho,a Montana, Nevada, New Mexico, Utah, and Wyoming. Pacific: Alaska,a California, Hawaii, Oregon, and Washington.
aDid not contribute 2014 data.
Discussion
Prior studies documented an increase in the rates of IVC filter placement from 1979 to 2005. Our analysis shows that this trend continued until 2010 when, in a reversal of a 31-year trend, the rates declined from 2011 through 2014. Overall rates of VTE did not decrease during this time. A recent study suggested the decline is related to a 2010 US Food and Drug Administration warning about filter complications. That study found similar patterns of IVC filter use over time but did not analyze trends by indication.
The geographic variation observed is consistent with the lack of evidence supporting the use of IVC filters. High-quality evidence exists only for IVC filter placement in patients with VTE and no contraindication to anticoagulation. Patients with VTE who were randomized to receive IVC filters experienced a reduction in PE but no change in mortality and an increased risk of recurrent DVT. To our knowledge, no randomized clinical trial data exist for patients undergoing IVC filter placement for VTE and a contraindication to anticoagulation or for prophylactic filter use in patients without VTE. The absence of effectiveness data does not mean that no patients benefit from IVC filter placement. Given this uncertainty, randomized clinical trials in these settings are needed.
References
- 1.Prasad V, Rho J, Cifu A. The inferior vena cava filter: how could a medical device be so well accepted without any evidence of efficacy? JAMA Intern Med. 2013;173(7):493-495. [DOI] [PubMed] [Google Scholar]
- 2.Stein PD, Kayali F, Olson RE. Twenty-one–year trends in the use of inferior vena cava filters. Arch Intern Med. 2004;164(14):1541-1545. [DOI] [PubMed] [Google Scholar]
- 3.Moore PS, Andrews JS, Craven TE, et al. Trends in vena caval interruption. J Vasc Surg. 2010;52(1):118-125.e3. [DOI] [PubMed] [Google Scholar]
- 4.Reddy S, Lakhter V, Zack CJ, Zhao H, Chatterjee S, Bashir R. Association between contemporary trends in inferior vena cava filter placement and the 2010 US Food and Drug Administration advisory. JAMA Intern Med. 2017;177(9):1373-1374. [DOI] [PMC free article] [PubMed] [Google Scholar]
- 5.PREPIC Study Group Eight-year follow-up of patients with permanent vena cava filters in the prevention of pulmonary embolism: the PREPIC (Prevention du Risque d’Embolie Pulmonaire par Interruption Cave) randomized study. Circulation. 2005;112(3):416-422. [DOI] [PubMed] [Google Scholar]


