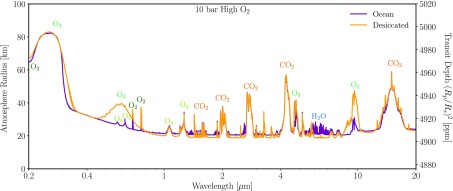
FIG. 17.
Transmission spectra of the 10 bar, 95% O2 atmospheres with a surface water ocean (purple) and with complete desiccation (orange). The effective radius of the atmosphere (in km) is shown on the left y axis to emphasize the vertical extent of the absorption features, while the transit depth is shown on the right y axis to emphasize the strength and detectability of spectral features if Proxima Cen b were observed to transit. The contrasts in O3 absorption stem from the extent to which O3 remains abundant deep in the atmosphere, which is ultimately due to the presence or absence of water vapor.

