Abstract
Iron-type nitrile hydratases (NHases) contain an Fe(III) ion coordinated in a characteristic “claw setting” by an axial cysteine thiolate, two equatorial peptide nitrogens, the sulfur atoms of equatorial cysteine-sulfenic and cysteine-sulfinic acids, and an axial water/hydroxyl moiety. The cysteine-sulfenic acid is susceptible to oxidation, and the enzyme is traditionally prepared using butyric acid as an oxidative protectant. The as-prepared enzyme exhibits a complex electron paramagnetic resonance (EPR) spectrum due to multiple low-spin (S = 1/2) Fe(III) species. Four distinct signals can be assigned to the resting active state, the active state bound to butyric acid, an oxidized Fe(III)–bis(sulfinic acid) form, and an oxidized complex with butyric acid. A combination of comparison with earlier work, development of methods to elicit individual signals, and design and application of a novel density functional theory method for reproducing g tensors to unprecedentedly high precision was used to assign the signals. These species account for the previously reported EPR spectra from Fe-NHases, including spectra observed upon addition of substrates. Completely new EPR signals were observed upon addition of inhibitory boronic acids, and the distinctive g1 features of these signals were replicated in the steady state with the slow substrate acetonitrile. This latter signal constitutes the first EPR signal from a catalytic intermediate of NHase and is assigned to a key intermediate in the proposed catalytic cycle. Earlier, apparently contradictory, electron nuclear double resonance reports are reconsidered in the context of this work.
Graphical Abstract
The high industrial demand for amides, particularly polyacrylamide and nicotinamide, is traditionally met through manufacturing processes that require high acidity, high pressure, and high temperature (200–400 °C), along with metal catalysts such as Raney copper.1 These industrial reactions are economically inefficient and do not yield the pure amide product, because of the formation of unwanted acid side products. Nitrile hydratases (NHases) catalyze the stereo-and regiospecific hydration of nitriles to their corresponding amides under ambient conditions and physiological pH.1 Therefore, NHases have been utilized as industrial biocatalysts to produce, most notably, acrylamide and nicotinamide in single-step reactions, with the elimination of the formation of acid side products.2 NHases have also proven to be useful in the bioremediation of chemical and wastewater runoff, specifically for the hydration of the pesticide bromoxynil.3 Despite the relative success of the use of NHase in manufacturing and bioremediation, several details of their catalytic mechanism remain poorly understood.
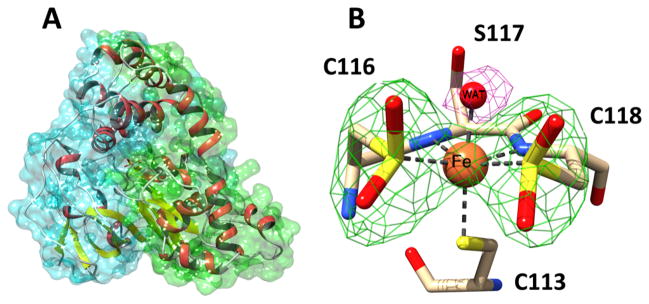
NHases are metalloenzymes that contain either a low-spin (S = 1/2) Fe(III) (Fe-type NHases) or a low-spin (S = 0) Co(III) (Co-type NHases) ion.1 X-ray crystallographic studies of NHases revealed that they are α2β2 heterotetramers with the active-site metal ion coordinated in a characteristic “claw setting” by an axial cysteine thiolate, two equatorial peptide nitrogens, equatorial sulfur atoms that are post-translationally modified to cysteine-sulfenic (CysSOH) and cysteine-sulfinic (CysSO2H) acids, and a labile axial water or hydroxyl moiety (Scheme 1 and Figure 1).4,5 This geometry is conserved among all Fe-type and Co-type NHase enzymes.1,6–8 The protonation states of the axial Cys and the post-translationally modified cysteine-sulfenic and cysteine-sulfenic acids were suggested to be Cys-S−, CysSOH, and a CysSO2− based on sulfur K-edge EXAFS and geometry-optimized density functional theory (DFT) calculations.9 The post-translational oxidation of the two equatorial cysteine thiolate moieties to sulfenic and sulfenic acids is essential for catalytic activity.10–12
Scheme 1.
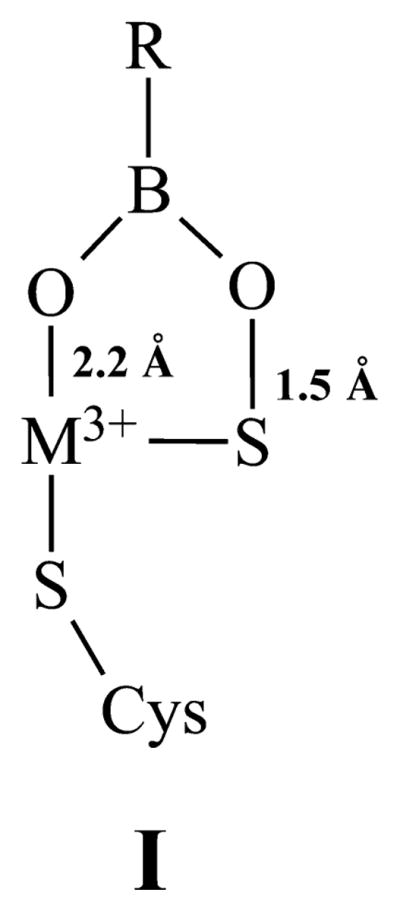
Proposed Structure for the BuBA Species of NHase
Figure 1.
Structure of ReNHase-TG328-2. (A) Overall structure of ReNHase. The two subunits of the αβ heterodimer are shown with superimposed green (α) and cyan (β) surface plots. (B) Iron center of the enzyme. The iron coordination geometry is represented by dashed lines. A difference omit map (Fo – Fc) for the coordinated water is shown at the 4σ level (magenta), and the omit map for the two cysteine-sulfinic acid sulfinate groups is shown at 5σ (green).
Electron paramagnetic resonance (EPR) studies have provided a wealth of mechanistic information about metalloenzymes and have been reported for several Fe-type enzyme species, including the resting states of NHases from Rhodococcus (formerly Brevibacterium) R312 (RhNHase-R312) and Pseudomonas chloraphis 23 (PcNHase-23),13 as well as from NHases following various treatments with substrates or inhibitors,14 and Fe-type NHases after photoactivation of an as-prepared NO-inhibited form.15 A variety of EPR signals have been observed, often consisting of multiple species with overlapping spectra. However, in cases in which signals could be deconvoluted, they all appear to be rhombic with the following g values: g1 ≈ 2.2–2.3, g2 ≈ 2.15, and g3 ≈ 1.97–1.99. In a description of the EPR spectrum of the NHase from Rhodococcus erythropolis N771 (RhNHase-N771), Odaka, Solomon, and co-workers ascribed two of the EPR signals commonly observed in Fe-type NHases to the active resting form (“NHaseAq”) and to a butyric acid complex (“NHase-BA”). These assignments were substantiated by complementary magnetic circular dichroic and DFT information.16 An additional set of less well-defined and pH-dependent signals were assigned to “NHaseOx” forms of the enzyme, in which the equatorial cysteine-sulfenate had been oxidized to sulfinate. A survey of the available EPR data on NHase enzymes reveals that complexation of the enzyme by either carboxylic acids or certain amides appears to provide signals with g1 values at the higher end of the observed range, whereas attempts to elicit signals with substrates or substrate analogues provided signals that were indistinguishable from those of the active enzyme.
In this study, we provide new insight into the active site and catalytic mechanism of the Fe-type NHase from Rhodococcus equi TG328-2 (ReNHase-TG328-2), using EPR, DFT, and X-ray crystallography. The complex EPR signals exhibited by the as-prepared ReNHase-TG328-2 enzyme have been completely assigned, and the nature of the oxidized and butyric acid complexes has been investigated. We have determined conditions for generating single species of ReNHase-TG328-2 and have characterized a hitherto unreported oxidized enzyme complex with butyric acid. This latter species exhibited a well-resolved splitting on the g3 turning point, also evident in other signals upon careful inspection, that is assigned to a nonexchangeable proton. Electron nuclear double resonance (ENDOR) spectroscopy suggests that this splitting is due to a C-β proton from the axial cysteine ligand. EPR data and DFT calculations prompted a thorough reexamination of previous assignments of the Fe3+ axial ligand in the active resting species. Finally, we characterized the EPR spectra of the enzyme in the steady state with a slow substrate and the inhibited complexes of ReNHase-TG328-2 with boronate inhibitors. Comparison with the observed EPR spectrum of ReNHase-TG328-2 in the steady state with acetonitrile suggests that one of the intermediates in hydration of acetonitrile is structurally similar to the boronate complexes and provides support for the direct binding of the substrate to the active-site Fe(III), the formation of a cyclic intermediate, and the role of the sulfenic acid ligand as the catalytic nucleophile.
MATERIALS AND METHODS
Preparation and Assay of ReNHase-TG328-2
ReNHase-TG328-2 was encoded by a previously described plasmid17 and isolated and assayed as previously described in detail.18
X-ray Crystallography is described in detail in the Supporting Information (T1). Data were processed using HKL2000.19 Molecular replacement was performed against CtNHase [Protein Data Bank (PDB) entry 4FM4]20 using Phaser.21 Model building and refinement were performed with Coot,22 CCP4,23 and Phenix.24 Refinement statistics are listed in Table S1.
Electron Paramagnetic Resonance
X-Band EPR spectra were recorded at either 30 K and 0.1 mW on a Bruker EMXplus or an EleXsys E600 spectrometer, equipped with ER4116DM (~9.6 GHz) and ER4123-SHQE (~9.4 GHz) resonators, an Oxford Instruments ESR900 helium flow cryostat, and an Oxford Instruments ITC503 temperature controller, or 77 K and 1 mW on a Bruker EMX-AA spectrometer equipped with an ER4112-SHQ resonator (~9.5 GHz). L-Band EPR was recorded at 1.85 GHz and 120 K on a home-built spectrometer equipped with a 1–2 GHz octave-band bridge and a two-loop, one-gap resonator.25,26 Precise frequencies were recorded in each case (EIP 548A Microwave Frequency Counter). Spectra were characterized in terms of g values, g anisotropy (g1 – g3), and g rhombicity, Rg, where Rg = 1 – (|g1 + g3 – 2g2|)/(g1 – g3), and therefore, Rg = 0 for the axial cases of g1 = g2 and g2 = g3 and Rg = 1 for the most rhombic case in which g1 – g2 = g2 – g3. Fractional spin intensities were estimated by least-squares fitting of simulated spectra (EasySpin27) to experimental data and absolute spin concentrations estimated by comparison to a standard sample containing 0.5 mM Cu(II), 20 mM imidazole, and 25 mM HEPES (pH 7.5). Pulsed Davies ENDOR spectra were recorded at 10 K on a Bruker EleXsys E580 spectrometer equipped with an E560-P stochastic pulsed ENDOR accessory, an ENI A300 RF amplifier, and an EN4118X-MD-4W resonator.
Computational Methods
DFT calculations were performed using ORCA version 3.0 developed by Neese.28 The Fe-type NHase calculations employed a truncated version of the active site derived from crystallographic data (PDB entry 2AHJ)29 and previous computational studies by Hopmann.30 The computational models included the two conserved protonated arginine residues (Arg56 and Arg141) that form hydrogen bonds to the CysSO− and CysSO2− donors. The positions of carbon atoms attached to the protein backbone were fixed during geometry optimizations. The models possess an overall charge of zero and an S = 1/2 spin state. All calculations utilized the PBE0 functional (i.e., the one-parameter hybrid version31 of the Perdew–Burke–Erzerhoff functional32), which has proven to be accurate in prior studies of iron-containing complexes.33 Ahlrichs’ valence triple-ζ (TZV) and TZV/J auxiliary basis sets were used in each case, with additional polarization functions on heavy atoms.34–36 The computed Fe–ligand bond lengths for each model are summarized in Table S3, and atomic coordinates are provided (Tables S4–S8). TD-DFT calculations37–39 provided absorption energies and intensities for 40 excited states within the Tamm–Dancoff approximation.40,41
Two different methods were employed to calculate g values for the active-site models. The first approach involved solving the coupled–perturbed self-consistent field (CP-SCF) equations, as implemented in ORCA,42,43 to assess the contribution of spin–orbit coupling (SOC) to the g tensor. The second approach relied upon a series of equations, originally developed by Taylor,44 that relate g values to ligand field parameters for low-spin Fe(III) systems. According to Taylor, the three g values are related to the coefficients (a, b, and c) of the dyz, dxz, and dxy orbitals, respectively, in the singly occupied orbital, as indicated in eqs 1–3:
| (1) |
| (2) |
| (3) |
This mixing of the “t2g” orbitals is due to spin–orbit coupling. Therefore, the g values can be used to calculate the tetragonal splitting (Δ) between the dxy orbital and the dxz/dyz pair and the rhombic splitting (V) between the dxz and dyz orbitals, according to eqs 4 and 5.
| (4) |
| (5) |
where λFe is the SOC parameter. In this study, the Δ and V values of each Fe-type NHase model were estimated from d–d transition energies generated by the corresponding TD-DFT calculations. The three g values in eqs 4 and 5 were then varied until the resulting Δ and V energies matched those predicted by TD-DFT. The computed g values were required to correspond to a normalized orbital, such that a2 + b2 + c2 = 1. By applying this approach to a series of test complexes, we determined that a λFe value of 460 cm−1 provides the best agreement between experimental and computed g values. It is important to note that the three g values in eqs 1–5 can be either positive or negative. The correct signs of the g values correspond to the molecular axis system in which the value of | V/Δ| is <2/3.44 For the Fe-type NHase systems discussed here, this criterion is met when gx is negative, gy is positive, and gz is negative; however, only the absolute g values are reported.
RESULTS
X-ray Crystallography
The active-site Fe(III) ion in ReNHase-TG328-2 is identical to that in other Fe-type NHases. Bond distances for Fe(III) ligands are similar to those previously reported for Fe-type NHases and are summarized in Table S2.
EPR Spectroscopy
ReNHase-TG328-2 Prepared Aerobically in the Presence of Butyric Acid
Fe-type NHase enzymes are typically prepared aerobically, necessitating the use of the competitive inhibitor butyric acid to prevent loss of activity. Butyric acid impedes oxidation of the active-site cysteine-sulfenic acid to cysteine-sulfinic acid. Procedures subsequently employed with the intention of removing butyric acid include column chromatography, dialysis, or, as here, three or more cycles of buffer exchange by ultrafiltration.
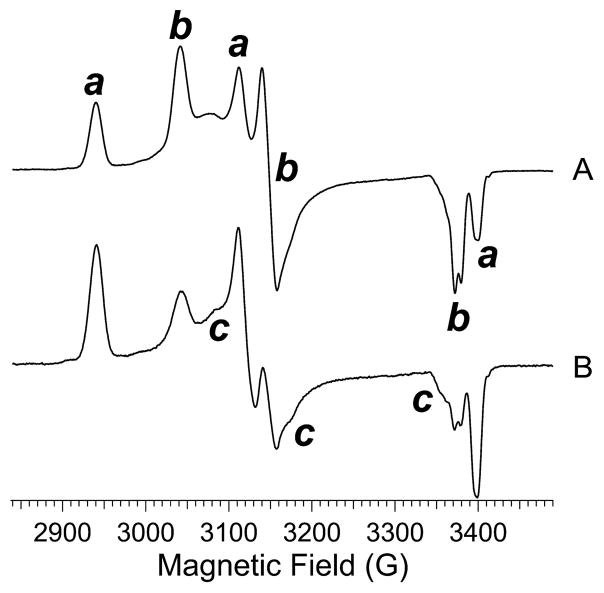
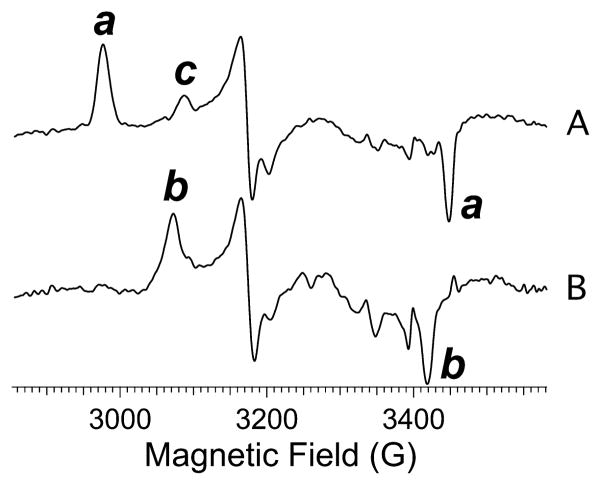
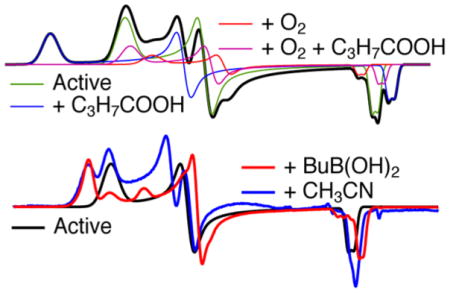
The enzyme thus prepared exhibited a complex EPR spectrum that differed from preparation to preparation in the relative intensity of each of the turning points at the reproducible resonant fields characteristic for ReNHase-TG328-2 (Figure 2). Three distinct rhombic species were identified by inspection and simulation and are termed Na, Nb, and Nc [this notation is distinct from that (NHA, NHC, etc.) employed elsewhere]. Na was the most anisotropic species observed and is characterized by g1, g2, and g3 values of 2.281, 2.150, and 1.974, respectively. A second well-defined species, Nb, exhibited g1, g2, and g3 values of 2.206, 2.131, and 1.987, respectively. The g tensor for Nb (g1 – g3 = 0.219) was less anisotropic than that of Na (g1 – g3 = 0.307) and exhibited higher axial symmetry (equivalent to lower rhombicity; Rg values for Na and Nb were 0.85 and 0.69, respectively). Conversion of the Na complement of the spectrum to the Nb form was observed upon the addition of the substrate methacrylonitrile, but the conversion was not dependent on an active substrate and was also elicited by the addition of the innocent agent imidazole. Addition of 100 mM imidazole to a sample of the butyric acid-complexed ReNHase-TG328-2 elicited a change from a spectrum due essentially to Na to one due almost completely to Nb (Figure 3). A third triad of turning points, evident as small peaks or shoulders labeled c in Figure 2, are less definitive but consistent with a third rhombic S = 1/2 species, Nc, with g1, g2, and g3 values of 2.180, 2.114, and 1.998, respectively, a g1 – g3 value of 0.182, and RB of 0.73. Nc was elicited deliberately at the expense of Nb by exposure of the enzyme to air (Figure 4C). The pH dependence of the EPR spectrum of ReNHase-TG328-2 differed from that reported for RhNHase-N77116 and is described in detail in the text (T2) supporting Figure S1. Briefly, the pH dependence of the observed spectrum was appreciably weaker for ReNHase-TG328-2. Two distinct species were deconvoluted by difference, one at a higher pH corresponding to the Nb signal and one at a lower pH that was most similar, though not identical, to the Nc form.
Figure 2.
Representative EPR spectra of two preparations of ReNHase-TG328-2, in 50 mM HEPES buffer (pH 7.5) and residual butyric acid from the purification procedure, recorded at 9.4 GHz, 30 K, and a microwave power of 0.1 mW. Labels a–c denote turning points due to distinct species Na–Nc, respectively, which differ in proportion in spectra A and B.
Figure 3.
(A) EPR spectrum of ReNHase-TG328-2 in 50 mM HEPES buffer (pH 7.5) containing 5 mM butyric acid. (B) EPR spectrum of ReNHase-TG328-2 in 50 mM HEPES buffer (pH 7.5) containing 5 mM butyric acid and 100 mM imidazole. Spectra were recorded at 9.5 GHz, 77 K, and a microwave power of 1 mW. Labels a–c denote turning points due to distinct species Na–Nc, respectively.
Figure 4.
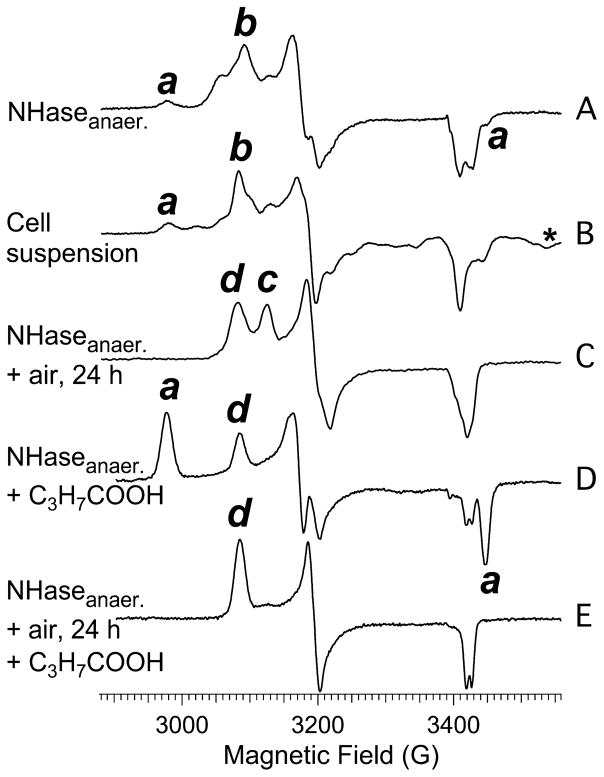
EPR spectra from (A) NHase following anaerobic anion-exchange chromatography using an elution buffer free of butyric acid, (B) a suspension of the cells from which NHase was isolated, which was not exposed to butyric acid, (C) an aliquot of sample A following exposure to air for 24 h at 25 °C, (D) an aliquot of sample A to which 20 mM butyric acid was added, and (E) an aliquot of sample B to which 20 mM butyric acid was added. Labels a–d denote turning points due to distinct species Na–Nd, respectively. The asterisk denotes the resolved |mS, mI〉 = |±1/2, –3/2〉 line of a signal due to S = 5/2, I = 5/2 55Mn(II), assigned on the basis of the corresponding |±1/2, –5/2〉 line 90 G upfield (not shown). Spectra were recorded at 9.5 GHz, 77 K, and a microwave power of 1 mW.
Anaerobic Preparation, Air Oxidation, and Butyric Acid Exposure of ReNHase-TG328-2
In an attempt to understand the chemical origins of the EPR-detected species and to develop protocols for isolating ReNHase-TG328-2 in each of its putative homogeneous states, ReNHase-TG328-2 was prepared by performing the chromatography steps in an anaerobic glovebox, and butyric acid was removed by a final anion-exchange step with an eluting buffer devoid of butyric acid. The resulting spectrum (trace A, Figure 4) was substantially due to the Nb form but contained traces of Na, Nc, and a novel signal termed Nd, characterized by turning points labeled d in Figure 4 with g1, g2, and g3 values of 2.201, 2.125, and 1.982, respectively. The appearance of Na appears to be unrelated to the enzyme preparative procedure, as the EPR spectrum of a suspension of the cell culture from which ReNHase-TG328-2 was isolated, which had never been exposed to butyric acid, also exhibited the Na signal at approximately the same, albeit low, relative intensity (Figure 4B).
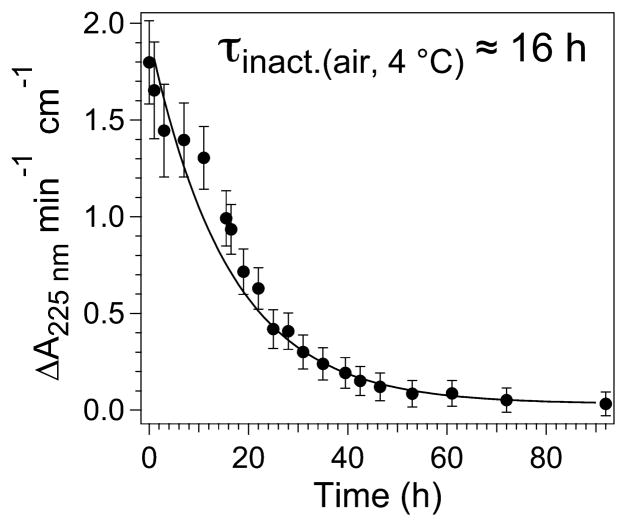
Upon incubation of an aliquot of the isolated NHase corresponding to Figure 4A in air for 24 h at ambient temperature (≈25 °C), the Nb component was extinguished and replaced by roughly equal amounts of Nc and the newly discovered Nd (Figure 4C). The sample exhibited no measurable catalytic activity, and a longitudinal study of ReNHase-TG328-2 purified in an anaerobic glovebox showed that NHase activity decayed exponentially in air at 4 °C with a τ of ≈16 h (Figure 5). The addition of 20 mM butyric acid to each of the samples that exhibited the spectra shown in traces A and C of Figure 4 elicited the spectra shown as traces D and E, respectively.
Figure 5.
Time course of inactivation of NHase in air. A covered 90 μM sample of NHase was incubated in air at 4 °C for up to 90 h, and aliquots (0.9 μM) were assayed for activity against acrylonitrile (80 mM) at 25 °C.
In Figure 4D, the predominant signal (~70%) is Na. In Figure 4E, however, almost the entire signal is due to Nd and the ~50% permanently inactive Nc component completely converted to equally inactive Nd (Figure 4C).
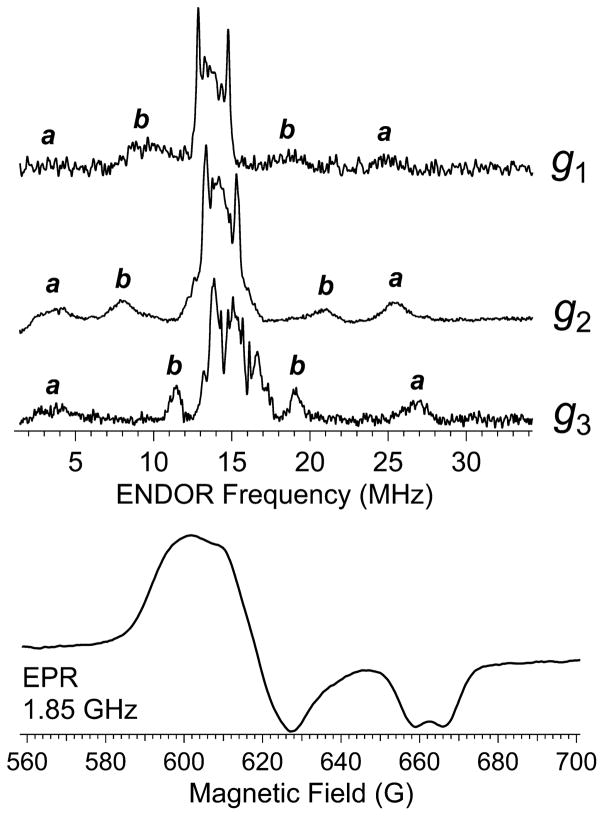
Close inspection of the g3 features of signals from ReNHase-TG328-2, most clearly observed in the ~100% Nd signal (Figure 4D), revealed a splitting of that feature of ~8 G. The splitting was confirmed to be due to interaction with a single I = 1/2 nucleus by EPR at 1.85 GHz, and ENDOR spectroscopy of NHase in 2H2O indicated that the coupling, responsible for the ENDOR resonances labeled a in Figure 6, is (i) due to one or more identical and nonexchangeable proton(s), (ii) essentially isotropic, and (iii) substantially larger than any previously observed 1H couplings in NHase.5,47 A second set of nonexchangeable ENDOR resonances, labeled b, with A values of 10, 12, and 7 MHz at g1, g2, and g3, respectively, were also observed.
Figure 6.
Pulsed Davies ENDOR spectra (top) recorded on the sample of Figure 4, Trace D, at 9.8 GHz and 10 K. Spectra shown were recorded at the g1, g2, and g3 resonant fields, and ±A/2 nonexchangeable 1H resonance pairs are labeled a–c, respectively. EPR spectrum (bottom) of the sample of Figure 4D, recorded with a nonsaturating microwave B1 field, at 1.85 GHz and 120 K.
ReNHase-TG328-2 upon Incubation with Alkylboronate Inhibitors
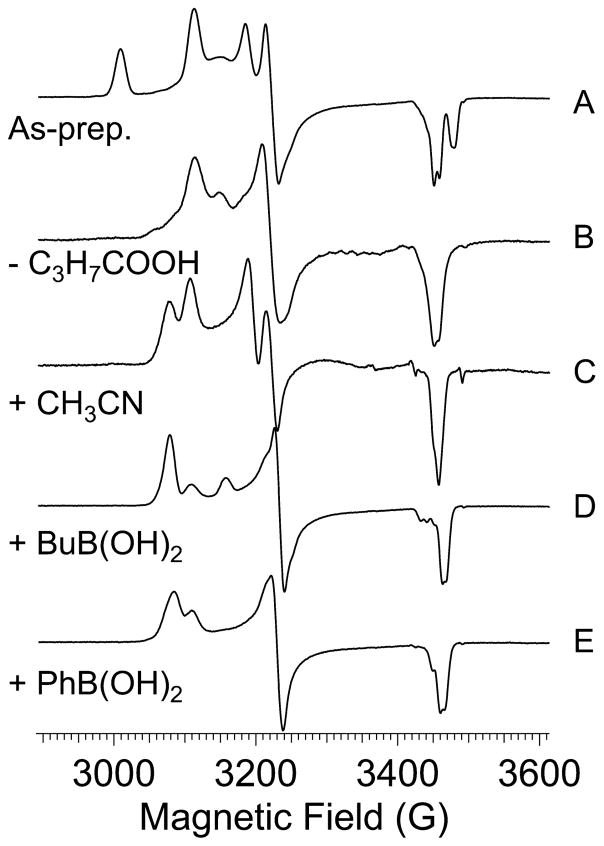
Information about the binding of BuBA and PBA on the Fe-type ReNHase-TG328-2 enzyme was sought via EPR, and representative spectra are shown in Figure 7. For reference, the as-prepared spectrum containing the Na signal from the butyric acid complex, the active Nb species, and some oxidized Nc is reproduced from Figure 2 as Figure 7A (note that the magnetic field scale has been adjusted to account for different microwave frequencies, as mentioned in the figure legend). The EPR spectrum of ReNHase-TG328-2 following turnover with methacrylonitrile followed by buffer exchange exhibited the active Nb signal but no signal due to the Na species (Figure 7B). Upon subsequent incubation of the sample shown in Figure 7B with either BuBA (Figure 7D) or PBA (Figure 7E), the EPR spectra become markedly more rhombic, with the dominant species exhibiting g1, g2, and g3 values of 2.235, 2.128, and 1.985, respectively. A residual component, with g1 indistinguishable from that of the active unreacted Nb species, was additionally observed in both spectra. A third, otherwise uncharacterized, resonance at g = 2.180 was observed in the EPR spectrum of the sample containing BuBA, but not in the spectrum of the sample containing PBA. The dominant species is significantly more rhombic than that observed when, e.g., imidazole was added with conversion of Na to Nb. Perhaps it is mechanistically significant that the g1 value of the dominant species observed in the boronic acid complexes was reproduced in the spectrum obtained upon incubation of active NHase with the very slow substrate acetonitrile (Figure 7C).
Figure 7.
EPR spectra of (A) as-prepared NHase, (B) NHase with butyric acid removed, (C) sample B stirred with 50 mM acetonitrile for 10 s and frozen in isopentane at –100 °C, (D) NHase incubated with 10 mM 1-butaneboronic acid at 25 °C for 10 min, and (E) NHase incubated with 10 mM phenylboronic acid at 25 °C for 10 min.
Density Functional Theory Calculations
The relationship between the active-site structure and observed EPR features was further examined with computational methods. Five truncated models of the Fe-type NHase active site were generated, corresponding to the putative intermediates observed by EPR: NHaseAq (a model corresponding to Nb), NHaseBA (Na), NHaseBuBA, NHaseOxAq (Nc), and NHaseOxBA (Nd), where the “Ox” models contain two Cys-SO2− ligands. The “BA” and “Aq” structures feature metal-bound acetic acid (instead of butyrate) and H2O, respectively, trans to the thiolate donor, and the “BuBA” structure [I (Scheme 1)] was based on the structure (PDB entry 4OB2) obtained from X-ray diffraction of crystals of Co-type PtNHase treated with BuBA.45 The g values were initially calculated using the coupled–perturbed self-consistent field (CP-SCF) equations for spin–orbit coupling (SOC),42,43 as implemented in the ORCA computational package. However, as shown in Table 1, the resulting g values do not adequately reproduce the experimental values, a finding consistent with prior attempts to apply this methodology to low-spin Fe(III) systems.16,46 In particular, DFT consistently underestimates the g1 values and provides g3 values of >2.0, whereas the experimental g3 value is always <2.0. We therefore developed an alternate approach that utilizes equations originally derived by Taylor for low-spin ferric heme complexes.44 For such “t2g5” systems, the g anisotropy principally arises from in-state SOC. Therefore, the three g values are related to the SOC constant, λFe, and the energy splittings, Δ and V, between the t2g orbitals (see Materials and Methods for more details). Generally, Taylor’s equations are used to calculate Δ and V from the experimental g values. We surmised, however, that they could also be employed in the reverse fashion, to predict g values based on ligand field transition energies (i.e., Δ and V splittings) computed using time-dependent DFT (TD-DFT), and this approach was developed here.
Table 1.
Comparison of Experimental and Computed g Values for Fe(III)–NHase Species
| EPR signal (NHase species) | methoda | g1 | g2 | g3 | g1 – g3 | rmsdb |
|---|---|---|---|---|---|---|
| Nb (NHaseAq) | EPR exp. | 2.206 | 2.131 | 1.987 | 0.219 | |
| CP-SCF | 2.169 | 2.103 | 2.007 | 0.162 | 0.029 | |
| Taylor/ DFT | 2.215 | 2.117 | 1.979 | 0.236 | 0.011 | |
| Na (NHaseBA) | EPR exp. | 2.281 | 2.150 | 1.974 | 0.307 | |
| CP-SCF | 2.193 | 2.120 | 2.007 | 0.186 | 0.057 | |
| Taylor/ DFT | 2.248 | 2.121 | 1.970 | 0.278 | 0.025 | |
| Nc (NHaseOxAq) | EPR exp. | 2.180 | 2.114 | 1.998 | 0.182 | |
| CP-SCF | 2.175 | 2.097 | 2.014 | 0.161 | 0.014 | |
| Taylor/ DFT | 2.219 | 2.111 | 1.976 | 0.243 | 0.026 | |
| Nd (NHaseOxBA) | EPR exp. | 2.201 | 2.125 | 1.982 | 0.219 | |
| CP-SCF | 2.193 | 2.109 | 2.035 | 0.158 | 0.032 | |
| Taylor/ DFT | 2.230 | 2.121 | 1.974 | 0.256 | 0.018 | |
| NHaseBuBA | EPR exp. | 2.235 | 2.128 | 1.985 | 0.250 | |
| CP-SCF | 2.150 | 2.096 | 1.999 | 0.151 | 0.053 | |
| Taylor/ DFT | 2.202 | 2.106 | 1.980 | 0.222 | 0.023 |
EPR exp. indicates experimental values from EPR; see the main text for details regarding the CP-SCF and Taylor/DFT methods.
Root-mean-square deviation between computed and experimental g values.
To evaluate its feasibility, this procedure was first applied to a series of Fe-type NHase model complexes generated by Kovacs, for which X-ray structures and EPR spectra were available.51 As shown in Table S9, the g values provided by the combined Taylor/TD-DFT approach (subsequently termed the “Taylor/ DFT method”) exhibit much better agreement with the experimental data than the values from the corresponding ORCA calculations do. The Taylor/DFT method yields g3 values of <2.0 and replicates the changes in the g tensor that occur upon protonation and/or oxidation of the thiolate ligand. Significantly, these preliminary studies were used to optimize the λFe value, which cannot be calculated directly, and a value of 460 cm−1 provided the best agreement between computed and experimental g values. This λFe value is very close to the free ion value. Although metal–ligand covalency is expected to lower λFe to around 400 cm−1 for a low-spin ferric species, in our case, the higher λFe value compensates for the fact that TD-DFT calculations systematically overestimate the energies of d–d transitions by 20–30%.
Application of the Taylor/DFT method to the four active-site models of Fe-type NHase yielded g values that are consistent with the experimental data, which is evident in the overall root-mean-square deviation (rmsd) of only 0.021 (Table 1). Significantly, the Taylor/DFT calculations well reproduce the anisotropy (g1 – g3) of the experimental g tensors, providing computed g1 values of >2.20 and g3 values of <2.00. This represents a significant improvement over values obtained via CP-SCF calculations, which exhibit a larger rmsd of 0.040. However, it is important to note that both methods correctly predict the increase in g3 upon substitution of H2O with BA (for the native and oxidized enzymes) as well as the decrease in g3 upon conversion of NHaseBA to NHaseOxBA.
DISCUSSION
Origins of Multiple Chemical Species in As-Prepared ReNHase-TG328-2
On the basis of (i) comparison with previously reported EPR signals from related NHases, (ii) the nature of treatments used to elicit individual signals and associated activity measurements, and (iii) Taylor/DFT calculations using structural models, the four signals from NHases prepared under standard conditions were assigned to distinct chemical species. The g values for the Na signal are characteristic of butyric (or, more generally, carboxylic) acid complexes of Fe-type NHases13,15,45 and indicate incomplete removal of bound carboxylic acid from the enzyme active site following its use as an antioxidation protectant. The signal was modeled well by Taylor/DFT, which reproduced the unusually anisotropic g tensor with unprecedented precision, using a model that included monodentate binding of carboxylic (acetic) acid to the Fe(III) ion in place of the water/hydroxyl that was crystallographically identified in the active enzyme. This model was suggested by the X-ray diffraction structure of a Co-type NHase complexed by butyric acid in which the ligand is bound through a carboxylic oxygen atom to the Co(III) ion. Further pieces of evidence for the assignment of Na are (i) the observation that NHase solutions containing butyric acid that exhibit the Na signal are inactive, (ii) the observation that the Na signal is converted to Nb by scrupulous and anaerobic removal of butyric acid, and (iii) the observation that in NHase that exhibits Na after removal of exogenous, but not bound, butyric acid, the enzyme is active and exhibits the Nb signal following turnover. This latter observation strongly suggests displacement of the competitive inhibitor butyric acid by substrate, leaving the active enzyme following turnover.
Therefore, the assignment of Na to a carboxylic acid complex of NHase is supported by widespread EPR data, including (i) its elucidation by addition of butyric acid, (ii) its elimination by displacement, and (iii) its diminution or nonappearance in preparations that either avoided or scrupulously removed butyric acid. The fact that the butyric acid form has no catalytic activity has been demonstrated, and the contention that the butyric acid complex includes replacement of the apical water/ hydroxyl, and monodentate binding to the metal ion, is supported by (i) X-ray crystallographic data and (ii) the observation that the Na form can be converted to the active Nb form by cryogenic photolysis and subsequently re-formed by annealing. Additional support comes from the albeit circumstantial DFT evidence, particularly reproduction of the very high g1 value. The one reported phenomenon that appears to be at odds with the assignment of Na is the earlier assignment of ENDOR-identified exchangeable protons in this species to the water/hydroxyl that occupies the sixth coordination site in the active form of the enzyme.5,47 A coordinated water/ hydroxyl would not be expected in Na. Given the large amount of evidence from multiple investigators in favor of the assignment of Na to a carboxylic (butyric) acid complex and clear evidence from crystallography that a carboxylic oxygen binds the active metal ion in place of the water/hydroxyl, the simplest explanation for the ENDOR data is that the hitherto observed resonances are not, in fact, due to a coordinated water/hydroxyl but to nearby exchangeable protons. However, other possibilities exist,48–50 and these are explored at length in section T3 of the Supporting Information. One final point of interest is the observation that the Na signal can be observed in the EPR spectrum of cells expressing NHase that had never been exposed to butyric acid (Figure 4B). This signal is initially very weak, but its intensity increases, proportionally, with time, indicating binding of endogenous carboxylic acids by NHase, at least in the Escherichia coli overexpression system.
The species that exhibits the Nb signal is assigned to the active form of the enzyme. This form of the enzyme exhibits maximal catalytic activity, is reversibly inhibited by butyric acid, and is irreversibly deactivated by exposure to oxygen. A species with g values very similar to those of Nb was assigned to the active “NHaseAq” species of RhNHase-N77116 and was also observed in PcNHase-23.13 Taylor/DFT calculations based on the active enzyme model again reproduced the g tensor to unprecedented precision and were clearly very distinct from those of other structural models (Table 1). Conversion of Na to Nb was demonstrated here by displacement of butyric acid with either substrate or the innocent ligand imidazole, and the enzyme could be isolated substantially as the active Nb form by scrupulous avoidance of butyric acid. Similar behavior was observed with the related RhNHase-R312 enzyme; an Na-type signal with g1, g2, and g3 values of 2.207, 2.124, and 1.984, respectively, a g1 – g3 values of 0.223, and an RB value of 0.74 was elicited upon addition of the substrate 2-methylpropaneni-trile (isobutyronitrile) to a preparation that hitherto expressed only the Na species associated with carboxylic acid; as is customary, the enzyme was prepared using butyric acid as a stabilizer.13 For both the N771 and R312 enzymes, product release is the rate-limiting step in the reaction with substrates thus far investigated, and occupation of the proteinaceous binding site by the amide product likely prevents rebinding of residual butyric acid, as seen with imidazole.18 An Nb-like signal from RhNHase-R312 was also observed upon cryogenic (20 K) illumination of the Na form, but the signal reverted to Na upon storage for 3 days at 77 K.14 This phenomenon suggests rebinding of butyric acid to Fe(III) following photolytic cleavage, presumably of an Fe–O bond, and provides further, if circumstantial, evidence of the assignments of Na and Nb.
The species of NHase that exhibits the Nc signal is (i) present in aerobically isolated NHase preparations but not in anaerobically prepared enzyme, (ii) irreversibly inactive, and (iii) elicited by exposure to oxygen (air) in the absence of butyric acid. Its appearance is inhibited by the presence of butyric acid, and preparations of numerous NHase variants prepared with butyric acid exhibit only the Na signal and neither the active Nb signal nor the oxidized Nc signal. NHase that has been crystallized under aerobic conditions typically exhibits oxidation of the cysteine-sulfenic acid to cysteine-sulfinic acid.45 Nc has an unusually low value for g1, <2.2, and the only other described examples of Fe-type NHase signals with g1 values of <2.2 are those assigned to a species (“NHaseOx”) of RhNHase-N771, in which the cysteine-sulfenic acid was presumed to be oxidized to cysteine-sulfinic acid.16 The traditional CP-SCF, uniquely for NHase species, provided a better overall fit for Nc than the Taylor/DFT method did. The Taylor/DFT parameters for Nc were not markedly dissimilar from those for active Nb, suggesting that the electronic structure of the Fe(III) ion is not significantly perturbed by the replacement of cysteine-sulfenic by cysteine-sulfinic acid per se but that this replacement may result in other subtle changes in the active-site structure that are not reflected in the refinement of the model used for DFT or, given the otherwise superimposition of active and oxidized active-site X-ray structures, are within crystallographic resolution but nevertheless do impact the experimental g values. Regardless, the chemical, crystallographic, and activity data for the assignment of this species are compelling.
The final signal observed in as-prepared NHase, Nd, was only completely characterized as a result of its deliberate generation by treatment of the fully oxidized (Nc) species with butyric acid. This unexpected reaction resulted in the transition from the spectra of Figure 4C–E. The g values of Nd were themselves unremarkable but were reproduced well by the Taylor/DFT method, assuming a structure analogous to that of Na but with the replacement of cysteine-sulfenic by cysteine-sulfinic acid. As for Nc, the effect of the oxidation on the calculated g values was not as great as on the experimental ones, but the direction of the shift of g1 from the very large value for Na to a more modest value for Nd was consistent with the experimental observation.
ENDOR data provided information about the origin of the EPR-detected hyperfine coupling. Low-frequency EPR confirmed that the splitting was due to a single I = 1/2 nucleus. An ENDOR coupling consistent with that was observed at g3 and decreased slightly as the field was lowered but was essentially isotropic, indicating that a through-bond interaction between the proton and the Fe(III) ion was the dominant coupling mechanism. Taken together, these data suggest that the nonexchangeable proton responsible for the observed super-hyperfine splitting of the g3 EPR line is a C-β proton from the axial cysteine ligand. The anisotropy of the coupling to an additional nonexchangeable proton, b, with A values of 10, 12, and 7 MHz at g1, g2, and g3, respectively, explains the lack of superhyperfine resolution at g1 and g2 in the EPR spectrum and is likely due to the other cysteine C-β proton. The Davies ENDOR approach employed here revealed couplings to these nonexchangeable protons that are significantly larger that any 1H couplings reported in the previous ENDOR studies of NHase.5,47 (These are discussed in detail in paragraph T3 of the Supporting Information.)
In summary, EPR spectra of ReNHase-TG328-2 were found to exhibit four signals in the as-prepared state: the active species (Nb); an oxidized and permanently inactive Fe(III)–bis-(sulfinic acid) form (Nc); a reversibly inactivated carboxylic acid-complexed form (Na), arising from the use of butyric acid as a stabilizer during isolation and/or intracellular interaction of Fe-type NHase with endogenous carboxylic acids; and a permanently inactive form (Nd) due to complexation of Nc with butyric acid. Careful analysis of the reported changes in EPR spectra of as-prepared Fe-type NHase enzymes upon the addition of substrates indicates that they do not involve any new species, such as putative catalytic intermediates, but are simply due to displacement of a carboxylic acid in the substrate binding pocket of the Na form by the reaction product. The signal that replaces the Na signal in the reaction steady state is indistinguishable from the Nb (resting active) form and is therefore due to the regenerated active site.
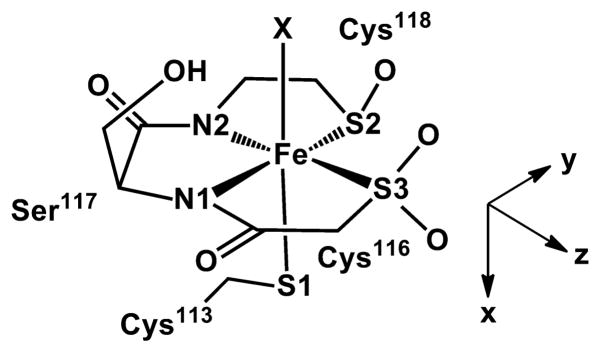
DFT calculations provided a deeper understanding of how changes in active-site structure cause shifts in g values. The paramagnetic electron of the active-site S = 1/2 Fe(III) ion in Fe-type NHase enzymes is located in an Fe 3dxy-based molecular orbital (MO), where the coordinate system is determined by the orientation of the g tensor (Scheme 2). This singly occupied MO (SOMO) is the highest-energy t2g orbital due to strong π-antibonding interactions with both the thiolate (S1 in Scheme 1) and amidate (N1) donors. In contrast, the Fe 3dxz orbital experiences only one destabilizing π-interaction (with the N2 amidate), while the lowest-energy Fe 3dyz orbital is not involved in π-bonding. Thus, the rhombic nature of the g tensor of the low-spin Fe(III) ion in Fe-type NHase enzymes arises from the facial orientation of the thiolate and amidate donors. On the basis of our calculations, the increase in g anisotropy upon displacement of H2O by a carboxylic acid (e.g., acetic acid in the BA structural model) is largely due to an increase in the Fe1–N1 bond length of ~0.04 Å, which lowers the energy gap between the 3dxy-based SOMO and the dxz/dyz pair. The coordinated acid forms a strong H-bond with the CysSO− donor, and this orientation causes a steric clash between the alkyl group of the carboxylic acid and the Ser113 side chain, thereby pushing the N1 donor away from the Fe center (Table S3). A similar structural change occurs when carboxylic acid binds to the oxidized bis(sulfinic) active site. These calculations also suggest that the decrease in g anisotropy observed experimentally upon oxidation of the sulfenate ligand is due to the attendant shortening of the axial Fe–S1 bond (Table S3), which destabilizes the SOMO relative to the dxz/dyz pair.
Scheme 2.
Base Active-Site Model for DFT Calculations
EPR of ReNHase-TG328-2 upon Incubation with Alkylboronate Inhibitors
Significant changes in the EPR spectrum were also observed upon the addition of boronic acid inhibitors to ReNHase-TG328-2. In these cases, however, new species that were clearly distinct from the Na–Nd quartet of signals that describe Fe(III) NHase spectra observed to date were identified. The boronic acid signals each exhibited a g1 value intermediate between those of the Na and Nb signals, and this feature was replicated by rapidly freezing a solution of ReNHase-TG328-2 with the slow substrate acetonitrile.
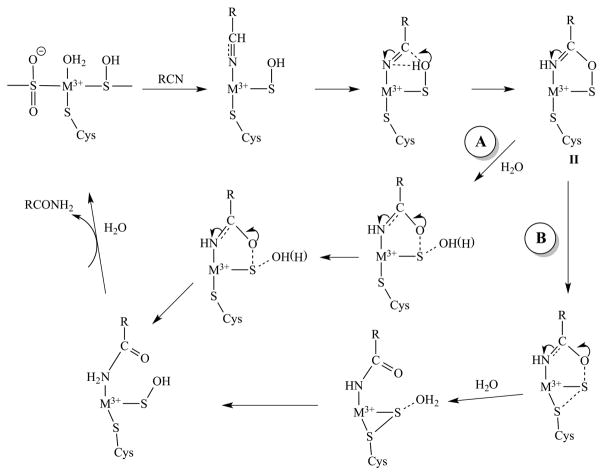
Insight into the catalytic mechanism of NHase enzymes has been obtained from the X-ray crystallographic study of the inhibited complexes of the Co-type NHase from Pseudonocardia thermophila (PtNHase) with 1-butaneboronic acid (BuBA) and phenylboronic acid (PBA).45 Two structural models were obtained from X-ray diffraction data of PtNHase crystals soaked with BuBA and cocrystallized with BuBA. In the first (PDB entry 4OB2), the sulfenic acid oxygen atom was found covalently bound to the boron, indicating nucleophilic attack of the sulfenate oxygen atom on the empty pz orbital of boron. An analogous model was obtained with PBA (PDB entry 4OB0), and these were interpreted as mimicking an intermediate in nucleophilic attack on the substrate. [Scheme 1 shows a cartoon of this BuBA species (I), and the corresponding proposed catalytic intermediate (II) is shown in Scheme 3.] A boronic acid oxygen atom was bound to the Co(III) ion, replacing water/hydroxyl, and the sulfenic acid sulfur atom remained bound to Co(III). The second model (PDB entry 4OB1) showed a weaker S–O interaction, suggestive of BuBA dissociation mimicking product release. The dominant species is significantly more rhombic than that (i.e., Nb) observed following turnover of Na-expressing NHase, or when imidazole is added to expel butyric acid, and strongly suggests binding of BuBA and PBA to the Fe(III) ion in the Fe-type NHase. It is tempting to speculate that the additional resonance that is present in the BuBA spectrum, but not in the PBA spectrum, is indicative of the second, more weakly interacting binding mode for BuBA indicated in the structural study. Most interestingly, the g1 value of the dominant species observed in the boronic acid complexes was reproduced in the spectrum obtained upon incubating active NHase with the very slow substrate acetonitrile (Figure 7C). This may represent the first experimental evidence that the boronic acid complexes do indeed mimic steps in the reaction. On the basis of these data, then, the acetonitrile EPR signal is assigned to the cyclic intermediate (species II of Scheme 3) formed upon nucleophilic attack of the αCys-OH sulfenic acid ligand on the Fe(III)-bound nitrile carbon atom of the substrate.4 We tentatively propose that the minor component of the BuBA EPR signal, which is not observed with PBA, corresponds to the second crystallographically characterized conformation with BuBA (PDB entry 4OB1), in which the boronic O–Cys118 S interaction is much weakened, and was assigned to a mimic of the post-transition-state product release stage, corresponding to the species subsequent to species II in the “A” and “B” arms of Scheme 3.
Scheme 3.
Proposed Catalytic Cycle for NHase
Supplementary Material
Acknowledgments
Funding
This work was supported by the National Science Foundation (Grants CHE-1412443 to R.C.H., CHE-1308672 to D.L., CHE-1056845 to A.T.F., CHE-1462201 to B.B., and CHE-1532168 to B.B. and R.C.H.), the Todd Wehr Foundation, Bruker Biospin, and the National Institutes of Health/National Institute of Biomedical Imaging and Bioengineering National Biomedical EPR Center (P41-EB001980).
Footnotes
Notes
The authors declare no competing financial interest.
The Supporting Information is available free of charge on the ACS Publications website at DOI: 10.1021/acs.bio-chem.6b00876.
Details of X-ray crystallography, metric parameters for geometry-optimized models of the FeNHase active site, optimized structural coordinates for NHase species, comparison of experimental and computed g values for [Fe3+(ADIT)(ADIT-X)]+/2+, pH dependence of NHase, and consideration of the assignments of Na and Nb in light of ENDOR data (PDF)
References
- 1.Kovacs JA. Chem Rev. 2004;104:825–848. doi: 10.1021/cr020619e. [DOI] [PMC free article] [PubMed] [Google Scholar]
- 2.Banerjee A, Sharma R, Banerjee U. Appl Microbiol Biotechnol. 2002;60:33–44. doi: 10.1007/s00253-002-1062-0. [DOI] [PubMed] [Google Scholar]
- 3.Müller D, Gabriel J. Folia Microbiol. 1999;44:377–379. doi: 10.1007/BF02903708. [DOI] [PubMed] [Google Scholar]
- 4.Huang W, Jia J, Cummings J, Nelson M, Schneider G, Lindqvist Y. Structure. 1997;5:691–699. doi: 10.1016/s0969-2126(97)00223-2. [DOI] [PubMed] [Google Scholar]
- 5.Doan PE, Nelson MJ, Jin H, Hoffman BM. J Am Chem Soc. 1996;118(29):7014–7015. [Google Scholar]
- 6.Yano T, Ozawa T, Masuda H. Chem Lett. 2008;37:672–677. [Google Scholar]
- 7.Dey A, Chow M, Taniguchi K, Lugo-Mas P, Davin S, Maeda M, Kovacs JA, Odaka M, Hodgson KO, Hedman B, Solomon EI. J Am Chem Soc. 2006;128:533–541. doi: 10.1021/ja0549695. [DOI] [PMC free article] [PubMed] [Google Scholar]
- 8.Shearer J, Callan PE, Amie J. Inorg Chem. 2010;49:9064–9077. doi: 10.1021/ic101765h. [DOI] [PMC free article] [PubMed] [Google Scholar]
- 9.Dey A, Chow M, Taniguchi K, Lugo-Mas P, Davin S, Maeda M, Kovacs JA, Odaka M, Hodgson KO, Hedman B, Solomon EI. J Am Chem Soc. 2006;128:533–541. doi: 10.1021/ja0549695. [DOI] [PMC free article] [PubMed] [Google Scholar]
- 10.Hashimoto K, Suzuki H, Taniguchi K, Noguchi T, Yohda M, Odaka M. J Biol Chem. 2008;283:36617–36623. doi: 10.1074/jbc.M806577200. [DOI] [PMC free article] [PubMed] [Google Scholar]
- 11.Brennan BA, Alms G, Nelson MJ, Durney LT, Scarrow RC. J Am Chem Soc. 1996;118:9194–9195. [Google Scholar]
- 12.Nelp MT, Astashkin AV, Breci LA, McCarty RM, Bandarian V. Biochemistry. 2014;53:3990–3994. doi: 10.1021/bi500260j. [DOI] [PMC free article] [PubMed] [Google Scholar]
- 13.Sugiura Y, Kuwahara J, Nagasawa T, Yamada H. J Am Chem Soc. 1987;109:5848–5850. [Google Scholar]
- 14.Kopf MA, Bonnet D, Artaud I, Pétré D, Mansuy D. Eur J Biochem. 1996;240:239–244. doi: 10.1111/j.1432-1033.1996.0239h.x. [DOI] [PubMed] [Google Scholar]
- 15.Popescu VC, Münck E, Fox BG, Sanakis Y, Cummings JG, Turner IM, Nelson MJ. Biochemistry. 2001;40:7984–7991. doi: 10.1021/bi010198f. [DOI] [PubMed] [Google Scholar]
- 16.Light KM, Yamanaka Y, Odaka M, Solomon EI. Chem Sci. 2015;6:6280–6294. doi: 10.1039/c5sc02012c. [DOI] [PMC free article] [PubMed] [Google Scholar]
- 17.Rzeznicka K, Schätzle S, Böttcher D, Klein J, Bornscheuer UT. Appl Microbiol Biotechnol. 2010;85:1417–1425. doi: 10.1007/s00253-009-2153-y. [DOI] [PubMed] [Google Scholar]
- 18.Gumataotao N, Kuhn ML, Hajnas N, Holz RC. J Biol Chem. 2013;288:15532–15536. doi: 10.1074/jbc.M112.398909. [DOI] [PMC free article] [PubMed] [Google Scholar]
- 19.Otwinowski Z, Minor W. Methods Enzymol. 1997;276:307–326. doi: 10.1016/S0076-6879(97)76066-X. [DOI] [PubMed] [Google Scholar]
- 20.Kuhn ML, Martinez S, Gumataotao N, Bornscheuer U, Liu D, Holz RC. Biochem Biophys Res Commun. 2012;424:365–370. doi: 10.1016/j.bbrc.2012.06.036. [DOI] [PubMed] [Google Scholar]
- 21.McCoy AJ, Grosse-Kunstleve RW, Adams PD, Winn MD, Storoni LC, Read RJ. J Appl Crystallogr. 2007;40:658–674. doi: 10.1107/S0021889807021206. [DOI] [PMC free article] [PubMed] [Google Scholar]
- 22.Emsley P, Lohkamp B, Scott WG, Cowtan K. Acta Crystallogr, Sect D: Biol Crystallogr. 2010;66:486–501. doi: 10.1107/S0907444910007493. [DOI] [PMC free article] [PubMed] [Google Scholar]
- 23.Winn MD, Ballard CC, Cowtan KD, Dodson EJ, Emsley P, Evans PR, Keegan RM, Krissinel EB, Leslie AG, McCoy A, McNicholas SJ, Murshudov GN, Pannu NS, Potterton EA, Powell HR, Read RJ, Vagin A, Wilson KS. Acta Crystallogr, Sect D: Biol Crystallogr. 2011;67:235–242. doi: 10.1107/S0907444910045749. [DOI] [PMC free article] [PubMed] [Google Scholar]
- 24.Adams PD, Afonine PV, Bunkóczi G, Chen VB, Davis IW, Echols N, Headd JJ, Hung LW, Kapral GJ, Grosse-Kunstleve RW, McCoy AJ, Moriarty NW, Oeffner R, Read RJ, Richardson DC, Richardson JS, Terwilliger TC, Zwart PH. Acta Crystallogr, Sect D: Biol Crystallogr. 2010;66:213–221. doi: 10.1107/S0907444909052925. [DOI] [PMC free article] [PubMed] [Google Scholar]
- 25.Hyde JS, Bennett B, Walter ED, Millhauser GL, Sidabras JW, Antholine WE. Biophys J. 2009;96:3354–3362. doi: 10.1016/j.bpj.2009.01.034. [DOI] [PMC free article] [PubMed] [Google Scholar]
- 26.Kowalski JM, Bennett B. J Am Chem Soc. 2011;133:1814–1823. doi: 10.1021/ja106550u. [DOI] [PMC free article] [PubMed] [Google Scholar]
- 27.Stoll S, Schweiger A. J Magn Reson. 2006;178:42–55. doi: 10.1016/j.jmr.2005.08.013. [DOI] [PubMed] [Google Scholar]
- 28.Neese F. WIREs Comput Mol Sci. 2012;2:73–78. [Google Scholar]
- 29.Nagashima S, Nakasako M, Dohmae N, Tsujimura M, Takio K, Odaka M, Yohda M, Kamiya N, Endo I. Nat Struct Biol. 1998;5:347–351. doi: 10.1038/nsb0598-347. [DOI] [PubMed] [Google Scholar]
- 30.Hopmann KH. Inorg Chem. 2014;53:2760–2762. doi: 10.1021/ic500091k. [DOI] [PubMed] [Google Scholar]
- 31.Adamo C, Scuseria GE, Barone V. J Chem Phys. 1999;111:2889–2899. [Google Scholar]
- 32.Perdew JP, Burke K, Ernzerhof M. Phys Rev Lett. 1996;77:3865–3868. doi: 10.1103/PhysRevLett.77.3865. [DOI] [PubMed] [Google Scholar]
- 33.Fouqueau A, Mer S, Casida ME, Lawson Daku LM, Hauser A, Mineva T, Neese F. J Chem Phys. 2004;120:9473–9486. doi: 10.1063/1.1710046. [DOI] [PubMed] [Google Scholar]
- 34.Schafer A, Huber C, Ahlrichs R. J Chem Phys. 1994;100:5829–5835. [Google Scholar]
- 35.Schafer A, Horn H, Ahlrichs R. J Chem Phys. 1992;97:2571–2577. [Google Scholar]
- 36.Weigend F, Ahlrichs R. Phys Chem Chem Phys. 2005;7:3297–3305. doi: 10.1039/b508541a. [DOI] [PubMed] [Google Scholar]
- 37.Stratmann RE, Scuseria GE, Frisch MJ. J Chem Phys. 1998;109:8218–8224. [Google Scholar]
- 38.Casida ME, Jamorski C, Casida KC, Salahub DR. J Chem Phys. 1998;108:4439–4449. [Google Scholar]
- 39.Bauernschmitt R, Ahlrichs R. Chem Phys Lett. 1996;256:454–464. [Google Scholar]
- 40.Hirata S, Head-Gordon M. Chem Phys Lett. 1999;314:291–299. [Google Scholar]
- 41.Hirata S, Head-Gordon M. Chem Phys Lett. 1999;302:375–382. [Google Scholar]
- 42.Neese F. J Chem Phys. 2001;115:11080–11096. [Google Scholar]
- 43.Neese F. Curr Opin Chem Biol. 2003;7:125–135. doi: 10.1016/s1367-5931(02)00006-6. [DOI] [PubMed] [Google Scholar]
- 44.Taylor CPS. Biochim Biophys Acta, Protein Struct. 1977;491:137–149. [Google Scholar]
- 45.Martinez S, Wu R, Sanishvili R, Liu D, Holz R. J Am Chem Soc. 2014;136:1186–1189. doi: 10.1021/ja410462j. [DOI] [PMC free article] [PubMed] [Google Scholar]
- 46.Li W, Blaesi EJ, Pecore MD, Crowell JK, Pierce BS. Biochemistry. 2013;52:9104–9119. doi: 10.1021/bi4010232. [DOI] [PubMed] [Google Scholar]
- 47.Jin H, Turner IM, Nelson MJ, Gurbiel RJ, Doan PE, Hoffman BM. Coordination Sphere of the Ferric Ion in Nitrile Hydratase. J Am Chem Soc. 1993;115:5290–5291. [Google Scholar]
- 48.Nelp MT, Song Y, Wysocki VH, Bandarian V. A Protein-Derived Oxygen is the Source of the Amide Oxygen of Nitrile Hydratases. J Biol Chem. 2016;291:7822–7829. doi: 10.1074/jbc.M115.704791. [DOI] [PMC free article] [PubMed] [Google Scholar]
- 49.Allison WS, Benitez LV. An Adenosine Triphosphate-Phosphate Exchange Catalyzed by a Soluble Enzyme Couple Inhibited by Uncouplers of Oxidative Phosphorylation. Proc Natl Acad Sci U S A. 1972;69:3004–3008. doi: 10.1073/pnas.69.10.3004. [DOI] [PMC free article] [PubMed] [Google Scholar]
- 50.Kice JL, Cleveland JP. Nucleophilic Substitution Reactions Involving Sulfenic Acids and Sulfenyl Derivatives the Nucleophile- and Acid-Catalyzed Oxygen-18 Exchange of Phenyl Benzenethiosulfinate. J Am Chem Soc. 1973;95:104–109. [Google Scholar]
- 51.Lugo-Mas P, Dey A, Xu L, Davin SD, Benedict J, Kaminsky W, Hodgson KO, Hedman B, Solomon EI, Kovacs JA. How Does Single Oxygen Atom Addition Affect the Properties of an Fe–Nitrile Hydratase Analogue? The Compensatory Role of the Unmodified Thiolate. J Am Chem Soc. 2006;128:11211–11221. doi: 10.1021/ja062706k. [DOI] [PMC free article] [PubMed] [Google Scholar]
Associated Data
This section collects any data citations, data availability statements, or supplementary materials included in this article.


