Abstract
A small, portable gas chromatograph (GC) was assembled for the trace detection of controlled substances using a novel quartz crystal microbalance sensor (QCM). The QCM crystal surface was modified with a variety of sorption materials to increase adsorption thereby amplifying mass detection. Single polymer thin film coatings increased the QCM response by 1–2 orders of magnitude, while operating at over 100 °C. Adding a layer of carbonaceous nanomaterial (graphene or carbon nanotubes) above such a film dramatically increased sensitivity by up to 3 orders of magnitude compared to uncoated crystals. Separation and detection of submicrogram quantities of controlled substances was carried out within minutes by employing a GC column and detector temperature ramp up to 220 °C. An additional 10-fold enhancement in sensitivity was achieved by mechanical abrasion of the sample swabs used in the sample introduction process. This study demonstrated a novel use of a polymer composite modified QCM as a chemical sensor at high temperatures.
Graphical abstract
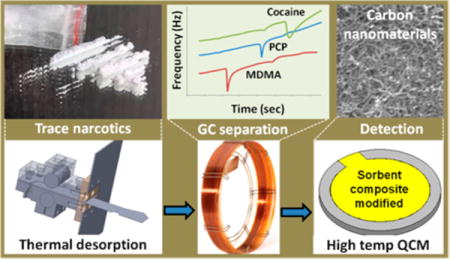
Quartz crystal microbalances or QCMs have been used for years in a number of different applications such as film thickness monitors in vacuum deposition processes.1 QCMs have also been used extensively as gas sensors.2 The widespread use of these mass detectors can be attributed to a number of factors, including high sensitivity in the subnano-gram range,3,4 relatively low-cost, ease of use, reliability, and broad applicability. QCMs are quite versatile, operable in both the gas and liquid phase, as well as under a range of pressure and temperature conditions.
Generally, QCMs operate as mass detectors based on the principle that a resonating quartz crystal changes frequency when a material adsorbs on its surface. The relationship between mass and frequency change was first established by G. Sauerbrey5 in the late 1950s and has resulted in many commercial thin film thickness monitors. The sensitivity of the QCM is a direct function of the resonance frequency change. When used as a chemical sensor, the surface of the quartz crystal is typically coated with a polymer thin film to promote the adsorption of the analyte of interest and to more selectively target a specific class of chemicals.6 The use of a polymer thin film coating has been shown to enhance the mass sensitivity of the QCM by several orders of magnitude due to the increased sorption interaction between the adhered polymer and the target molecule.7,8
In addition to polymer coatings, carbon-based nanomaterials have been shown to significantly increase the sensitivity of chemical sensors, both for gas and aqueous measurements.9–11 Several researchers have reported on the use of carbon nanotubes as QCM coatings to enhance both selectivity and sensitivity.12–14 The carbon based nanomaterials that work best are typically high surface area materials with large adsorption capacities that can be chemically tuned to interact with certain compounds. In this work, a variety of polymers, carbon nanomaterials, and other high surface area compounds were investigated as QCM coatings for high-temperature measurements. High temperatures are required for the reversible detection of low volatility compounds.
The objective of this paper is to demonstrate the suitability of QCM as the detector module for a small, portable gas chromatograph (GC). Lower instrumentation and operation costs, increased device mobility, and broad applicability are general drivers in the development of new analytical equipment. Instrumental methods based on GC-QCM have been described as early as the 1960s;15–17 however, those studies targeted the analysis of volatile to semivolatile compounds that do not require high QCM operation temperatures.18 This particular work targets the development of a solid trace detector of controlled substances for use in forensics, law enforcement, and drug analyses. This work presents the successful application of a polymer modified QCM detector operable at high temperatures for the analysis of nonvolatile compounds. Most existing contraband drug trace detectors are based on ion mobility spectrometers (IMS) that tend to be costly. The use of a QCM as the GC detector demonstrates a low-cost sensing technique, which also allows instrument portability for the measurement of both volatile and nonvolatile chemicals.
EXPERIMENTAL SECTION
Materials and Reagents
Table 1 shows an overview of the polymer and carbon materials (first and second layers, respectively) used in this study along with some of their key properties. Polymer solvents were obtained from Sigma-Aldrich Corporation (St. Louis, MO). All materials were used as received without further purification. Polymers were selected based on the ability to adsorb the chemicals of interest. Generally, polymers with similar polarity as the target molecules or intermolecular affinity (i.e., π-interactions) are more likely to show good sorption. Likewise, polymers with elastic behavior (i.e., low glass transition point) or sol–gel produced materials are known for good sorption properties.19 The in-house synthesized sol–gels SG-179, SG-60A, and SG-60B were prepared as previously reported.20,21 Finally, high surface area polymers of materials with microporosity have frequently been used for sensor applications. The synthesis of the microporous PIM-1 polymer was previously described by Budd et al.22 Finally, the ZIF-8 nanoparticle solution was synthesized as reported in our earlier paper.23,24
Table 1.
QCM Disc Coatings with Their Key Properties Where Available/Applicable
| polymer layer | acronym | source | MW (g/mol) |
density (g/mL) |
|---|---|---|---|---|
| polydimethylsiloxane | PDMS | Dow Corning Corporation | 0.97 | |
| poly[1,2-bis(3-silsesquioxanyl)ethane] | SG-179 solgel | in-house | ||
| poly[4,4′-bis(3-silsesquioxanyl)-1,1′-biphenyl] | SG-60A solgel | in-house | ||
| poly[N,N′-bis(3-silsesquioxanylpropyl)urea] | SF-60B solgel | in-house | ||
| zeolitic imidazolate framework | ZIF-8 two-dip | in-house | 229.6 | 0.35 |
| zeolitic imidazolate framework | ZIF-8 four-dip | in-house | 229.6 | 0.35 |
| polyvinylidene fluoride | PVDF | Scientific Polymer Products | 530000 | 1.76 |
| polymer of intrinsic microporosity | PIM-1 | in-house | 100000 | 1.1 |
| polyimide sealing resin | PI Aldrich | Sigma-Aldrich | 1.42 | |
| polyimide | PI Restek | Restek | 1.42 | |
|
| ||||
| composite layer | acronym | source | length (μm) |
diameter (nm) |
|
| ||||
| graphitized carbon nanopowder | CB | Supelco | <0.2 | |
| carboxen 1000 carbon molecular sieve | carboxen | Aldrich | 1–1.2 | |
| multiwall carbon nanotubes | MWNT | Aldrich | 5 | 6–9 |
| single-wall carbon nanotubes | SWNT | Aldrich | 2.5 | 1.2–1.5 |
| COOH functionalized MWNTs | F.MWNT | US Research Nanomaterials | 0.5–2 | 2–5 |
| nanographene platelets | graphene | Angstron Materials | <10 | |
| poly(2,6-diphenylphenyleneoxide) | tenaxTA | Supelco | 200 | |
| carbosieve carbon molecular sieve | carbosieve | Aldrich | 0.6–1.5 | |
All analytical standards of controlled substances were obtained from Cerilliant Corporation (Round Rock, TX) at a concentration of 1 mg/mL. Sample swabs were purchased from DSA Detection (North Andover, MA; part no. ST1318) and Morpho Detection (Wilmington, MA; part no. M0001964). Analytical calibration curves were constructed by micro-pipetting the standard solutions onto sample swabs, followed by evaporation of the solvent prior to inserting the swab into the GC thermal desorber inlet.
Film Deposition
Six MHz AT-cut gold-coated quartz crystal discs were purchased from Sycon, now Inficon (East Syracuse, NY). Special QCM discs for high temperature application were obtained from Colnatec LLC (Gilbert, AZ) and only used in this study when explicitly noted. The discs were rinsed with acetonitrile and dried under nitrogen prior to use. The polymer thin film coated quartz crystals were prepared by spin-coating (Specialty Coating Systems, Indianapolis, IN) 0.3 mL of a 2% polymer solution at 2500 rpm for 2 min. For the two-component PDMS, the resin and catalyst were mixed just prior to spin-coating. Polymer solution concentration and spin velocity were adjusted to vary the film thicknesses. The coated discs were dried at 60 °C for a minimum of an hour. ZIF-8 films were prepared by dip-coating the quartz crystal disc into the nanoparticle solution for two and four dips, respectively. The zeolitic films were allowed to dry in air between each dip cycle.
The typical coating procedure for the bilayer QCM coatings, consisting of a polymer layer and a sorption-enhancing carbon layer, was carried out as follows: first, a 2% PDMS solution (resin and catalyst) was spin-coated onto the quartz crystal disc. Second, a 1% toluene suspension of the carbon material that had been sonicated for at least an hour was subsequently spray-coated on top of the PDMS polymer film. The QCM disc was then dried at 60 °C for a minimum of an hour to complete the polymer cross-linking. Normally, for all bilayer film constructs, the carbon layer was deposited as a suspension while the underlying polymer layer was added in solution form. Select experiments were carried out by mixing the carbon material with the polymer or spray-coating the PDMS on top of the carbon layer. Generally, different forms of film deposition were tested in this study from spin-coating to dip-coating and spray-coating.
Film Characterization
QCM polymer coating thicknesses were approximated by means of the well-known Sauerbrey equation. Specifically, the calculations used a crystal area of 0.196 cm2, a quartz density of 2.65 g/cm3, and a shear modulus of 2.95 × 10¹¹ dyn/cm2. The linear equation is valid only for small elastic masses added to the crystal surface. It becomes inaccurate for masses greater than about 2% of the crystal mass or when nongravimetric contributions (e.g., viscoelastic effects) become more pronounced.14 The frequency of each disc was measured multiple times before and after the polymer deposition at room temperature to minimize measurement fluctuations. SEM images (Hitachi, S-3400N) were obtained using a secondary electron detector with an acceleration voltage of 15 kV and a probe current of 30 μA. The samples were coated with Au prior to imaging to prevent charging using a sputter coater (Emitech K550X, 12 mA, 2 min).
Measurement Setup
The QCM devices and measurement circuit that were used for this study were purchased from Colnatec LLC (Gilbert, AZ). Colnatec’s mass detectors are unique in that the sensors are capable of operation of up to 500 °C without the need of water cooling. Colnatec and others have developed temperature compensation algorithms that improve sensor stability at high temperatures.25,26
The QCM was integrated as the detector into an in-house constructed portable GC (overall size of less than 1 ft3 and 15 lbs weight). A more detailed description of the GC is found in the Supporting Information. The sample inlet consists of a thermal desorber heated to 210 °C that evaporates the sample from a sample swab. Both, the GC oven compartment and the QCM detector are PID controlled and capable of temperature ramping to 240 °C at up to 50 °C/min. The GC column was a 15 m long dimethyl polysiloxane fused silica capillary (Restek Corporation, Bellefonte, PA). Data acquisition and processing were handled with LabVIEW software. The data in the figures are averaged maximum peak heights or areas as noted, for a given isothermal or ramp profile.
All measurements intended to evaluate the QCM sensor coatings were carried out with Tropine as the sample analyte and the following GC profile: column ramp from 120 to 210 °C at 15 °C/min and 25 kPa pressure of nitrogen carrier gas. The detector temperature was kept isothermal at 100, 150, or 180 °C. Contraband drug measurements were carried out with a column ramp of 120 to 220 °C at 25 °C/min and 55 kPa pressure. Simultaneously, the detector temperature was ramped from 160 to 220 °C at 10 °C/min. QCM temperature control was imperative to obtain ~1 ppm precision (1 Hz in 6 MHz) over a temperature range of 25 to 240 °C. Calibration tests for retention times and detector sensitivity were carried out frequently with samples of 3 μg of the PCP standard solution.
Harvest Efficiency Experiment
Sample swab collection efficiency experiments were set up by depositing the analyte of interest onto a glass plate (8 × 8 in.) on a specific mark. The solvent was allowed to fully evaporate before a sample swab was run over it to collect the residual chemical traces. The transfer length on the glass slide was controlled to 5 in. each time as well as the swab pressure that was fixed with a 2 kg weight. Sample swab modifications included: surface roughness modification with 240 grit sandpaper, polymer deposition, or Argon plasma treatment for 15 min. The polymer coatings included the sol–gel SG-179 that was previously used as a QCM coating and a silicon adhesive type CV-1161 from NuSil (Carpinteria, CA). After deposition of the adhesive, the coating was allowed to dry for 1 min and placed on a 250 °C hot plate for 2 h for curing. The modified sample swab harvesting experiments were compared to measurements that included the direct deposition of the analyte onto the swab (i.e., considered as 100% maximum sample collection). Measurements of each type of sample swab were carried out at a minimum of seven repetitions (with new swabs).
RESULTS AND DISCUSSION
Single Layer Polymer Modified QCM Measurements
Very few studies have investigated the use of resonator-based chemical sensors at elevated temperatures.27 One reason for this is that most QCM mass detectors require additional water cooling at temperatures above 120–150 °C. Second, a 10° AT-cut crystal is best operated at ambient temperatures as the resonant frequency of the crystal is fairly constant within this temperature regime.28 Above 100 °C, the frequency varies with small temperature changes, thus decreasing the signal-to-noise ratio of the QCM measurement.
The QCM mass monitor chosen for this study is novel since it can be operated to temperatures of up to 500 °C without the need of water cooling.
In order to increase the sensitivity of the QCM sensor toward the target controlled substances, the bare quartz crystals were initially modified with various polymer thin film surface coatings. Figure 1 shows a number of different crystal surface coatings that were plotted versus average signal response (maximum peak height) to 100 μg of Tropine, a contraband structural analog to cocaine. The figure (far left) displays two different types of blank 6 MHz AT-cut quartz crystals (one from Sycon, the other from Colnatec), followed by a cross-linked PDMS thin film, three different samples of high temperature stable sol–gel polymers, two solution dip-coated nanoparticles of ZIF-8 (a zeolitic-like hybrid sorbent material), PVDF, a polymer of intrinsic microporosity (PIM), and two polyimide samples. All of these coatings have been used for chemical sensor applications in earlier studies to increase the adsorption of the chemical of interest. The PIM-1 and the ZIF-8 sample were chosen for their high porosity, the latter being a subclass of metal organic frameworks and one of the highest surface area materials known to date. PIMs on the other hand, polymers that demonstrate microporosity without possessing a network of covalent bonds, combine solution processability and large surface area with structural diversity and have proven utility for making membranes and sensors.29
Figure 1.
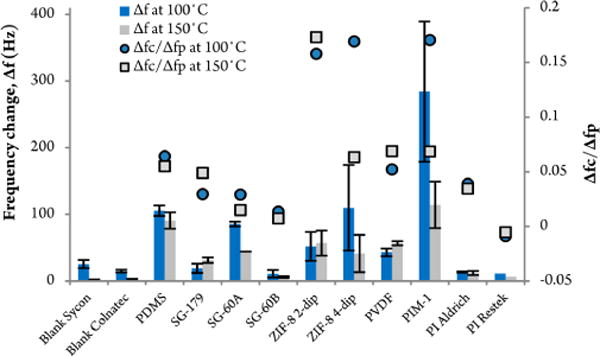
QCM surface coatings applied by spin-coating on gold-coated quartz crystals. The QCM responses, based on sampling 100 μg Tropine, are plotted on the primary ordinate. The secondary y axis displays the ratio of ΔFc/ΔFp to compare the sensitivity of each coating standardized by the mass loading of the sorbent. All measurements were carried out at isothermal detector temperatures of 100 and 150 °C. A column ramp profile from 120 to 210 °C at 15 °C/min and 25 kPa pressure was used. The first two QCM disc are different types of blank discs from Sycon and Colnatec, followed by various coatings on a Sycon QCM disc. Error bars indicate the standard deviation of at least three measurements.
The mass loading of the sorbents on the QCM was aimed at being similar for all the different sensor coatings. However, in order to compare the sensitivity of each coating standardized by the mass loading of the sorbent (ΔFp), the tropine chemical response (ΔFc) was also plotted as the ratio of ΔFc/ΔFp on the secondary ordinate.
The three coated samples of PDMS, ZIF-8, and PIM-1 showed the biggest gain in frequency response, with the latter two displaying a large margin of standard deviation. The increase in response compared to the uncoated QCM disc was 1 to 2 orders of magnitude depending on the detector temperature.
The most reproducible coating material, PDMS, was further tested at different thicknesses with the goal of maximizing the sensor response. Figure 2 displays the sensitivity increase of cross-linked PDMS films with an increasingly thicker coating. The film thickness was calculated using Sauerbrey’s equation, which correlates changes in the oscillation frequency (ΔFp) with the deposited mass. The maximum thickness is limited by the intrinsic oscillation of the QCM at the point when the 6 MHz resonant frequency can no longer be maintained.
Figure 2.
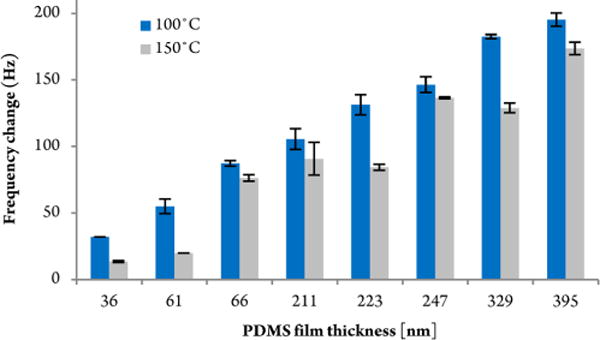
QCM signal response as a function of the mass (i.e., thickness) of the spin-coated PDMS cross-linked polymer film. The QCM responses, based on sampling 100 μg Tropine, are plotted on the ordinate. Film thicknesses larger than 400 nm resulted in a signal loss (i.e., the discontinuance of the fundamental resonant frequency). All measurements were repeated at QCM detector temperatures of 100 and 150 °C.
Bilayer Polymer/Sorbent Composite Modified QCM Measurements
Next, a number of sorbent carbon-based nanomaterials were evaluated in the form of a bilayer structure on top of the spin-coated PDMS film (which was kept identical for all samples). The composites were affixed to the polymer prior to cross-linking it. As an example, the first sample in Figure 3 illustrates a modified quartz crystal that was first spin-coated with PDMS and subsequently spray-coated with a suspension of graphitized carbon nanopowder (CB). This particular bilayer modified crystal already showed more than double the highest response obtained with the thickest PDMS polymer film only. In comparison to the single polymer film, the CB bilayer (and generally all of the composite multilayer constructions) showed over 50% loss in response when measured at an elevated temperature of 150 °C instead of 100 °C. The signal would diminish again by half when measured at 180 °C. In general, higher QCM temperatures are required for the measurements of low volatility compounds due to the “stickiness” of these analytes in the GC system.
Figure 3.
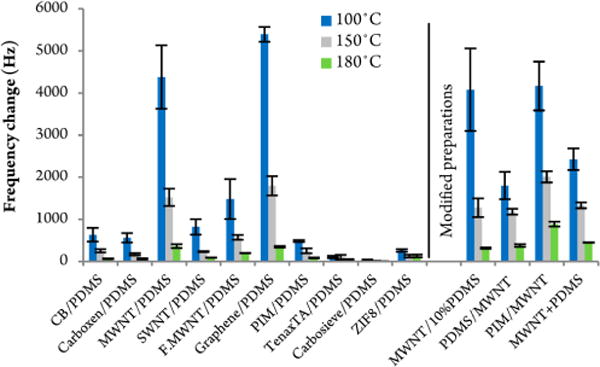
Frequency responses of bilayer modified QCM quartz crystal discs. The first layer corresponds to an identical spin-coated PDMS film, followed by a spray-coated sorbent composite suspension. The last four samples were prepared differently. The QCM responses, based on sampling 100 μg Tropine, are plotted on the ordinate. All measurements were repeated at 3 different isothermal QCM detector temperatures.
As shown in Figure 3, several different carbonaceous nanomaterials and general sorbent composites were tested and compared to each other, ranging from various carbon nanotubes to graphene, Carboxen, traditional adsorbents like Tenax and Carbosieve, as well as the microporous ZIF and PIM. PIM was deposited as a suspension on top of the PDMS film as opposed to a solution (a solution was used for the single film deposition in Figure 1). The last four composites in Figure 3 were subject to a modified bilayer configuration: a 10% thicker underlying spin-coated PDMS film, a reversed bilayer configuration where the PDMS film was spray-coated on top of the MWNT film, a second reversed configuration with PIM as the top layer, and finally a QCM film with the MWNT mixed within the PDMS polymer. The last example with the mixed polymer/carbon nanotube structure seems to be the most common method to deposit carbonaceous nanomaterials onto a QCM crystal surface in literature published to date. The two reversed bilayer configurations with the polymer as the top-coat provide improved mechanical stability of the crystal coatings and thus facilitate handling of the modified quartz crystals. Presumably, spray-coating the polymer solution on top of the carbon nanomaterials locks the carbon materials in place and holds it onto the gold-coated quartz crystal.
Clearly, much improved results were obtained with MWNTs and graphene in the sorbent composite with a frequency change of approximately 5000 Hz at 100 °C (detector temperature) compared to the response with the blank quartz disc of just 25 Hz (refer to Figure 1), thus a 200 fold increase in sensitivity due to the carbonaceous nanomaterial bilayer. At elevated sensor temperatures of 150 °C, the sensitivity gain was even larger by up to 3 orders of magnitude compared to the uncoated crystal responses of just 1.5 Hz on average. At 180 °C detector temperature, uncoated QCM discs did not show any response to the test sample.
Surprisingly, lower responses were obtained with the microporous PIM, Tenax, Carbosieve, and ZIF-8 sorbents. The pore diameters of most of the nanomaterials with the exception of TenaxTA are likely too small to accommodate the bulky Tropine molecule as well as most of the controlled substances targeted in this study. As a result, many of these carbon nanomaterial composites do not provide all the active surface sites or the theoretical surface areas. Also, the carbon nanopowder materials generally are nonporous. Consequently, the sorption behavior mainly depends on surface interactions such as van der Waals and dipole forces. Future research will study sorbent materials with larger pore sizes (i.e., customized PIMs, MOFs, and ZIFs) that can accommodate larger analytes. It is likely that the dispersion of the nanomaterials plays a significant role in how the active sorption sites of the composite interact with the target analyte. To that end, many factors like the solvent and temperature that was used for the coating process or the extent of particle dispersion by sonication can have an effect on the sorbent deposition (and particle aggregation) on the QCM surface. Perhaps the high surface area to volume ratio and high density of surface active sites distinguishes the carbon nanomaterials from their micro- or macro-scale counterparts such as PIM, Tenax, Carbosieve, etc. The data also showed that the COOH-functionalized MWNT coating resulted in lower responses compared to the non-functionalized carbon nanotubes. It seems that the more hydrophobic, unmodified MWNT interacts more strongly with the contraband drug analog. In line with this, the outer surfaces of ZIF-8 nanoparticles are found to be terminated with carboxylate and water/hydroxyl groups and are therefore less hydrophobic than the inaccessible inner pore regions, also leading to lower adsorption.30
The crystal coating PIM/MWNT, selected for its high sensitivity at 180 °C, was used for all subsequent measurements. The choice of MWNT over graphene was simply due to easier handling considerations; but bilayer coatings with both of these carbonaceous nanomaterials produced the best responses. Carbon nanotubes are known to have strong attractive forces between nanotubes, which account for their tightly bundled conformation and low dispersion in both polar and apolar solvents.31 In order to thoroughly debundle the nanotube sheaths, sonication of over 5 h was used to obtain a smooth QCM crystal coating. The SEM picture in Figure 4 confirms the debundled nanotube structures of a bilayer sample composed of PIM/MWNT coated QCM crystal. The carbon nanomaterial is deposited as a random, three-dimensional, tubular network. The PIM polymer top-coat could not easily be identified by means of SEM; however, the thin polymer film contributes strongly to the mechanical stability of the bilayer composite structure. On the basis of the SEM image, the voluminous structure of the carbon nanotubes may be a significant contributor to the good response of this sorbent. In comparison, Figure 4B shows the SEM picture of a carbon nanopowder sample (PIM/CB). The between-nanotubes surface area appears to be much higher than the between-particle surface area of the spherical sorbent particles, which supports our hypothesis of the voluminous carbon nanotube structures.
Figure 4.
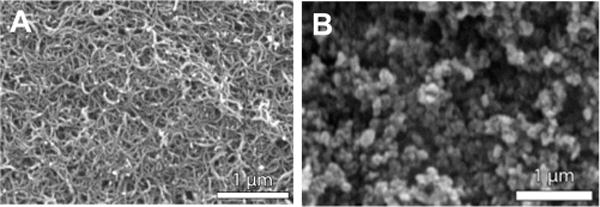
SEM image of (A): a PIM/MWNT bilayer composite and (B) a PIM/CB bilayer composite on a gold-coated QCM crystal. The carbon nanotubes are well-dispersed and display the three-dimensional tubular network of the sorbent nanomaterial. The CB carbon nanopowder appears more clustered.
Further increases in the thickness of the MWNT coating (until the 6 MHz natural resonant frequency was disrupted) improved the QCM bilayer response even further. Compared with the responses in Figure 3 to a sample of 100 μg tropine, some bilayer configurations resulted in frequency responses of over 15000, 9000, and 4000 Hz at 100, 150, and 180 °C sensor temperature, respectively. Again, this corresponds to sensitivity gains of over 2 to 3 orders of magnitude compared to bare QCM crystals at the corresponding temperature.
Contraband Drug Measurements
The drawback of employing a thermal desorber is signified by broader GC chromatogram peaks as opposed to using a split/splitless injector. Even commercially available IMS systems that employ thermal desorber inlets show markedly wide desorption profiles for low vapor pressure compounds.32 On the other hand, ease-of-use and lack of sample preparation requirements are the benefits of thermal desorption sample introduction. Despite broader or tailing peaks, adequate selectivity can be maintained by using the peak onset for retention time measurements instead of the traditionally used peak maxima. Overall, the reproducibility of the retention times for all analytes based on peak onsets was approximately 1% (vide infra). At some point, the challenge of peak broadening becomes an issue of overlapping signals, which is resolved by peak deconvolution. To that end, peak broadening can be addressed with an appropriate data processing program to obtain sufficiently good resolution.
From Figures 1 and 3, it was apparent that higher detector temperatures for measurements of the same compound decreased the QCM responses. However, the detector temperature not only affects the absolute frequency change but also the peak shape (i.e., the peak broadening). Figure 5 shows an example of the chromatographic method improvement that was carried out for each compound. The figure plots the peak response as well as the peak width at half height (W1/2) at increasing detector temperatures for three different compounds. As shown, the best detector temperature (i.e., maximal frequency response with small W1/2) is different for each compound. Generally, narrower peaks can be obtained at higher detector temperatures at a cost of lower overall sensitivity.
Figure 5.
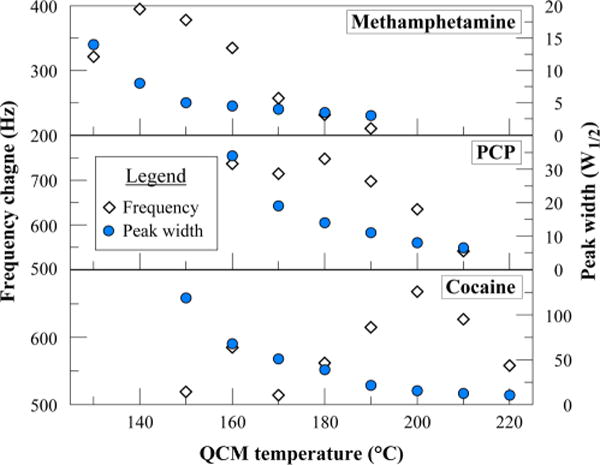
Peak height and peak width optimization as a function of the QCM detector temperature for three compounds. All three analytes (4 μg each) were measured at constant detector temperature in the range of 130–220 °C.
Figure 5 clearly shows the importance of the QCM sensor temperature on the chromatographic performance on each analyte. As a result, the in-house built GC allows not only for a column temperature ramp but also for ramping of the QCM detector temperature. Due to the broad range of vapor pressure of the chemicals of interest from 0.15 to 2 × 10⁻¹⁰ Torr, the optimal detector temperature is quite different. Table 2 shows the physical properties of the controlled substances targeted in this study.33 Because of the low vapor pressure of some of the contrabands, a QCM temperature of 220 °C was required to detect those chemicals and avoid a cold spot.
Table 2.
Physical Properties of Target Analytes
| name | molar mass (g/mol) | melting point (°C) | boiling point (°C) | vapor pressure (torr) |
|---|---|---|---|---|
| methamphetamine | 149.2 | 3 | 216 | 0.004 |
| ephedrine | 165.2 | 38 | 255 | 0.011 |
| MDMA | 193.3 | 150 | 283 | 2 × 10⁻⁴ |
| PCP | 243.4 | 47 | 340 | 1 × 10⁻⁵ |
| morphine | 285.3 | 254 | 476 | 2 × 10⁻¹⁰ |
| cocaine | 303.4 | 98 | 395 | 1 × 10⁻⁵ |
| THC | 314.5 | 160 | 390 | 5 × 10⁻⁸ |
| heroin | 369.4 | 173 | 493 | 6 × 10⁻⁸ |
The temperature ramp of the QCM detector was setup to accommodate the best possible sensitivity and peak shape for each analyte. The GC measurement cycle for the subsequent analyses was as follows: upon sample introduction, the GC oven was ramped from 120 to 220 °C at 25 °C/min, while the detector was ramped from 160 to 220 °C at 10 °C/min. Multiple measurements were carried out for each analyte concentration with frequent calibration testing for detector sensitivity and column condition. Figure 6 shows an example of a chromatogram with five different compounds. Further data are shown in the Supporting Information, including a discussion of the GC concept (e.g., the use of a valve to switch from vacuum to pressure mode).
Figure 6.
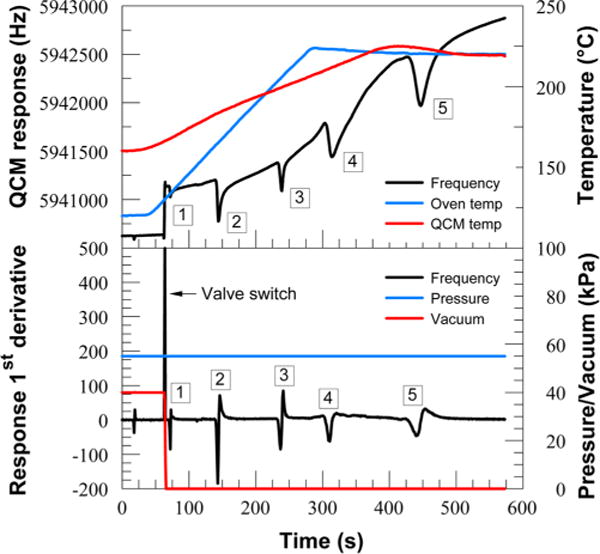
Top: chromatographic separation of (1) methamphetamine, (2) MDMA, (3) PCP, (4) cocaine, and (5) THC (4 μg each). Oven and QCM detector profile are shown on the secondary axis. Bottom: 1st derivative of the frequency response with vacuum and pressure profile on the secondary axis.
The general QCM response shows the frequency dependence as the QCM temperature increases. This frequency versus temperature drift is a repeatable function of a quartz crystal, related to how the crystal is cut from a bar of quartz. The data could be corrected by calibrating the frequency drift versus the temperature ramp increase. The first and second derivatives of the QCM response are used for the peak onset/maxima detection.
Figure 7 illustrates the sensitivity plots of all the chemicals of interest with the contraband standard solution micropipetted directly onto the sample swab. The data were plotted against the change in frequency height as well as the change of the integrated frequency area. There are some outliers in the data set, especially for the more volatile compounds. This is likely due to the method used to introduce the sample, that is, the time from when the analyte standard solution was deposited onto the swab, until the sample was inserted into the thermal desorber after the evaporation of the solvent. For most of the contraband drugs, the range of linear response to varying concentrations is limited, which was previously reported for other chemical QCM sensors.34 Good linearity over the entire concentration range tested was found for cocaine and THC. The average retention time, TR, and the lowest amount of detection (LOD) based on the three signal-to-noise approximation (i.e., signal/3× noise) is noted in each graph. The reproducibility of the retention times was around 1% based on peak onset measurements despite broadening peak shapes for the nonvolatile compounds. Overall, the LOD of the described GC was in the submicrogram range for most of the controlled substances. The standard deviations for the frequency height measurements were similar to the variation of frequency area changes. Improved sensitivity is expected by using another type of sample introduction, such as split/splitless solution injection. The thermal desorption sample inlet is suitable for trace solids and requires little sample preparation; however, this sample introduction is not as efficient and precise (in terms of sample introduction sharpness) as more conventional GC sample inlets.
Figure 7.
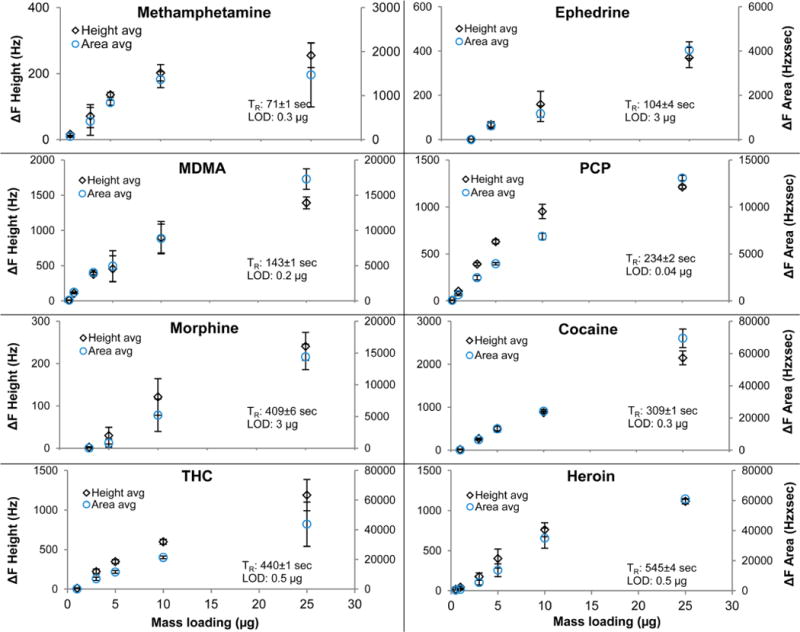
Sensitivity plots of controlled substance standards measured with a column ramp profile from 120 to 210 °C at 15 °C/min and 55 kPa pressure. The detector temperature was ramped from 160 to 220 °C at 10 °C/min. An aliquot of the solution was directly deposited onto the sample swab. Height frequency change is plotted on the primary ordinate, the area frequency change on the secondary ordinate.
Sample Swab Harvesting Efficiency
Sample collection efficiency experiments are generally set up on different surfaces (material, texture, roughness, etc.) to gauge the harvesting effectiveness of a specific sample swab from a specific surface.35,36 For this study, the collection surface was simplified to only one material (a smooth glass plate surface) with the focus on modifying the sample swab itself to promote increased harvesting efficiency.
Staymates et al. from the National Institute of Standards and Technology (NIST) recently described a modification of the same commercially available sample swabs to improve the surface residue collection efficiency by adding an adhesive coating.37 Their study targeted the harvesting of explosives residues as opposed to the contrabands studied here. Staymates’ recommended silicone coating was one of the polymer coatings investigated along with a sol–gel polymer that was described previously. Herein, since the deposition of the silicon adhesive included a heat treatment of the sample swab, a number of swabs were only subject to the heat treatment to differentiate between possible side effects. A second approach of modifying the sample swab was concerned with the surface morphology of the swab. Enhancing the surface roughness of the sample carrier should increase the mechanical traction of the surface swipe through physical entanglement. Finally, a third approach was an argon plasma treatment of the swabs to modify the surface properties of the sample carrier.
The experiments were carried out with 200 μg of tropine placed onto the glass plate (from solution), which were subsequently collected with the different sample swabs under controlled conditions (collection transfer length and swab pressure). Figure 8 shows the frequency responses of the different sample swabs starting with two types of blank sample carriers, both of which are based on Teflon-coated fiberglass meshes (the sample carriers from Morpho Detection were used for all subsequent surface modifications). In order to avoid false positive detections, it is important that swab surface modifications avoid any background interference, such as off-gassing of possible polymer coatings.
Figure 8.
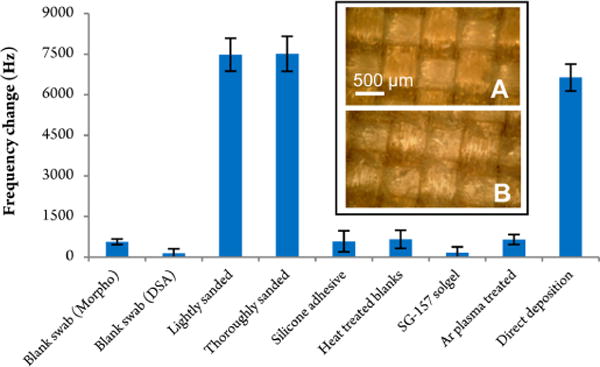
Harvesting efficiency experiments with modified sample swabs. The QCM responses, based on sampling 200 μg Tropine, are plotted on the ordinate. All measurements were carried out at a QCM detector temperature of 150 °C. Sample collection was based on controlled harvesting from a glass plate with the exception of the last sample “direct deposition”, which infers to the maximal harvesting efficiency possible. The inserts are optical magnifications of (A) the blank Teflon-coated sample swab and (B) lightly sanded swab modification.
By far the best harvesting efficiency results were obtained using the sample swabs with surface abrasion. In fact, within the experimental error margin (t test indicates that the two sets of data are not statistically different at the 95% confidence level), the measurements were equivalent to the direct deposition, which is the highest yield possible (i.e., equaling 100% collection efficiency). The untreated, blank sample swabs yielded less than 10% collection efficiency (assuming linear mass/frequency regression). The polymer-coated and Argon-treated sample carrier revealed little improvement to the harvesting efficiency compared to the untreated swabs. These experiments are in disagreement with Staymates’ findings although that study investigated the trace collection efficiency of explosives and utilized a different sample harvesting setup. However, the current study clearly shows that sample swab modifications based on polymer coatings are inferior to modifications based on mechanical surface abrasion. The inset of Figure 8 compares the surface morphology of the untreated and slightly sanded sample swab. The introduced surface roughness by disruption of the Teflon-coated fiberglass web is clearly visible and is believed to be responsible for the increased trace residue entanglement and harvesting efficiency. Future efforts will explore different surface substrates to examine if the harvesting efficiency improvement of abraded Teflon-coated sample swabs is consistently superior to standard untreated swabs. However, the benefits of higher trace collection efficiency are very promising and are also believed to be valid for other trace residues such as explosives.
CONCLUSION
This analytical instrumentation study demonstrated the use of a modified QCM sensor as the detector in a small-sized, portable gas chromatograph. The detector was operable at high temperature without water cooling for the analysis of solid contraband drug traces. The modification of the QCM crystal surface with a polymer/carbon nanomaterial bilayer increased the sensitivity of the QCM response by up to 3 orders of magnitude. This significant enhancement was attributed to the high surface area to volume ratio of the carbonaceous nanomaterials. The research demonstrated a novel use of a polymer composite-modified QCM as a chemical sensor at high temperatures.
The GC’s sample introduction occurred through thermal desorption of the controlled substances from sample swabs that are commercially available for trace detection instruments. Mechanical abrasion of the Teflon-coated fiberglass swabs further improved harvesting efficiency of the target analyte traces.
Supplementary Material
Acknowledgments
Research reported in this publication was supported by the National Institute on Drug Abuse of the National Institutes of Health under Award R44DA031530. The content is solely the responsibility of the authors and does not necessarily represent the official views of the National Institutes of Health. The authors thank Colnatec’s support in interfacing the QCM sensor to Seacoast’s gas chromatograph and many helpful discussions. Finally, this work would not have been possible without the assistance of many of Seacoast’s employees. The authors acknowledge Ms. Sabina Cemalovic for coating the QCMs, Dr. Stephen Hobson for synthesizing the sorbent materials, Dr. Bill Tolley for measuring the QCM frequencies, Mr. Venko Gyokov for preparing the GC’s control circuit board, and Ms. Janet Thieme for programming the GC interface software.
Footnotes
Supporting Information
Detailed experimental section and parameters used for the analytical measurements with the GC/QCM system. This material is available free of charge via the Internet at http://pubs.acs.org.
Author Contributions
All authors have given approval to the final version of the manuscript.
Notes
The authors declare no competing financial interest.
References
- 1.Vashist SK, Vashist P. J Sens. 2011 doi: 10.1155/2011/571405. Article ID 571405. [DOI] [Google Scholar]
- 2.Ballantine, D. S.; White, R. M.; Martin, S. I.; Ricco, A. J.; Zellers, E. T.; Frye, G. C.; Wohltjen, H. Academic Press: San Diego, 1997; pp 38.
- 3.Lucklum R, Hauptmann P. Sens Actuators B. 2000;70:30–36. [Google Scholar]
- 4.Akaike K, Koyama M. Frequency Control Symposium and Exposition; Proceedings of the 2004 IEEE International; Montreal, Quebec. Aug 23–27, 2004; [DOI] [Google Scholar]
- 5.Sauerbrey G. Z Phys. 1959;155:206–222. [Google Scholar]
- 6.Kikuchia M, Tsurua N, Shiratori S. Sci Technol Adv Mater. 2006;7:156–161. [Google Scholar]
- 7.Si P, Mortensen J, Komolov A, Denborg J, Møller P. J Anal Chim Acta. 2007;597:223–230. doi: 10.1016/j.aca.2007.06.050. [DOI] [PubMed] [Google Scholar]
- 8.Mirmohseni A, Hassanzadeh V. J Appl Polym Sci. 2001;79:1062–1066. [Google Scholar]
- 9.Mauter MS, Elimelch M. Environ Sci Technol. 2008;42:5843–5859. doi: 10.1021/es8006904. [DOI] [PubMed] [Google Scholar]
- 10.Trojanowicz M. TrAC, Trends Anal Chem. 2006;25:480–489. [Google Scholar]
- 11.Fan X, Du BY. Sens Actuators B. 2012;166:753–760. [Google Scholar]
- 12.Zhang Y, Yu K, Xu R, Jiang D, Luo L, Zhu Z. Sens Actuators A. 2005;120:142–146. [Google Scholar]
- 13.Wei BY, Lin CS, Lin HM. Sens Mater. 2003;15:177–190. [Google Scholar]
- 14.Pejcic B, Myers M, Ranwala N, Boyd L, Baker M, Ross A. Talanta. 2011;85:1648–1657. doi: 10.1016/j.talanta.2011.06.062. [DOI] [PubMed] [Google Scholar]
- 15.King WH. Anal Chem. 1964;36:1735. [Google Scholar]
- 16.Karasek FW, Gibbins KR. J Chromatogr Sci. 1971;9:535. [Google Scholar]
- 17.Rivai M, Purwanto D, Juwono H, Sujono HA. Telkomnika. 2011;9:319–326. [Google Scholar]
- 18.Rocha-Santos TA, Duarte AC, Oliveira JA. Talanta. 2001;54:383–388. doi: 10.1016/s0039-9140(00)00670-6. [DOI] [PubMed] [Google Scholar]
- 19.Kikuchi M, Shiratori S. Sens Actuators B. 2005;108:564–571. [Google Scholar]
- 20.Hobson ST, Zieba J, Prasad PN, Shea KJ. Mater Res Soc Symp Proc. 1999:561. doi: 10.1557/PROC-561-21. [DOI] [Google Scholar]
- 21.Patel SV, Hobson ST, Cemalovic S, Mlsna TE. J Sol-Gel Sci Technol. 2010;53:673–679. [Google Scholar]
- 22.Budd PM, Ghanem BS, Makhseed S, McKeown NB, Msayib KJ, Tattershall CE. Chem Commun. 2004;2:230–231. doi: 10.1039/b311764b. [DOI] [PubMed] [Google Scholar]
- 23.Tian F, Cerro AM, Mosier AM, Wayment-Steele HK, Shine RS, Park A, Webster ER, Johnson LE, Johal MS, Benz L. J Phys Chem C. 2014;118:14449–14456. [Google Scholar]
- 24.Demessence A, Boissiere C, Grosso D, Horcajada P, Serre C, Ferey G, Soler-Illia GJAA, Sanchez C. J Mater Chem. 2010;20:7676–7681. [Google Scholar]
- 25.Wanga D, Mousavib P, Hauserb PJ, Oxenhamc W, Grant CS. Colloids Surf, A. 2005:268. doi: 10.1016/j.colsurfa.2005.05.075. [DOI] [Google Scholar]
- 26.Rahtu A, Ritala M. Appl Phys Lett. 2001;80:521–523. [Google Scholar]
- 27.Seh H, Hyodo T, Tuller HL. Sens Actuators, B. 2005;108:547–552. [Google Scholar]
- 28.Rocklein MN, George SM. Anal Chem. 2003;75:4975–4982. [Google Scholar]
- 29.McKeown NB. ISRN Mater Sci. 2012 doi: 10.5402/2012/513986. Article ID 513986. [DOI] [Google Scholar]
- 30.Tian F, Cerro AM, Mosier AM, Wayment-Steele HK, Shine RS, Park A, Webster ER, Johnson LE, Johal MS, Benz L. J Phys Chem C. 2014;118:14449–14456. [Google Scholar]
- 31.Thess A, Lee R, Nikolaev P, Dai HJ, Petit P, Robert J, Xu CH, Lee YH, Kim SG, Rinzler AG, Colbert DT, Scuseria GE, Tomanek D, Fischer JE, Smalley RE. Science. 1996;273:483–487. doi: 10.1126/science.273.5274.483. [DOI] [PubMed] [Google Scholar]
- 32.Gao H, Jia X, Xiang R, Gong X, Welch CJ. Anal Methods. 2011;3:1828–1837. [Google Scholar]
- 33.Retrieved from ChemSpider.com.
- 34.Su PG, Sun YL, Lin CC. Sens Actuators, B. 2006;115:338–343. [Google Scholar]
- 35.Miller CJ, Cespedes ER. Sens Imaging. 2012;13:101–117. [Google Scholar]
- 36.Verkouteren JR, Coleman JL, Fletcher RA, Smith WJ, Klouda GA, Gillen G. Meas Sci Technol. 2008:19. doi: 10.1088/0957-0233/19/11/115101. [DOI] [Google Scholar]
- 37.Staymates JL, Grandner J, Gillen G. Anal Methods. 2011;3:2056–2060. [Google Scholar]
Associated Data
This section collects any data citations, data availability statements, or supplementary materials included in this article.


