

SUMMARY
The recent discovery of metabolic roles for fibroblast growth factor 1 (FGF1) in glucose homeostasis has expanded the functions of this classically known mitogen. To dissect the molecular basis for this functional pleiotropy, we engineered an FGF1 partial agonist carrying triple mutations (FGF1ΔHBS) that diminished its ability to induce heparan sulfate (HS)-assisted FGF receptor (FGFR) dimerization and activation. FGF1ΔHBS exhibited a severely reduced proliferative potential, while preserving the full metabolic activity of wild-type FGF1 in vitro and in vivo. Hence, suboptimal FGFR activation by a weak FGF1-FGFR dimer is sufficient to evoke a metabolic response, whereas full FGFR activation by stable and sustained dimerization is required to elicit a mitogenic response. In addition to providing a physical basis for the diverse activities of FGF1, our findings will impact ongoing drug discoveries targeting FGF1 and related FGFs for the treatment of a variety of human diseases.
eTOC
Huang et al., report that quantitative differences in FGF-FGFR dimer stability give rise to different thresholds of intracellular signals to determine mitogenic versus metabolic activities of FGFs.
INTRODUCTION
The mammalian FGF family comprises fifteen paracrine-acting and three endocrine-acting ligands that signal through four FGF receptor tyrosine kinases (FGFR1-4) and their alternatively spliced isoforms to govern a plethora of essential functions in mammalian development, metabolism and tissue homeostasis (Beenken and Mohammadi, 2009; Goetz and Mohammadi, 2013; Itoh and Ornitz, 2011). Paracrine FGFs require heparan sulfate (HS) glycosaminoglycans to bind, dimerize and activate their cognate FGFRs (Mohammadi et al., 2005; Olsen et al., 2006; Yeh et al., 2003). Owing to major structural distortions in their HS binding sites, however, the endocrine FGFs (FGF19, FGF21, and FGF23) interact poorly with HS and hence rely on Klotho coreceptors to bind, dimerize and activate their cognate FGFRs (Goetz et al., 2007; Goetz and Mohammadi, 2013; Kurosu et al., 2007; Ogawa et al., 2007; Urakawa et al., 2006). HS- or Klotho-dependent dimerization of extracellular domains of FGFR by paracrine or endocrine FGFs juxtaposes the cytoplasmic tyrosine kinase domains in correct orientation/proximity to facilitate activation loop (A-loop) tyrosine transphophorylation resulting in the activation of intracellular kinase domains (Mohammadi et al., 1996). This in turn leads to phosphorylation of intracellular substrates and activation of multiple downstream signaling pathways (Eswarakumar et al., 2005; Lemmon and Schlessinger, 2010; Schlessinger and Lemmon, 2003). Despite exerting pleiotropic functions, all FGFs rely on a common set of intracellular pathways including PLCγ/PKC, FRS2α/RAS-MAPK and Gab1/PI3 kinase/Akt and CrkL/Cdc42-Rac pathways (Dailey et al., 2005; Eswarakumar et al., 2005; Kouhara et al., 1997; Larsson et al., 1999; Seo et al., 2009). Hence, the underlying molecular mechanisms of signaling specificity and/or diversity have remained elusive.
To gain insights into the molecular mechanisms regulating FGF signaling specificity/diversity, in this report we analyzed the large body of accumulated structural data in our laboratory that includes eight binary paracrine FGF-FGFR complexes, an HS-assisted 2:2 FGF-FGFR dimer, and two endocrine FGFs (Beenken and Mohammadi, 2012; Goetz and Mohammadi, 2013). This analysis led us to posit a model whereby different biological responses of FGFs are manifestations of different thresholds in FGF-FGFR binding/dimerization, with corresponding differences in FGFR transphosphorylation and activation. We tested our working model using FGF1, the founding member of the FGF family that is best known for its mitogenic activity on cells from a variety of tissue origins including liver, vasculature, and skin (Kan et al., 1989; Nabel et al., 1993; Wiedlocha et al., 1996). Recently, Jonker and colleagues discovered an unexpected metabolic role for FGF1 as a critical transducer of PPARγ signaling that mediates the proper coupling of nutrient storage to adaptive remodeling of adipose tissue (Jonker et al., 2012). In a follow-up study, we showed that administration of exogenous FGF1 stimulates glucose uptake in an insulin-dependent fashion, much like the endocrine-acting non-mitogenic FGF21 (Suh et al., 2014). The mixed mitogenic and metabolic activities of FGF1 make this ligand an ideal paradigm for dissecting the role of FGF-FGFR dimer stability in differentiating mitogenic versus metabolic functions of FGFs. Based on our detailed structural insights into HS-assisted paracrine FGF-FGFR dimerization (Mohammadi et al., 2005; Schlessinger et al., 2000), an FGF1 variant, termed FGF1ΔHBS, with suppressed ability to induce HS-dependent FGFR dimerization was engineered. Detailed analysis of the mitogenic and metabolic properties of this FGF1 variant showed that it has greatly reduced proliferative potency and efficacy while retaining full metabolic efficacy of wild-type FGF1 (FGF1WT) both in vitro and in vivo. These data support our hypothesis that differences in FGF-FGFR binding affinity and dimer stability translate into differences in the magnitude of intracellular signals emanating from FGFRs to determine mitogenic versus metabolic cellular responses. Moreover, the results from this study pave the way for engineering safer FGF1 and other FGFs that solely possess metabolic activity.
RESULTS AND DISCUSSION
Structural analysis identifies a link between 1:1 FGF-FGFR binding affinity and 2:2 dimer stability and differential biological activity of FGFs
The existence of a relationship between the strength of FGF-FGFR binding/dimerization and the divergent biological activities of FGFs was first inferred from our structural exploration of the functional dichotomy of FGF8 isoforms. FGF8a and FGF8b are two alternatively spliced FGF8 isoforms that share an identical FGFR binding specificity profile; yet elicit markedly different tissue patterning outcomes during brain development (Joyner et al., 2000). Through solving the crystal structure of FGF8b in complex with FGFR2c, we previously traced the difference in the brain patterning activities of FGF8a and FGF8b to a difference in binding affinities of these FGF8 isoforms for FGFR (Olsen et al., 2006). Specifically a single residue (Phe-32) from the alternatively spliced N-terminus of FGF8b was shown to make hydrophobic contacts with D3 of FGFR, accounting for an order of magnitude greater receptor binding affinity of FGF8b compared to FGF8a (Olsen et al., 2006) (PDB ID: 2FDB) (Figure 1A). We then showed that mutation of Phe-32 to alanine converts FGF8b to an FGF8a-like molecule with regard to FGFR binding affinity and morphogenetic potential (Olsen et al., 2006).
Figure 1. The differences in the stabilization of 2:2 FGF-FGFR dimers induced by FGF8 isoforms.

(A) Cartoon representation of the crystal structure of the FGF8b-FGFR1c complex based on the crystal structure of the FGF8b-FGFR2c complex (PDB ID: 2FDB) (Olsen et al., 2006). (B) SEC-MALLS analysis of FGFR1c ectodomain dimerization by FGF8a, FGF8b or FGF8bF32A in the presence of HS dodecasaccharide. Each ligand was mixed with the FGFR1c ligand-binding domain and HS dodecasaccharide at a molar ratio of 1.2:1:1, and the mixtures were injected into a Superdex™ 200 10/300 gel filtration column and eluted with phosphate-buffered saline buffer (pH7.4). The 280 nm UV absorbance traces for the FGF8a-FGFR1c-HS, FGF8b-FGFR1c-HS, and FGF8bF32A-FGFR1c-HS complexes are colored green, red and blue, respectively. A second line below each protein complex peak denotes the peak area selected for molecular weight calculation. (C) Thermal stability of FGFR1c ectodomain in the presence of different ligands (FGF8a/FGF8b/FGF8bF32A) and HS dodecasaccharide. The FGFR1c stability was analyzed by a fluorescence-based thermal shift assay as described in ‘Materials and Methods’ section, in the absence (purple curve) or in the presence of 50 mM FGF8a/FGF8b/FGF8bF32A (green, blue and red curves, respectively). The melting temperature (Tm) was obtained from the first derivatives of the fluorescence signal from the melting curves of FGFR1c alone or in the presence of different ligands, calculated with StepOne software v2.2. (D) Immunoblots showing a dose-dependent activation of the MAPK pathway (ERK1/2) by FGF8a, FGF8b and FGF8bF32A in BaF3 cell line. Data are representative of three independent experiments. See also Figure S1.
Since 2:2 FGF-FGFR dimer stability is directly proportional to 1:1 FGF-FGFR binding affinity, these data suggest that FGF8b forms a more robust 2:2 FGF-FGFR dimer than FGF8a, which in turn implies that FGF8b is more potent in inducing FGFR transphosphorylation and activation than FGF8a. Moreover, since FGFR activation is a prerequisite for intracellular substrate phosphorylation and activation of downstream pathways, it follows that FGF8b should be transmitting robust/persistent signals, whereas intracellular signals of FGF8a should be weak and transient. These observations led us to postulate that differences in the abilities of FGF8a and FGF8b to bind, dimerize and activate FGFR1c translate into differences in the amplitudes of downstream signaling, that results in distinct biological responses. To test this hypothesis, we used size exclusion chromatography (SEC) coupled with multi-angle light scattering (MALS) (SEC-MALS) to compare the ability of FGF8a, FGF8b and the F32A mutant derivative of FGF8b (FGF8bF32A) to promote HS-assisted FGFR1c dimerization in vitro. As shown in Figure 1B, FGF8b exhibited a greater capacity than FGF8a to dimerize the FGFR1c. Mutation of Phe-32 to alanine converted FGF8b to an FGF8a-like molecule with regard to FGFR binding affinity (Figure S1A) and FGFR dimerization capacity (Figure 1B). We further compared the stability of FGF8a-FGFR1c, FGF8b-FGFR1c and FGF8bF32A-FGFR1c complexes in the absence and presence of HS by measuring their unfolding/melting temperatures (Tm) using a fluorescence dye-based thermal shift assay. Consistent with the higher affinity of FGF8b for FGFR1c measured in SEC-MALS experiments (Figure S1A), Tm of the FGF8b-FGFR1c complex was higher by 2.5 °C than those of the FGF8a-FGFR1c and FGF8bF32A-FGFR1c complexes without HS (Figure S1B). The higher affinity of FGF8b for FGFR1c also manifested in ~11.5 °C higher Tm of the FGF8b-FGFR1c-HS complex than those of FGF8a-FGFR1c-HS and the FGF8bF32A-FGFR1c-HS (Figure 1C). Having confirmed the greater stability of the FGF8b-FGFR1c-HS complex relative to the FGF8bF32A-FGFR1c-HS and FGF8a-FGFR1c-HS complexes, we next compared side-by-side the abilities of FGF8a, FGF8b and FGF8bF32A to bind, dimerize and activate FGFR1c isoform ectopically expressed on the surface of BaF3 cells. Treatment of cells with increasing doses of FGF8a, FGF8b and FGF8bF32A in the presence of HS showed that FGF8b is more potent than FGF8a in inducing phosphorylation of FGFR1c on the kinase A-loop tyrosines and downstream MAPK phosphorylation. Moreover, mutation of Phe-32 to alanine converted FGF8b to an FGF8a-like molecule with regard to activating the intracellular signaling pathway (Figure 1D).
Comparative structural analysis of the paracrine and endocrine FGFs further emphasizes the notion that differences in the strength of FGF-FGFR binding and dimerization could underlie the divergent biological activities of FGFs. Modeling of endocrine FGF-FGFR complexes based on the crystal structures of paracrine FGF-FGFR complexes as templates reveals replacements of at least one residue in the respective receptor binding site of endocrine FGFs with residues that are less optimal for receptor binding (Figure 2A&B). Consistent with these structural observations, binding of endocrine FGFs to FGFR is barely detectable in vitro (Ibrahimi et al., 2004; Kharitonenkov et al., 2005; Mohammadi et al., 2005; Yie et al., 2009). This structural analysis implies that compared to paracrine FGFs such as FGF1, endocrine FGFs should have weaker ability in dimerizing and activating FGFRs and correspondingly should have weaker capacity to activate intracellular signaling pathways. To test our structural prediction, the lentiviral expression system was used to establish two BaF3 cell lines that ectopically co-express FGFR1c (a cognate FGFR for all three endocrine FGFs) and the full length transmembrane form of αKlotho (coreceptor for FGF23) or βKlotho (coreceptor for FGF19 and FGF21). The side-by-side comparison of the abilities of two different concentrations of FGF1WT, wild-type FGF21 (FGF21WT), wild-type FGF19 (FGF19WT), and wild-type FGF23 (FGF23WT) clearly showed that at both doses tested all three endocrine FGFs were weaker than FGF1WT in inducing phosphorylation of FGFR1c on the kinase A-loop tyrosines and downstream MAPK phosphorylation (Figure 2C–2E). Importantly, compared to paracrine FGFs such as FGF1 that are potent mitogens for a variety of cell types, the endocrine FGFs completely lack (FGF21) or have poor mitogenic activity (FGF19) (Figure S2A), which is consistent with previously published data (Kharitonenkov et al., 2005; Nakamura et al., 2011; Ornitz et al., 1996; Suzuki et al., 2008; Zhang et al., 2006a). The higher mitogenic activity of FGF19 than FGF21 is congruent with the higher FGFR binding affinity of FGF19 relative to FGF21 (Wu et al., 2010b).
Figure 2. Poor receptor binding affinities of endocrine FGFs correlate with the poor signaling capacities of these ligands relative to paracrine FGFs.

(A) Model of FGF23 bound to FGFR1c generated by superimposing free FGF23 (PDB ID: 2P39) (Goetz et al., 2007)) onto FGF9 in the FGF9-FGFR1c complex (PDB ID 5W59) (Liu et al., Structure, in press, 2017). The FGF9-FGFR1c complex was chosen for generating the FGF23-FGFR1c model due to comparable receptor-binding specificity of FGF9 and FGF23. (Left panel) Whole view of the structural model and close-up view of contacts made between the FGF core region and FGFR1c-D3. Note that substitution of V102 of FGF9 with A80 in FGF23 will result in weakening of a hydrophobic contact with FGFR1c; (Right panel) Whole view of the structural model and close-up view of contacts made between the FGF9-N-terminus and FGFR1c-D3. Note that substitution of R62 a highly conserved residue among paracrine FGFs in FGF9,, with glycine (where it occurs in FGF23) will result in loss of contacts with FGFR1c. (B) Model of FGF19 bound to FGFR1c generated by superimposing free FGF19 (PDB ID: 2P23) (Goetz et al., 2007)) onto FGF9 in the FGF9-FGFR1c complex (PDB ID 5W59) (Liu et al., Structure, in press, 2017). The FGF9-FGFR1c complex was selected for generating the structural model because of the similarity in receptor-binding specificity of FGF9 and FGF19. Moreover, FGFR1c is known to mediate the effects of FGF19 and its close homologue FGF21 on glucose metabolism in adipocytes. (Left panel) Whole view of the structural model and close-up view of hydrophobic contacts made between I98 in the β4 strand of FGF9 and V316 in the βC’-βE loop of FGFR1c-D3. Note that substitution of I98 of FGF9 with lysine (present in FGF19) will result in loss of hydrophobic contacts with FGFR1c contributing to poor FGF19-FGFR1c binding; (Right panel) Whole view of the structural model and close-up view of contacts made between the β4–β5 loop and FGFR1c-D3. Note that substitution of G103 of FGF9 (a fully conserved residue among paracrine FGFs) with arginine (present in FGF19) introduces steric conflicts with the βF-βG loop in FGFR1-D3 as because of a clash between the molecular surfaces of R88 of FGF19 and S346 of FGFR1c. Moreover, this substitution also causes flipping of the peptide bond linking L87 and R88, which displaces the side chain of L87 away from L349 of FGFR1c, further weakening the FGF19-FGFR1c binding. (C–E) The side-by-side comparison of the abilities of two different concentrations of FGF1WT, FGF21WT, FGF19WT, and FGF23WT in inducing phosphorylation of FGFR1c on the kinase A-loop tyrosines and downstream MAPK phosphorylation. The lentiviral expression system was used to establish two BaF3 cell lines that ectopically co-express FGFR1c and the full length transmembrane form of αKlotho (coreceptor for FGF23) or βKlotho (coreceptor for FGF19 and FGF21). See also Figure S2.
Taken together, these data substantiate the existence of a direct link between the strength/stability of FGF-FGFR binding/dimerization and the selection of cellular outcome. Our results lead us to propose that while mitogenic activity would require strong FGF-FGFR binding and persistent dimerization, a metabolic response could be achieved with a weak FGF-FGFR binding and transient receptor dimerization.
The Metabolic Effect of FGF1 Can be Uncoupled from Its Mitogenic Activity
FGF1, a classical FGF mitogen, was recently shown to also possess metabolic activity similar to the non-mitogenic, endocrine FGF21 (Suh et al., 2014). The mixed mitogenic and metabolic activities of FGF1 make this ligand an ideal paradigm for directly testing our hypothesis on the role of FGF-FGFR dimer stability in determination of cellular outcome. We and others have previously shown that in the absence of HS, the affinities of paracrine FGFs for their cognate FGFR are below the threshold necessary to induce sustained receptor dimerization (Delehedde et al., 2002; Makarenkova et al., 2009; Mohammadi et al., 2005; Schlessinger et al., 2000). HS simultaneously engages the HS binding sites of FGF and FGFR simultaneously with a resulting enhancement of 1:1 FGF-FGFR binding and stabilization of 2:2 FGF-FGFR dimers (Mohammadi et al., 2005; Schlessinger et al., 2000). Guided by our structural insights on HS-assisted FGF-FGFR dimerization (Figure 3A), we decided to engineer an FGF1 variant with a diminished ability to promote HS-assisted FGFR dimerization. To this end, three key residues from the HS-binding site of FGF1 (namely Lys127, Lys128 and Lys133) were replaced with residues that are less optimal for HS binding (Lys127Asp, Lys128Gln and Lys133Val; termed FGF1ΔHBS) (Figure 3B). We postulated that as a result of compromised HS-binding affinity, FGF1ΔHBS should possess a weaker ability to promote HS-assisted FGFR dimerization and should therefore transmit weaker intracellular signals compared to the wild-type parent molecule.
Figure 3. The differences in the stabilization of 2:2 FGF-FGFR dimers and the cellular response induced by wild-type FGF1 and FGF1ΔHBS.

(A) Cartoon representation of the crystal structure of the FGF1-FGFR1c complex (PDB ID: 1EVT) (Plotnikov et al., 2000) with a modeled HS oligosaccharide (shown as sticks) based on the crystal structure of the FGF2-FGFR1c-HS complex (PDB ID: 1FQ9) (Schlessinger et al., 2000). FGF1 and FGFR1c are colored green and light blue, respectively, and the HS oligosaccharide is colored gray. The side chains of the three lysine residues of FGF1 that are predicted to make major contacts with HS are shown as sticks, and black dashed lines denote hydrogen bonds. (B) Schematic illustration of the designation of the FGF1 variant, termed FGF1ΔHBS. (C) Overlay of SPR sensor grams illustrating binding of FGF1WT (left panel) and FGF1ΔHBS (right panel) to heparin. Heparin was coupled to an SPR biosensor chip and increasing concentrations of FGF1WT or FGF1ΔHBS were passed over the chip. (D) SEC-MALS analysis of FGFR1c ectodomain dimerization by FGF1WT or FGF1ΔHBS in the presence of HS dodecasaccharide. FGF1WT or FGF1ΔHBS (MW=17.4 kDa) was mixed with the FGFR1c ligand-binding domain (MW=25.4 kDa) and HS dodecasaccharide (MW=3 kDa) at a molar ratio of 1:1:1, and the mixtures were injected into a Superdex™ 200 10/300 gel filtration column and eluted with phosphate-buffered saline buffer (pH7.4). The elution profile of a mixture of FGF1WT with the FGFR1c ligand-binding domain alone served as a control. The 280 nm UV absorbance traces for the FGF1WT-FGFR1c-HS and FGF1ΔHBS-FGFR1c-HS complexes are colored blue, red and green, respectively. A second line below each protein complex peak denotes the peak area selected for molecular weight calculation. (E) Thermal stability of FGF1WT-FGFR1c-HS (red curve) and FGF1ΔHBS-FGFR1c-HS (blue curve) complexes by measuring their unfolding temperatures (Tm) using a fluorescence dye-based thermal shift assay. (F) Dose-response for NIH 3T3 fibroblast proliferation to FGF1WT and FGF1ΔHBS, respectively. Data from three independent measurements are presented as mean +/− SEM. **p<0.01 vs PBS buffer control. (G) Immunoblots showing dose-dependent activation of FGFR1, FGFR substrate 2α (FRS2α), and MAPK pathway (ERK1/2) by FGF1WT and FGF1ΔHBS in NIH 3T3 fibroblasts. Right panel: Quantification of Western blot by densitometric analysis. Data from three independent measurements are presented as mean +/− SEM. ***p<0.001 vs vehicle control; ###p<0.001 vs FGF1WT. (H) Immunoblots showing time-dependent activation of FGFR, FGFR substrate 2α (FRS2α), and MAPK pathway (ERK1/2) by FGF1WT and FGF1ΔHBS (100 ng/mL) in NIH 3T3 fibroblasts. Right panel: Quantification of Western blot by densitometric analysis. Data from three independent measurements are presented as mean +/− SEM. ***p<0.05, ***p<0.001 vs FGF1ΔHBS. See also Figure S3.
To confirm our structural prediction, biotinylated heparin (a surrogate for HS) was captured onto a streptavidin containing surface plasmon resonance (SPR) biosensor chip, and increasing concentrations of FGF1WT and FGF1ΔHBS were passed over the chip. SPR spectroscopy data confirmed that the FGF1ΔHBS mutant sustained a substantial loss in HS binding affinity (Figure 3C). We next used SEC-MALS to compare the capacities of FGF1WT and FGF1ΔHBS to induce FGFR1c dimerization in the absence and in the presence of a HS decasaccharide (Figure 3D and Figure S3A). In the absence of HS, both FGF1WT and FGF1ΔHBS formed stable 1:1 complexes with FGFR1c with identical calculated MWs of 37.7 kDa (FGF1WT) and 37.2 kDa (FGF1ΔHBS), which were very close to the theoretical MW of 42.8 kDa (Figure S3A). As shown in Figure 3D, the HS decasaccharide caused stoichiometrical dimerization of the FGF1WT-FGFR1c complex. The MW of the dimeric species (89.19 kDa) measured by MALS matched closely with the theoretical MW for a 2:2:2 dimer (91.546 kDa). In contrast, in the presence of HS, the FGF1ΔHBS-FGFR1c complex eluted as a 64.75 kDa species, larger than a 1:1 complex but smaller than a 2:2 complex. These data indicate that compared to the 2:2:2 FGF1WT-FGFR1c-HS dimer, the FGF1ΔHBS-FGFR1c-HS dimer is less stable and interconverts between 2:2 and 1:1 complexes of FGF1ΔHBS-FGFR1c in the time scale of size exclusion chromatographic analysis. To further drive this point home, we compared the stability of FGF1WT-FGFR1c and FGF1ΔHBS-FGFR1c complexes in the presence and absence of HS by measuring their unfolding temperatures (Tm) using a fluorescence dye-based thermal shift assay (Figure 3E and Figure S3B). In agreement with the SEC-MALS data (Figure S3A), in the absence of HS, both FGF1WT-FGFR1c and FGF1ΔHBS-FGFR1c exhibited similar Tms. In the presence of HS, however, Tm of the FGF1ΔHBS-FGFR1c-HS was ~13 °C lower than that of FGF1WT-FGFR1c-HS. These data which are harmonious with the SEC-MALS data (Figure 3D) demonstrate the reduced stability of FGF1ΔHBS-FGFR1c-HS complex relative to the FGF1WT-FGFR1c-HS. Hence, this engineered FGF1ΔHBS variant constituted a tool for the exploration of the role of FGF1-FGFR dimer stability in the regulation of mitogenic and metabolic responses elicited by FGF1.
We next compared the mitogenic potencies of FGF1WT and FGF1ΔHBS using NIH 3T3 fibroblasts, which are known to endogenously express several FGFR isoforms including FGFR1c (Li et al., 1994). As shown in Figure 3F, relative to FGF1WT, FGF1ΔHBS sustained a major loss in mitogenic activity. Regardless of how high concentrations were used, FGF1ΔHBS was incapable of achieving the maximal response elicited by FGF1WT. A dose response comparison of FGF1WT and FGF1ΔHBS showed that FGF1ΔHBS is at least an order of magnitude weaker than FGF1WT in inducing A-loop tyrosine transphosphorylation of FGFRs (Figure 3G). In agreement with the receptor phosphorylation data, FGF1ΔHBS had a diminished ability to induce FRS2α phosphorylation, a major substrate of FGFRs on tyrosine 196, a Grb2-SOS recruitment site, and downstream ERK activation (Figure 3G).
We further compared the stability of cell surface FGF-FGFR dimers induced by FGF1WT and FGF1ΔHBS by analyzing the intensity and duration of FGFR phosphorylation on A-loop tyrosines and activation of downstream FRS2α/ERK pathway kinetically. As shown in Figure 3H, treatment of cells with FGF1WT led to the appearance of a signal for A-loop tyrosine phosphorylated FGFR as early as 2 minutes and the signal continued to intensify until 15 min. By 30 min the signal intensity diminished, but still remained above that observed in the vehicle-treated cells. In contrast, in FGF1ΔHBS-treated cells, a weak phosphorylation of FGFR1 was observed after only 5 min and the signal completely dissipated by 30 min. The signals for phosphorylated FRS2a and ERK followed the same time dependency trend as that of the FGFR A-loop phosphorylation. Combined with the HPLC-MALS and fluorescence dye-based thermal shift data, these cell-based experiments show that FGF1WT is capable of promoting stable and long-lived FGFR dimerization and correspondingly generating robust and persistent intracellular signaling. By contrast, FGF1ΔHBS can only induce weak FGFR activation and trigger short-lived downstream intracellular signaling.
Having determined that FGF1ΔHBS is less mitogenic than FGF1WT, we next compared side-by-side the metabolic activities of FGF1WT and FGF1ΔHBS in rat hepatoma cell line (H4IIE) and the differentiated 3T3L1 adipocytes. H4IIE endogenously express several FGFR isoforms including FGFR1c, and FGFR4, HSPGs and βKlotho (Li et al., 1994), the obligatory coreceptor for FGF19 and FGF21. 3T3L1 preadipocytes express FGFR1c, the cognate receptor of endocrine FGFs but lack βKlotho. However, upon differentiation to adipocytes they also express βKlotho and thus become responsive to FGF19 and FGF21. Therefore, we also included FGF21WT, and FGF19WT as controls in this assay. As shown in Figure 4A&B, despite its major loss in mitogenic activity, FGF1ΔHBS retained the full capacity of FGF1WT to stimulate glucose uptake in both H4IIE and 3T3L1 adipocytes. Remarkably, the metabolic activity of FGF1ΔHBS was similar to those of endocrine FGFs (Figure 4A&B). We also compared the abilities of FGF1WT, FGF1ΔHBS, FGF21WT, and FGF19WT to induce phosphorylation of FRS2α/ERK pathway. Consistent with the results obtained using transfected BaF3 cells (Figure 2), in both H4IIE and 3T3L1 adipocyte cell lines, FGF1ΔHBS exhibited a significant loss in the ability to induce phosphorylation of FGFR on A-loop tyrosines, with activation of the FRS2α-RAS-MAPK pathway essentially behaving more like an FGF19 and FGF21 molecule (Figure 4C&D). Apparently the amplitude/strength of FGFR activation and ensuing downstream intracellular signaling generated by FGF1ΔHBS, which is comparable to that induced by the endocrine FGFs, is below the threshold necessary for a mitogenic signal but still sufficient for a metabolic response to occur. These in vitro data corroborate our model that differences in FGF-FGFR binding affinity and dimer stability translate into differences in the magnitude of intracellular signals emanating from FGFRs to determine cellular responses. Specifically, a metabolic response can be achieved with transient receptor dimerization and partial receptor activation, whereas mitogenic activity requires persistent FGFR dimerization and full activation.
Figure 4. The side-by-side comparison of the metabolic activities of FGF1WT, FGF1ΔHBS in H4IIE and the differentiated 3T3L1 adipocyte cell lines.

(A&B) Cellular glucose uptake in response to stimulation of rat hepatoma H4IIE cells by FGF1WT, FGF1ΔHBS, FGF19WT and FGF21WT (A) and stimulation of differentiated 3T3-L1 adipocytes by FGF1WT, FGF1ΔHBS and FGF21WT (B). Data from three independent measurements are presented as mean +/− SEM. (C) Immunoblots showing the dose-dependent activation of FGFR, FGFR substrate 2α (FRS2α), and MAPK pathway (ERK1/2) by FGF1WT, FGF1ΔHBS, FGF19WT and FGF21WT in the rat hepatoma cell line H4IIE. (D) Immunoblots showing a dose-dependent activation of FGFR, FGFR substrate 2α (FRS2α), and the MAPK pathway (ERK1/2) by FGF1WT, FGF1ΔHBS and FGF21WT in differentiated 3T3-L1 adipocytes. Data in panels C and D are representative of three independent experiments.
Comparison of the Mitogenic and Hyperplastic Activity of FGF1WT with FGF1ΔHBS in Normal Mice
To corroborate our in vitro findings, we assessed the mitogenic activity of FGF1WT and FGF1ΔHBS in vivo. To this end, normal C57BL/6J mice were injected either intraperitoneally (0.5 mg/kg body weight for 3 months) or intravenously (2.0 mg/kg body weight for one month) with FGF1WT and FGF1ΔHBS every other day, and the mice livers were analyzed for signs of hyperplasia by immunohistochemical staining using PCNA and Ki67 and Western blotting. Irrespective of the routes of administration, FGF1WT caused a clear increase in the number of hyperproliferating cells in the liver of mice. In contrast, there was no increase in the number of hyperproliferating cells in the livers of FGF1ΔHBS-treated mice over that of the PBS-treated control (Figure 5A–5F). Alongside the in vivo experiment, we also compared the abilities of FGF1WT and FGF1ΔHBS to induce activation of FGFRs in primary liver cells by measuring the levels of induction of the FRS2α/ERK pathway. The data showed that FGF1ΔHBS exhibited a significant loss in the ability to induce FRS2α and ERK phosphorylation (Figure 5G&H).
Figure 5. Mitogenic activity of FGF1WT and FGF1ΔHBS on liver tissue in vivo.

(A&D) Microscopic images of mouse liver tissue sections stained for proliferating cell nuclear antigen (PCNA) and Ki67. Liver tissue was isolated from normal C57BL/6J mice intraperitoneally treated with FGF1WT or FGF1ΔHBS (0.5 mg/kg body weight) every other day for 3 months (A) and from normal C57BL/6J mice intravenously treated with FGF1WT or FGF1ΔHBS (2.0 mg/kg body weight) every other day for 1 month (D), respectively. Note the increased number of PCNA- and Ki67-positive cell nuclei in liver tissue from FGF1WT-treated mice compared with liver tissue from FGF1ΔHBS-treated mice. Data are representative of 11 mice from each group. Scale bar, 50 µm. (B&C) Immunoblot analysis (B) and its corresponding densitometric analysis (C) for PCNA and Ki67 protein expression in liver tissues from mice intraperitoneally treated with 0.5 mg/kg body weight FGF1WT or FGF1ΔHBS every other day for 3 months. (E&F) Immunoblot analysis (E) and its corresponding densitometric analysis (F) for PCNA and Ki67 protein expression in liver tissues from mice intravenously treated with 2.0 mg/kg body weight FGF1WT or FGF1ΔHBS every other day for 1 month. Data in panels B, C, E, F are presented as mean +/− SEM (n=11). *p<0.05, ***p<0.001 vs vehicle control; ##p<0.01, ###p<0.001 vs FGF1WT. (G&H) Immunoblots showing the activation of FRS2α/ERK pathway induced by FGF1WT and FGF1ΔHBS in primary liver cell line. (H) Quantification of western blot (G) by densitometric analysis. Data from three independent measurements are presented as mean +/− SEM. ***p<0.001 vs PBS buffer control; ##p<0.01, ###p<0.001 vs FGF1WT. See also Figure S2.
Effects of FGF1WT and FGF1ΔHBS on Blood Glucose Levels and Insulin Sensitivity in db/db Mice
We next compared the metabolic activities of FGF1WT and FGF1ΔHBS in a diabetic mouse model (db/db). An acute injection of FGF1WT and FGF1ΔHBS (0.5 mg/kg body weight) significantly lowered blood glucose levels, with effects lasting up to 24 hours post-injection (Figure 6A). Moreover, this effect was dose-dependent in both FGF1WT and FGF1ΔHBS treatment groups (Figure 6B), consistent with previously published data (Suh et al., 2014). The blood glucose levels of db/db mice acutely treated with FGF1WT or FGF1ΔHBS remained lower throughout the glucose tolerance test (GTT) (Figure 6C&D). Furthermore, mice treated with either FGF1WT or FGF1ΔHBS showed a marked improvement in insulin sensitivity as measured by an insulin tolerance test (ITT) (Figure 6E&F).
Figure 6. Effects of FGF1WT and FGF1ΔHBS on blood glucose and insulin sensitivity in db/db mice.

(A) 24-h effect of a single IP injection of FGF1WT or FGF1ΔHBS on blood glucose levels in db/db mice. 0.5 mg/kg body weight of FGF1 protein was injected. Blood glucose levels in db/m mice, the littermates of db/db mice, served as a control. Data are presented as mean +/− SEM (n=12). ***p<0.001 vs db/m; ##p<0.01 vs db/db. (B) Dose-dependence for blood glucose lowering effects of FGF1WT and FGF1ΔHBS in db/db mice. Each dose was given in one IP injection. Data are presented as mean +/− SEM (n=12). (C&D) Glucose tolerance test (GTT) performed 6 h after a single IP injection of FGF1WT and FGF1ΔHBS, respectively, to db/db mice (0.5 mg/kg body weight). Blood glucose levels (C) and integrated area under the curve (AUC) (D) for changes in blood glucose levels. Data are presented as mean +/− SEM (n=6). ***p<0.001 vs db/m; #p<0.05, #p<0.01 vs db/db. (E&F) Insulin tolerance test (ITT) performed 6 h after a single IP injection of FGF1WT and FGF1ΔHBS, respectively, to db/db mice (0.5 mg/kg body weight). Blood glucose levels (E) and AUC (F) for changes in blood glucose levels. Data are presented as mean +/− SEM (n=12). *p<0.05 vs db/m; #p<0.05 vs db/db. (G&H) Fed-state blood glucose levels and body weight over the course of a 28-day treatment of db/db mice with FGF1WT or FGF1ΔHBS (0.5 mg/kg body weight). Data are presented as mean +/− SEM (n=11). ***p<0.001 vs db/m; ###p<0.001 vs db/db. See also Figure S4 and S5.
We next studied the effects of chronic administration of FGF1WT and FGF1ΔHBS by injecting db/db mice with 0.5 mg/kg every other day for 4 weeks. As recently shown for FGF1WT (Suh et al., 2014), FGF1ΔHBS caused sustained glucose lowering (Figure 6G) with minimal changes in body weight (Figure 6H). Notably, both FGF1WT and FGF1ΔHBS were able to normalize blood glucose levels in db/db mice after 4 weeks of treatment (Figure 6G). Importantly, as previously shown for FGF1WT (Suh et al., 2014), FGF1ΔHBS did not induce hypoglycemia in both normoglycemic (healthy) chow-fed mice (Figure S4A) and diabetic mice even at a high dose (Figure S4B&C). FGF1ΔHBS had no effect on blood glucose levels in streptozotocin (STZ)-induced type 1 diabetic mice demonstrating that FGF1ΔHBS mediates its glucose-lowering effects in an insulin-dependent fashion (Figure S4D).
Chronic Effects of FGF1WT and FGF1ΔHBS on Hepatic Lipid and Glucose Metabolism in db/db Mice
We also analyzed the effects of FGF1WT and FGF1ΔHBS on hepatic lipid and glucose metabolism. As expected, db/db mice had markedly enhanced hepatic steatosis as evident by hematoxylin and Oil Red O staining (Figure S5A). Chronic treatment of db/db mice with FGF1WT and FGF1ΔHBS showed that both ligands are capable of attenuating this hepatic steatosis (Figure S5A). Consistent with our histological findings, chronic FGF1WT and FGF1ΔHBS treatment also significantly reduced hepatic levels of triglycerides in the livers of db/db mice (Figure S5B). Notably, these values approached those of lean, PBS-treated littermates (db/m) (Figure S5B). The decreased lipid accumulation in hepatic tissues implies a decrease in lipogenesis (lipid synthesis) and lipid storage in both FGF1WT and FGF1ΔHBS variant treatment groups. This was confirmed by the finding of lateral reduction in multiple lipogenic gene expression at both protein (Figure S5D–S5G) and mRNA (Figure S5H–S5J) levels in hepatic tissues.
Hepatic glycogen synthesis and breakdown play an important role in modulating blood glucose levels (Saltiel and Kahn, 2001). Accordingly, the effect of chronic treatment of FGF1WT and FGF1ΔHBS on hepatic glycogen levels was determined using periodic acid-Schiff staining (PAS) and a colorimetric assay. As shown in Figure S5A&C, compared to their lean littermates (db/m), db/db mice had elevated hepatic glycogen levels, which was consistent with a previous report (Zhang et al., 2006b). In addition, hepatic glycogen levels were further increased following treatment of db/db mice with FGF1WT and FGF1ΔHBS (Figure S5A&C). These observations demonstrate that chronic treatment of db/db mice with FGF1WT and FGF1ΔHBS lowers glucose levels by increasing insulin sensitivity to thereby manifest in elevated hepatic glycogen synthesis and storage.
Concluding Remarks
In conclusion, we show that the mitogenic and the metabolic activity of FGF1 can be uncoupled by surgically dampening FGF1-FGFR dimer stability through triple point mutations that diminish FGF1-HS affinity. The FGF1ΔHBS sustained a loss in the ability to promote HS-dependent FGFR dimerization to a level that practically eliminated its mitogenic activity without compromising its metabolic function. To begin to gain insights into the impacts of FGF1-FGFR dimer stability on the choice of downstream intracellular pathways, we performed SILAC-based phosphoproteomics on 3T3L1 fibroblasts (a pre-adipocyte cell line) that were stimulated with FGF1WT or FGF1ΔHBS. Analysis of the phosphorylation of FGFR, its direct intracellular substrates and further downstream molecules reveals a quantitative change in overall net phosphorylation and activation of FGFR and correspondingly weaker phosphorylation of downstream effector proteins between FGF1WT- and FGF1ΔHBS-treated cells (Figure S6). These findings support the concept that different thresholds of receptor dimerization translate into different degrees of FGFR activation and downstream “signal flow” which in turn manifest in different cellular outcomes (i.e. mitogenesis versus metabolism) (Figure 7). The threshold model is further corroborated by a side-by-side comparison of the dimerization ability and mitogenic versus metabolic potentials of FGF1WT, FGF1ΔNT1, FGF1ΔHBS, and FGF1ΔNT2. As shown in Figure S7, these four FGF1 molecule show a gradient of dimerization capacity in the following order: FGF1WT>FGF1ΔNT1>FGF1ΔHBS> FGF1ΔNT2. Consistent with our threshold model, as the dimerization strength decreases, the mitogenic potential dissipates first before a decrease in metabolic response can be observed. This trend between dimerization strength and the ensuing signaling outcome of FGF1 molecules further validates our “threshold” model (Figure 7).
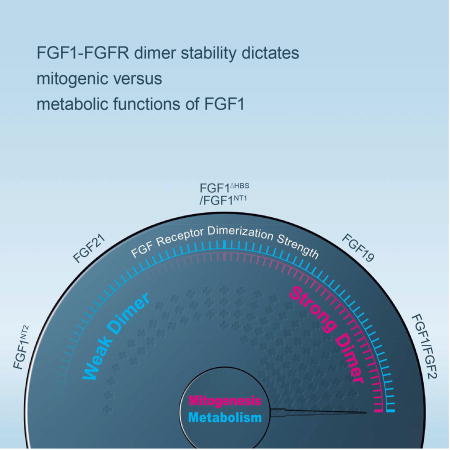
Figure 7. Schematic representation of the “threshold” model.

The quantitative differences in the strength of FGF-FGFR binding and stability of dimerization underlie the proliferative and metabolic activities of the FGF ligands. The top panel shows the correlation between the FGF-FGFR dimerization strength and the corresponding strengths of the intracellular signal. FGF1 and FGF2 have strong capacity to bind and dimerize FGFR1c and result in a strong intracellular signaling. FGF19, FGF1ΔNT1, FGF1ΔHBS, FG0F21, and FGF1ΔNT2 have a gradually weaker intracellular signal due to weaker dimerization strengths. FGF1ΔNT2 has almost no ability to bind/dimerize FGFR1c and hence produces no significant intracellular signaling. Lower panel shows the threshold of FGFR dimerization strength that determines the nature of signaling response. Sustained FGF-FGFR binding and dimerization is necessary to elicit strong intracellular signaling required to produce a mitogenic response (red trace) and weak FGF-FGFR binding and dimerization by a weak agonist leads to dampened intracellular signaling that is sufficient for a metabolic response (blue trace). See also Figure S6 and S7.
Like FGF1, FGF19 also possesses “mixed” metabolic and ‘mitogenic’ activities although mitogenic activity of FGF19 is inferior to that of FGF1 (Figure S2). In an effort to eliminate the undesired mitogenic effect of FGF19, Li and coworkers at Amgen previously engineered a nonmitogenic FGF19 chimera wherein four residues from N-terminus of FGF19 were replaced with the corresponding three residues from FGF21 (Wu et al., 2010a). This chimera was however shown to retain wild-type FGF19-like capacity to modulate glucose and bile acid metabolisms. The selective loss in mitogenic activity was attributed to a selective loss in binding of the chimera to FGFR4 that was proposed to mediate the mitogenic activity of FGF19. By contrast, the chimera retained the ability to bind FGFR1c, which was proposed to mediate metabolic actions of FGF19. However, based on our structural analysis, these N-terminal alterations would reduce interactions of FGF19 with both FGFR1c and FGFR4 such that reduced affinity and correspondingly reduced dimerization ability of this chimera underlies the non-mitogenic character of the chimera. Reminiscent of our results, Swanson et al., 2015 recently reported a therapeutic lectin that retains its full antiviral activity but is devoid of the undesired mitogenic activity (Swanson et al., 2015). An engineered point mutation diminishes the glycan binding affinity of this lectin variant below the threshold necessary for formation of multivalent lectin-glycoprotein complexes that give rise to mitogenesis. However, the remaining glycan binding affinity of the variant was still sufficient to allow the mutated lectin to bind to viral glycan chains and hence exert antiviral effects. Hence it appears that pleiotropic functions of other classes of proteins may also be manifestations of quantitative differences in the binding interactions with cognate binding partners. Full proof of this concept should open up distinctive horizons in engineering a repertoire of biologics with unique properties for use in both basic and translational research.
EXPERIMENTAL PROCEDURES
Protein Expression and Purification
All the wild-type and mutated FGF1 (FGF1WT, FGF1ΔHBS, FGF1ΔNT1 and FGF1ΔNT2), wild-type FGF8b and its mutation (FGF8bF32A) and wild-type FGF8a were expressed in E. coli (BL21) and purified as described in Supplemental Experimental Procedures.
SPR Spectroscopy
Real-time biomolecular FGF1-heparin interactions were analyzed with a BIAcore 2000 system (GE Healthcare, Piscataway, NJ) in HBS-EP buffer (10 mM Hepes-NaOH, pH 7.4, 150 mM NaCl, 3 mM EDTA and 0.005% (v/v) polysorbate 20) at 25 °C. A heparin chip was prepared by immobilizing biotinylated heparin (Sigma-Aldrich, St. Louis, MO) on flow channels of a research grade streptavidin chip (GE Healthcare, Piscataway, NJ). The control flow channel was left blank. Increasing concentrations of FGF1WT or FGF1ΔHBS were injected over the chip. The heparin chip surface was regenerated by injecting 50 µL/min of 2.0 M NaCl in 10mM sodium acetate, pH 4.5. The data were processed with BiaEvaluation software and the equilibrium dissociation constants (KD) were calculated from fitted saturation binding curves.
HPLC-MALS Analysis
An inline HPLC (Waters 1500 pump with 2498 UV detector and 2707 autosampler)-MALS (Wyatt miniDawn-Treos and Optilab rEX) system was used to study complex assembly of FGF1 and FGF8 variants with the ligand-binding domain of FGFR1c. A Superdex™ 200 10/300 GL SEC column (GE Healthcare, Piscataway, NJ) was equilibrated and run at a flow rate of 0.25 mL/min for 5 column volumes of 2×PBS. Each experiment contained 60 µM of each individual component (ligand, receptor with or without decasaccharide (Dp10, Iduron)) before being brought up to the final injection volume of 50 µL with 2×PBS. Light scattering and refractive index data was manually aligned to the UV spectra in the ASTRA software.
Fluorescence dye-based thermal shift assay
Thermal stability assays were performed with the SYPRO Orange dye as a fluorescent probe (diluted 200-fold from a 5000-fold stock solution, Bio-Rad). 50 µM FGFR1c in 25 mM HEPES pH 7.5, 150 mM NaCl with and without different ligands were made in duplicate in PCR strips at a final volume of 20 µL. The temperature gradient was carried out in the range of 4–95 °C at 1 °C /min with a real-time PCR system (Bio-Rad). Fluorescence was recorded as a function of temperature in real time. The melting temperature (Tm) was calculated with StepOne software v2.2 as the maximum of the derivative of the resulting SYPRO Orange fluorescence curves.
BaF3 cell line establishment and stimulation
The murine pro-B BaF3 cell lines overexpressing FGFR1c wild type was generated as described in Supplemental Experimental Procedures. The cells were starved for 5 hours in FBS/IL-3 free RPMI 1640 medium followed by 10 min stimulation with FGF8a, FGF8b, or FGF8bF32A, respectively. Heparin was added to the cell culture medium to a final concentration of 5 µg/mL before stimulating the cells with the FGF ligands. BaF3 cell lines coexpressing FGFR1c and αKlotho or FGFR1c and βKlotho were established by infecting BaF3-FGFR1c cell line with lentivirus containing αklotho or βklotho gene. After infection, the cell lines were selected in medium containing both neomycin and hygromycin for 10 days to get stably infected cells. The stimulation was done as described above with FGF21, FGF23 or FGF19 as ligands.
Cell Culture, Adipocyte Differentiation, Glucose Uptake
3T3-L1 preadipocytes, NIH 3T3 cells and rat hepatoma cell H4IIE (American Type Culture Collection, Manassas, VA) were cultured as described previously (Kharitonenkov et al., 2005; Kurosu et al., 2007). Full details are described in Supplemental Experimental Procedures.
Mitogenicity Assay
For mitogenicity assay in vitro, NIH 3T3 cells and rat hepatoma cell H4IIE were grown to reach the mid-logarithm time and transferred to a 96-well plate (5×10³/well), starved for 24h in DMEM without FBS, stimulated with indicated concentration of FGF ligands for 48 h. Next, the number of viable cells was determined by a Cell Growth Determination Kit (MTT based) from Sigma-Aldrich (St. Louis, MO, USA).
For mitogenicity assay in vivo, male C57BL/6J mice (2 months old) were treated with vehicle (PBS), FGF1WT or FGF1ΔHBS (0.5mg/kg or 2.0 mg/kg body weight) every other day. After the indicated time (0.5 mg/kg, 3 month; 2.0 mg/kg, 1 month) of treatment, the mice were sacrificed and the liver tissues were collected for immunohistochemical staining and Western blot assay of hepatic proliferation.
In vivo Protocol
All experimental animals were from the Model Animal Research Center of Nanjing University, China or Jackson Laboratory (Bar Harbor, Maine), and the protocols used in these studies were approved by the Animal Care and Use Committee of Wenzhou Medical University, China or the University of Louisville, USA. The full details of animal feeding, grouping and administration were described in Supplemental Experimental Procedures.
Western Blot Analysis
The above cultured 3T3-L1 adipocytes, NIH-3T3 cells or H4IIE were starved for 12 h, stimulated with different dose of FGF1WT and FGF1ΔHBS for 20 min, and then lysed for future use. The liver and adipose tissues of the male db/db and db/m mice were collected and lysed after 28-day treatment with or without FGF1WT and FGF1ΔHBS. Forty micrograms of lysate proteins from 3T3-L1 adipocytes, NIH 3T3, H4IIE cells or liver tissues were separated using 8–12% SDS-PAGE and electrotransferred onto a nitrocellulose membrane. The details of protein blots are described in Supplemental Experimental Procedures.
RNA Extraction, cDNA Synthesis and Quantitative RT-PCR
Total RNA was extracted from Liver and adipose tissues with TRIzol reagent (Invitrogen, Carlsbad, CA). The details of cDNA synthesis and quantitative RT-PCR are described in Supplemental Experimental Procedures.
Tissue Preparation, Histopathological Evaluation, Immunohistochemistry
Tissues were fixed overnight in 4 % paraformaldehyde and embedded in paraffin. After deparaffinization and rehydration, the paraffin sections (5µm) were subjected to haematoxylin and eosin (H&E) or immunohistochemical staining. For immunocytochemical staining, paraffin sections were stained with primary antibodies [rabbit polyclonal to PCNA (1:1000), rabbit polyclonal to Ki67 (1:500), from Abcam overnight at 4 °C. After washing, sections were incubated with horseradish peroxidase conjugated secondary antibody against rabbit and developed with DAB (3,3-Diaminobenzidine) developing system (Vector Laboratories, Inc., CA), counterstained with hematoxylin and observed under light microscopy.
Metabolite Analysis
Hepatic lipid accumulation was evaluated by Oil Red O staining in accordance with the standard procedure; triglyceride content in liver was measured using commercial kit (Cayman Chemicals, Ann Arbor, MI) following the manufacturer’s instructions. Glycogen in liver was evaluated by periodic acid–Schiff staining and a Glycogen Assay kit (Abcam) in accordance with the standard procedure or the manufacturer’s instructions respectively.
Phosphopeptide quantitation using SILAC
The details of HILIC fractionation preparation, liquid chromatography-mass spectrometry (LC-MS) and protein identification and quantitation are described in Supplemental Experimental Procedures.
Statistical Analysis
The in vitro experiments were performed three times with triplicate samples for each individual experiment. Data obtained from the animal study were obtained from five mice or six rats. All data were expressed as the mean ± SEM and subjected to statistical analysis by one-way or two-way ANOVA and Student t-test using statistical software NASDAQ: SPSS from SPSS Inc. Furthermore, p<0.05 was considered statistically significant.
Supplementary Material
HIGHLIGHTS.
FGF1-FGFR dimer stability dictates mitogenic versus metabolic functions of FGF1
Proliferative response requires robust and long-lived FGF1-FGFR dimerization
Weak and transient FGF1-FGFR dimerization is sufficient for a metabolic response
Acknowledgments
This work was supported by the U.S. National Institutes of Health NIDCR Grant DE13686 (to M.M.) and NINDS grant P30 NS050276 and S10 RR027990 (to T.A.N.), Grants from Natural Science Foundation of China 81102486, 81273509 (to Z.H. and Y.T.) and Natural Science Foundation of Zhejiang LQ15H310005 (to L.S), Key Project from Science Technology Department of Zhejiang Province (2017C03030) (to Z.H.), Science grant of Wenzhou Department of Science and Technology (Y20140734) (to L.S), Grants from American Diabetes Association and Juvenile Diabetes Research Foundation 1-13-JF-53, 1-15-BS-018 and 1-INO-2014-122-A-N (to Y.T. and L.C.).
Footnotes
Publisher's Disclaimer: This is a PDF file of an unedited manuscript that has been accepted for publication. As a service to our customers we are providing this early version of the manuscript. The manuscript will undergo copyediting, typesetting, and review of the resulting proof before it is published in its final citable form. Please note that during the production process errors may be discovered which could affect the content, and all legal disclaimers that apply to the journal pertain.
AUTHOR CONTRIBUTIONS
The overall hypothesis of this work was conceived and formulated by M.M., and Z.H. Z.H., Y.T., D.C., T.A.N., X.L., and M.M. participated in the experimental design of the project and interpretation of the data. Z.H., Y.T., J.G., Y.L., J.N., L.Z., Q.L., J.D., and Y.L. generated the data. Z.H., L.S., and M.M. wrote the manuscript. As the joint corresponding authors, X.L. and M.M. had full access to all the data in the study and take full responsibility for the integrity of the data and the accuracy of the data analysis. The authors are thankful to Dr. Jennifer Weiszmann for technical assistance.
References
- Beenken A, Mohammadi M. The FGF family: biology, pathophysiology and therapy. Nat Rev Drug Discov. 2009;8:235–253. doi: 10.1038/nrd2792. [DOI] [PMC free article] [PubMed] [Google Scholar]
- Beenken A, Mohammadi M. The structural biology of the FGF19 subfamily. Adv Exp Med Biol. 2012;728:1–24. doi: 10.1007/978-1-4614-0887-1_1. [DOI] [PMC free article] [PubMed] [Google Scholar]
- Dailey L, Ambrosetti D, Mansukhani A, Basilico C. Mechanisms underlying differential responses to FGF signaling. Cytokine Growth Factor Rev. 2005;16:233–247. doi: 10.1016/j.cytogfr.2005.01.007. [DOI] [PubMed] [Google Scholar]
- Delehedde M, Lyon M, Gallagher JT, Rudland PS, Fernig DG. Fibroblast growth factor-2 binds to small heparin-derived oligosaccharides and stimulates a sustained phosphorylation of p42/44 mitogen-activated protein kinase and proliferation of rat mammary fibroblasts. Biochem J. 2002;366:235–244. doi: 10.1042/BJ20011718. [DOI] [PMC free article] [PubMed] [Google Scholar]
- Eswarakumar VP, Lax I, Schlessinger J. Cellular signaling by fibroblast growth factor receptors. Cytokine Growth Factor Rev. 2005;16:139–149. doi: 10.1016/j.cytogfr.2005.01.001. [DOI] [PubMed] [Google Scholar]
- Goetz R, Beenken A, Ibrahimi OA, Kalinina J, Olsen SK, Eliseenkova AV, Xu C, Neubert TA, Zhang F, Linhardt RJ, et al. Molecular insights into the klotho-dependent, endocrine mode of action of fibroblast growth factor 19 subfamily members. Mol Cell Biol. 2007;27:3417–3428. doi: 10.1128/MCB.02249-06. [DOI] [PMC free article] [PubMed] [Google Scholar]
- Goetz R, Mohammadi M. Exploring mechanisms of FGF signalling through the lens of structural biology. Nat Rev Mol Cell Biol. 2013;14:166–180. doi: 10.1038/nrm3528. [DOI] [PMC free article] [PubMed] [Google Scholar]
- Ibrahimi OA, Zhang F, Eliseenkova AV, Itoh N, Linhardt RJ, Mohammadi M. Biochemical analysis of pathogenic ligand-dependent FGFR2 mutations suggests distinct pathophysiological mechanisms for craniofacial and limb abnormalities. Hum Mol Genet. 2004;13:2313–2324. doi: 10.1093/hmg/ddh235. [DOI] [PMC free article] [PubMed] [Google Scholar]
- Itoh N, Ornitz DM. Fibroblast growth factors: from molecular evolution to roles in development, metabolism and disease. J Biochem. 2011;149:121–130. doi: 10.1093/jb/mvq121. [DOI] [PMC free article] [PubMed] [Google Scholar]
- Jonker JW, Suh JM, Atkins AR, Ahmadian M, Li P, Whyte J, He M, Juguilon H, Yin YQ, Phillips CT, et al. A PPARgamma-FGF1 axis is required for adaptive adipose remodelling and metabolic homeostasis. Nature. 2012;485:391–394. doi: 10.1038/nature10998. [DOI] [PMC free article] [PubMed] [Google Scholar]
- Joyner AL, Liu A, Millet S. Otx2, Gbx2 and Fgf8 interact to position and maintain a mid-hindbrain organizer. Curr Opin Cell Biol. 2000;12:736–741. doi: 10.1016/s0955-0674(00)00161-7. [DOI] [PubMed] [Google Scholar]
- Kan M, Huang JS, Mansson PE, Yasumitsu H, Carr B, McKeehan WL. Heparin-binding growth factor type 1 (acidic fibroblast growth factor): a potential biphasic autocrine and paracrine regulator of hepatocyte regeneration. Proc Natl Acad Sci U S A. 1989;86:7432–7436. doi: 10.1073/pnas.86.19.7432. [DOI] [PMC free article] [PubMed] [Google Scholar]
- Kharitonenkov A, Shiyanova TL, Koester A, Ford AM, Micanovic R, Galbreath EJ, Sandusky GE, Hammond LJ, Moyers JS, Owens RA, et al. FGF-21 as a novel metabolic regulator. J Clin Invest. 2005;115:1627–1635. doi: 10.1172/JCI23606. [DOI] [PMC free article] [PubMed] [Google Scholar]
- Kouhara H, Hadari YR, Spivak-Kroizman T, Schilling J, Bar-Sagi D, Lax I, Schlessinger J. A lipid-anchored Grb2-binding protein that links FGF-receptor activation to the Ras/MAPK signaling pathway. Cell. 1997;89:693–702. doi: 10.1016/s0092-8674(00)80252-4. [DOI] [PubMed] [Google Scholar]
- Kurosu H, Choi M, Ogawa Y, Dickson AS, Goetz R, Eliseenkova AV, Mohammadi M, Rosenblatt KP, Kliewer SA, Kuro-o M. Tissue-specific expression of betaKlotho and fibroblast growth factor (FGF) receptor isoforms determines metabolic activity of FGF19 and FGF21. J Biol Chem. 2007;282:26687–26695. doi: 10.1074/jbc.M704165200. [DOI] [PMC free article] [PubMed] [Google Scholar]
- Larsson H, Klint P, Landgren E, Claesson-Welsh L. Fibroblast growth factor receptor-1-mediated endothelial cell proliferation is dependent on the Src homology (SH) 2/SH3 domain-containing adaptor protein Crk. J Biol Chem. 1999;274:25726–25734. doi: 10.1074/jbc.274.36.25726. [DOI] [PubMed] [Google Scholar]
- Lemmon MA, Schlessinger J. Cell signaling by receptor tyrosine kinases. Cell. 2010;141:1117–1134. doi: 10.1016/j.cell.2010.06.011. [DOI] [PMC free article] [PubMed] [Google Scholar]
- Li Y, Basilico C, Mansukhani A. Cell transformation by fibroblast growth factors can be suppressed by truncated fibroblast growth factor receptors. Mol Cell Biol. 1994;14:7660–7669. doi: 10.1128/mcb.14.11.7660. [DOI] [PMC free article] [PubMed] [Google Scholar]
- Makarenkova HP, Hoffman MP, Beenken A, Eliseenkova AV, Meech R, Tsau C, Patel VN, Lang RA, Mohammadi M. Differential interactions of FGFs with heparan sulfate control gradient formation and branching morphogenesis. Sci Signal. 2009;2:ra55. doi: 10.1126/scisignal.2000304. [DOI] [PMC free article] [PubMed] [Google Scholar]
- Mohammadi M, Dikic I, Sorokin A, Burgess WH, Jaye M, Schlessinger J. Identification of six novel autophosphorylation sites on fibroblast growth factor receptor 1 and elucidation of their importance in receptor activation and signal transduction. Mol Cell Biol. 1996;16:977–989. doi: 10.1128/mcb.16.3.977. [DOI] [PMC free article] [PubMed] [Google Scholar]
- Mohammadi M, Olsen SK, Ibrahimi OA. Structural basis for fibroblast growth factor receptor activation. Cytokine Growth Factor Rev. 2005;16:107–137. doi: 10.1016/j.cytogfr.2005.01.008. [DOI] [PubMed] [Google Scholar]
- Nabel EG, Yang ZY, Plautz G, Forough R, Zhan X, Haudenschild CC, Maciag T, Nabel GJ. Recombinant fibroblast growth factor-1 promotes intimal hyperplasia and angiogenesis in arteries in vivo. Nature. 1993;362:844–846. doi: 10.1038/362844a0. [DOI] [PubMed] [Google Scholar]
- Nakamura M, Uehara Y, Asada M, Honda E, Nagai N, Kimata K, Suzuki M, Imamura T. Sulfated glycosaminoglycans are required for specific and sensitive fibroblast growth factor (FGF) 19 signaling via FGF receptor 4 and betaKlotho. J Biol Chem. 2011;286:26418–26423. doi: 10.1074/jbc.M111.251140. [DOI] [PMC free article] [PubMed] [Google Scholar]
- Ogawa Y, Kurosu H, Yamamoto M, Nandi A, Rosenblatt KP, Goetz R, Eliseenkova AV, Mohammadi M, Kuro-o M. BetaKlotho is required for metabolic activity of fibroblast growth factor 21. Proc Natl Acad Sci U S A. 2007;104:7432–7437. doi: 10.1073/pnas.0701600104. [DOI] [PMC free article] [PubMed] [Google Scholar]
- Olsen SK, Li JY, Bromleigh C, Eliseenkova AV, Ibrahimi OA, Lao Z, Zhang F, Linhardt RJ, Joyner AL, Mohammadi M. Structural basis by which alternative splicing modulates the organizer activity of FGF8 in the brain. Genes Dev. 2006;20:185–198. doi: 10.1101/gad.1365406. [DOI] [PMC free article] [PubMed] [Google Scholar]
- Ornitz DM, Xu J, Colvin JS, McEwen DG, MacArthur CA, Coulier F, Gao G, Goldfarb M. Receptor specificity of the fibroblast growth factor family. J Biol Chem. 1996;271:15292–15297. doi: 10.1074/jbc.271.25.15292. [DOI] [PubMed] [Google Scholar]
- Plotnikov AN, Hubbard SR, Schlessinger J, Mohammadi M. Crystal structures of two FGF-FGFR complexes reveal the determinants of ligand-receptor specificity. Cell. 2000;101:413–424. doi: 10.1016/s0092-8674(00)80851-x. [DOI] [PubMed] [Google Scholar]
- Saltiel AR, Kahn CR. Insulin signalling and the regulation of glucose and lipid metabolism. Nature. 2001;414:799–806. doi: 10.1038/414799a. [DOI] [PubMed] [Google Scholar]
- Schlessinger J, Lemmon MA. SH2 and PTB domains in tyrosine kinase signaling. Sci STKE. 2003;2003:RE12. doi: 10.1126/stke.2003.191.re12. [DOI] [PubMed] [Google Scholar]
- Schlessinger J, Plotnikov AN, Ibrahimi OA, Eliseenkova AV, Yeh BK, Yayon A, Linhardt RJ, Mohammadi M. Crystal structure of a ternary FGF-FGFR-heparin complex reveals a dual role for heparin in FGFR binding and dimerization. Mol Cell. 2000;6:743–750. doi: 10.1016/s1097-2765(00)00073-3. [DOI] [PubMed] [Google Scholar]
- Seo JH, Suenaga A, Hatakeyama M, Taiji M, Imamoto A. Structural and functional basis of a role for CRKL in a fibroblast growth factor 8-induced feed-forward loop. Mol Cell Biol. 2009;29:3076–3087. doi: 10.1128/MCB.01686-08. [DOI] [PMC free article] [PubMed] [Google Scholar]
- Suh JM, Jonker JW, Ahmadian M, Goetz R, Lackey D, Osborn O, Huang Z, Liu W, Yoshihara E, van Dijk TH, et al. Endocrinization of FGF1 produces a neomorphic and potent insulin sensitizer. Nature. 2014;513:436–439. doi: 10.1038/nature13540. [DOI] [PMC free article] [PubMed] [Google Scholar]
- Suzuki M, Uehara Y, Motomura-Matsuzaka K, Oki J, Koyama Y, Kimura M, Asada M, Komi-Kuramochi A, Oka S, Imamura T. betaKlotho is required for fibroblast growth factor (FGF) 21 signaling through FGF receptor (FGFR) 1c and FGFR3c. Mol Endocrinol. 2008;22:1006–1014. doi: 10.1210/me.2007-0313. [DOI] [PMC free article] [PubMed] [Google Scholar]
- Swanson MD, Boudreaux DM, Salmon L, Chugh J, Winter HC, Meagher JL, Andre S, Murphy PV, Oscarson S, Roy R, et al. Engineering a Therapeutic Lectin by Uncoupling Mitogenicity from Antiviral Activity. Cell. 2015;163:746–758. doi: 10.1016/j.cell.2015.09.056. [DOI] [PMC free article] [PubMed] [Google Scholar]
- Urakawa I, Yamazaki Y, Shimada T, Iijima K, Hasegawa H, Okawa K, Fujita T, Fukumoto S, Yamashita T. Klotho converts canonical FGF receptor into a specific receptor for FGF23. Nature. 2006;444:770–774. [Google Scholar]
- Wiedlocha A, Falnes PO, Rapak A, Munoz R, Klingenberg O, Olsnes S. Stimulation of proliferation of a human osteosarcoma cell line by exogenous acidic fibroblast growth factor requires both activation of receptor tyrosine kinase and growth factor internalization. Mol Cell Biol. 1996;16:270–280. doi: 10.1128/mcb.16.1.270. [DOI] [PMC free article] [PubMed] [Google Scholar]
- Wu X, Ge H, Lemon B, Vonderfecht S, Baribault H, Weiszmann J, Gupte J, Gardner J, Lindberg R, Wang Z, et al. Separating mitogenic and metabolic activities of fibroblast growth factor 19 (FGF19) Proc Natl Acad Sci U S A. 2010a;107:14158–14163. doi: 10.1073/pnas.1009427107. [DOI] [PMC free article] [PubMed] [Google Scholar]
- Wu XL, Ge HF, Lemon B, Vonderfecht S, Baribault H, Weiszmann J, Gupte J, Gardner J, Lindberg R, Wang ZL, et al. Separating mitogenic and metabolic activities of fibroblast growth factor 19 (FGF19) Proc Natl Acad Sci U S A. 2010b;107:14158–14163. doi: 10.1073/pnas.1009427107. [DOI] [PMC free article] [PubMed] [Google Scholar]
- Yeh BK, Igarashi M, Eliseenkova AV, Plotnikov AN, Sher I, Ron D, Aaronson SA, Mohammadi M. Structural basis by which alternative splicing confers specificity in fibroblast growth factor receptors. Proc Natl Acad Sci U S A. 2003;100:2266–2271. doi: 10.1073/pnas.0436500100. [DOI] [PMC free article] [PubMed] [Google Scholar]
- Yie J, Hecht R, Patel J, Stevens J, Wang W, Hawkins N, Steavenson S, Smith S, Winters D, Fisher S, et al. FGF21 N- and C-termini play different roles in receptor interaction and activation. FEBS Lett. 2009;583:19–24. doi: 10.1016/j.febslet.2008.11.023. [DOI] [PubMed] [Google Scholar]
- Zhang X, Ibrahimi OA, Olsen SK, Umemori H, Mohammadi M, Ornitz DM. Receptor specificity of the fibroblast growth factor family. The complete mammalian FGF family. J Biol Chem. 2006a;281:15694–15700. doi: 10.1074/jbc.M601252200. [DOI] [PMC free article] [PubMed] [Google Scholar]
- Zhang Y, Lee FY, Barrera G, Lee H, Vales C, Gonzalez FJ, Willson TM, Edwards PA. Activation of the nuclear receptor FXR improves hyperglycemia and hyperlipidemia in diabetic mice. Proc Natl Acad Sci U S A. 2006b;103:1006–1011. doi: 10.1073/pnas.0506982103. [DOI] [PMC free article] [PubMed] [Google Scholar]
Associated Data
This section collects any data citations, data availability statements, or supplementary materials included in this article.